01-12-2026: March Class III Milk (DLH26): Cheddar Cheese Prices, Seasonals, Cow Production, Falling Exports |




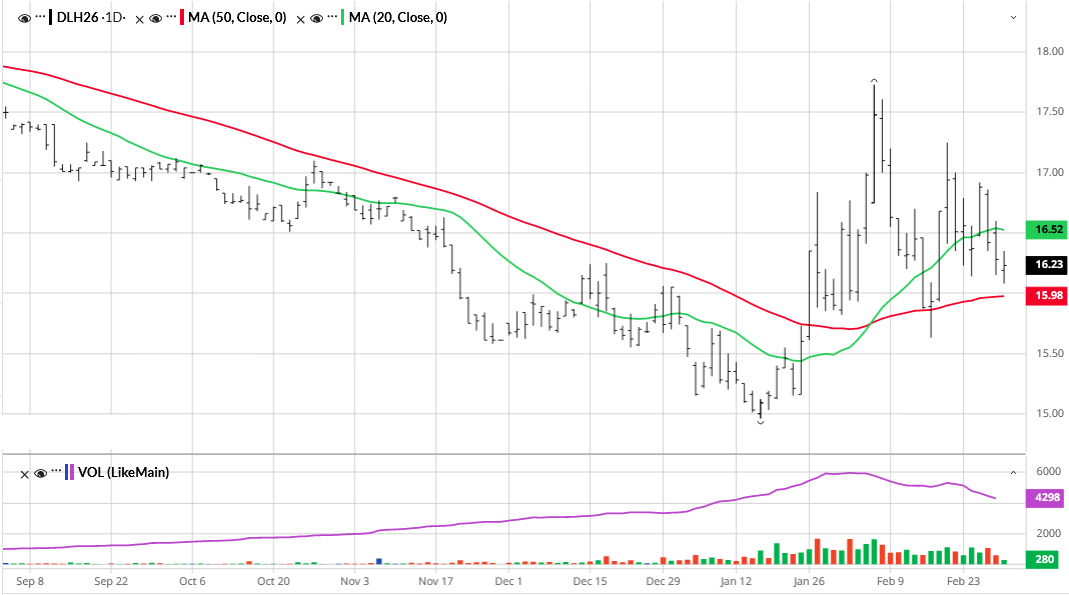
Moving Average Chart |
Moving Average with Confirmations |
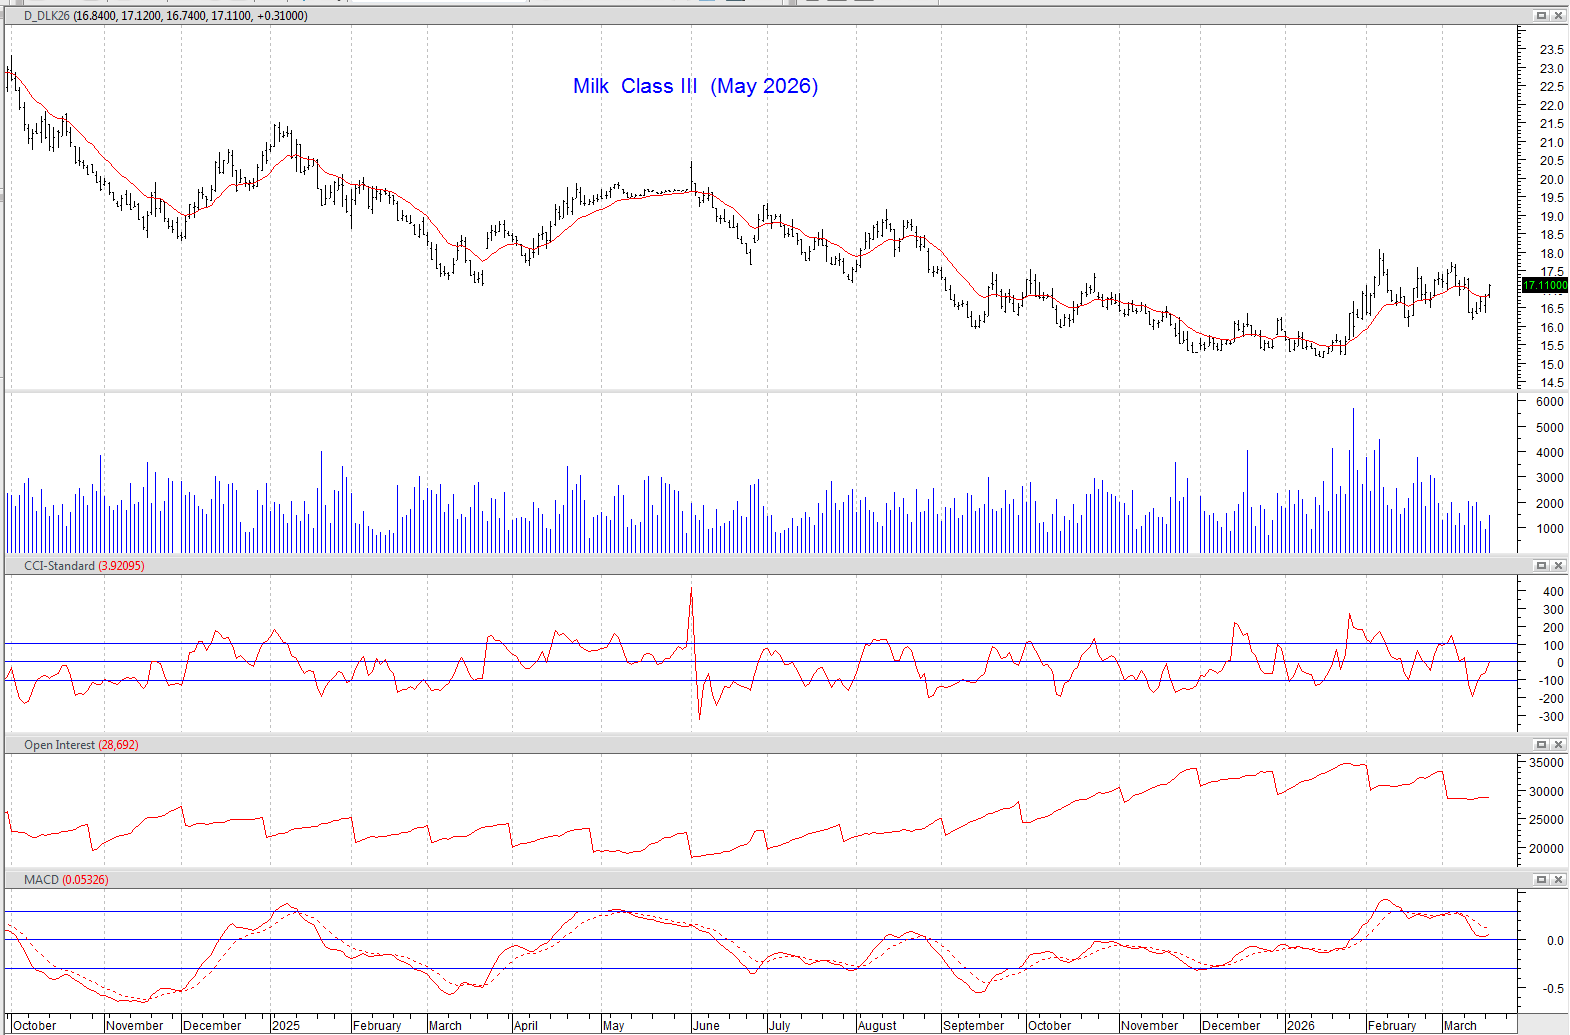
The idea behind this chart reflects YouTube traders' beliefs that siple indicators work best. Their idea is to fit the periof of the moving average by trial and error to where it appeats the price hovering near or crossing the moving average often (but ot always) gives the most reliable signals for a reversal. We attepted the "fit" and then looked for confirmations. Colnfirmations were when the Commodity Channel Index exceeded + or - 100, or when the MACD line sinks below or rises above a "reasonable" distance from tghe center line. In hose cases, the MA signal is to be taken more seriously, other times less so. Based upon that, this method would suggest the previous major shift was to an uptrend still in p;rogress, but due to seasonal and other factors, mensioned elsewherein thie article, we think the safer bet is for a continued downmove in milk prices.
Intermarket Analysis |
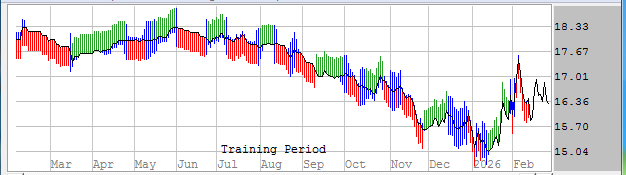
We fed Milk and Live Cattle into a neural network to get the following result:
|
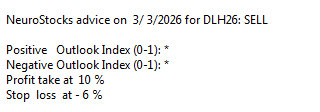
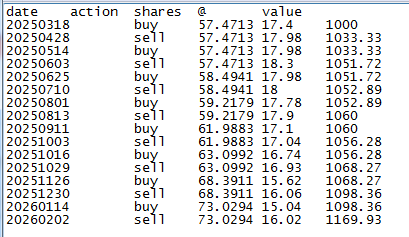
The way this is supposed to work is that bar-height indicates confidence level in predictions based upon data fed into a neural network. The taller the bars, the better the confidence level. What we see here is a succession of successful trades within a major continuing downtrend.
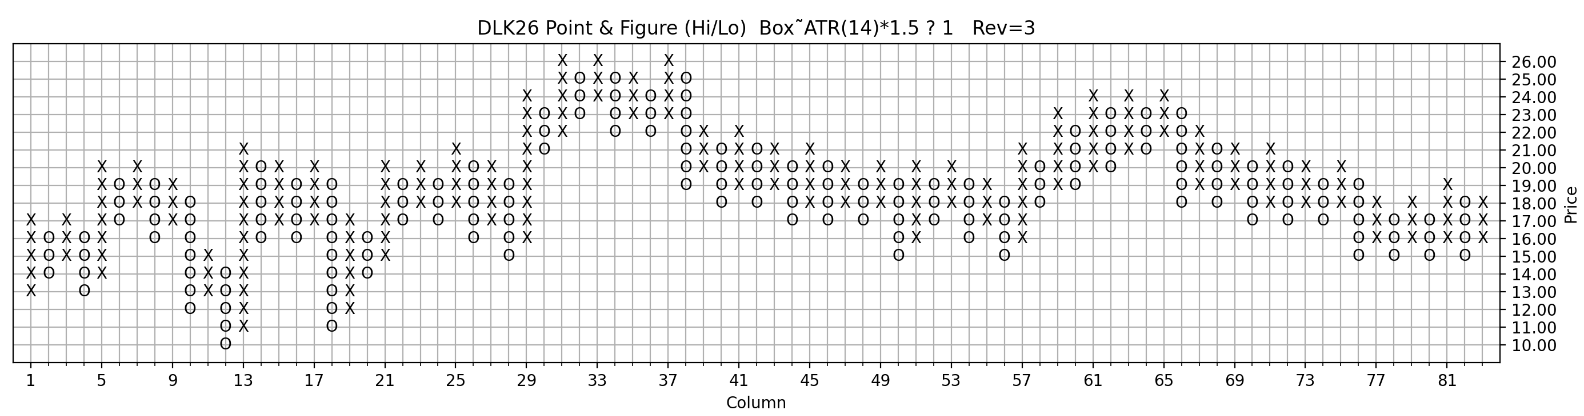
Point & Figure Chart |
Reaction-Trend Program |
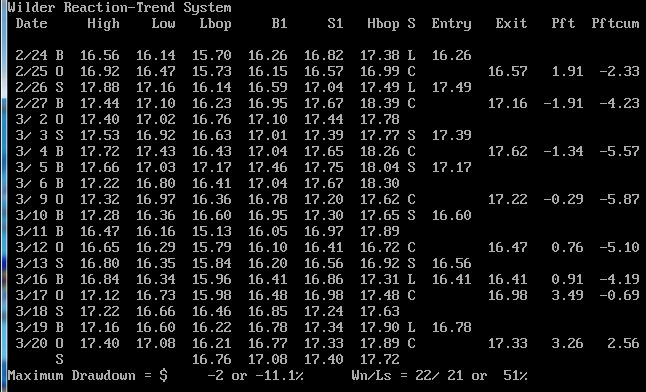
This method is giving too many false signals, not decidely reacting or trending, suggest using a different approach with longer holding periods.