![]()
Corporate Webpages Pennymac Financial Services Inc.
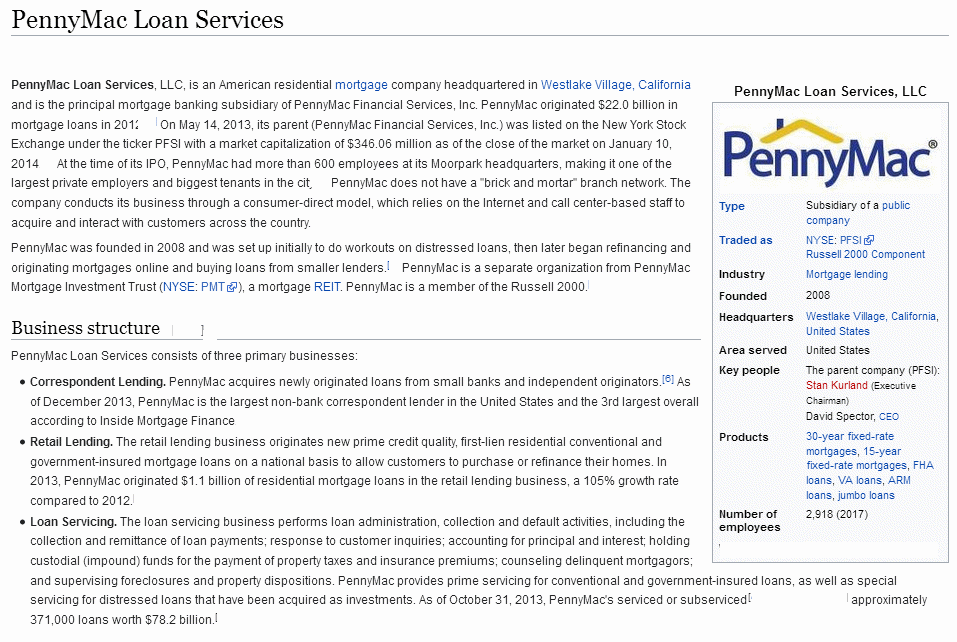
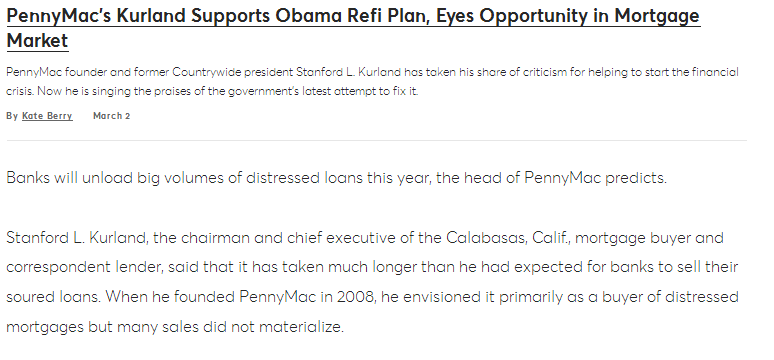
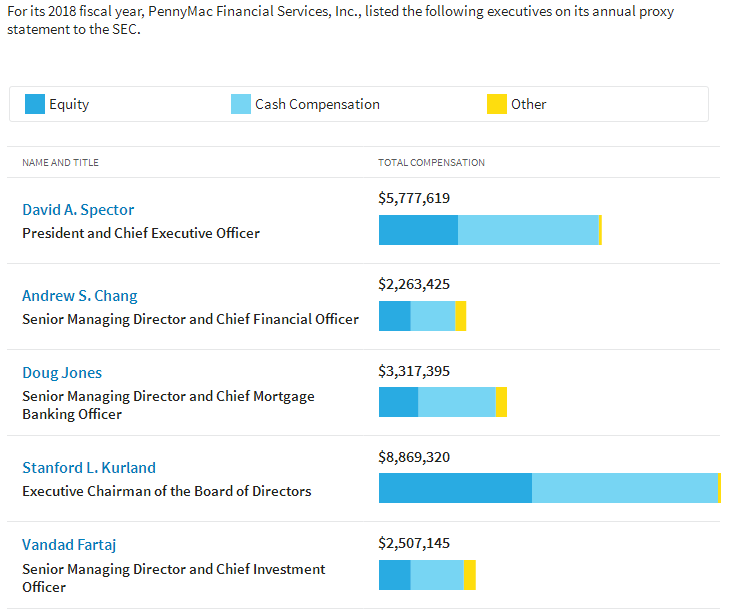
Probably the first thing you want to know about Pennymac
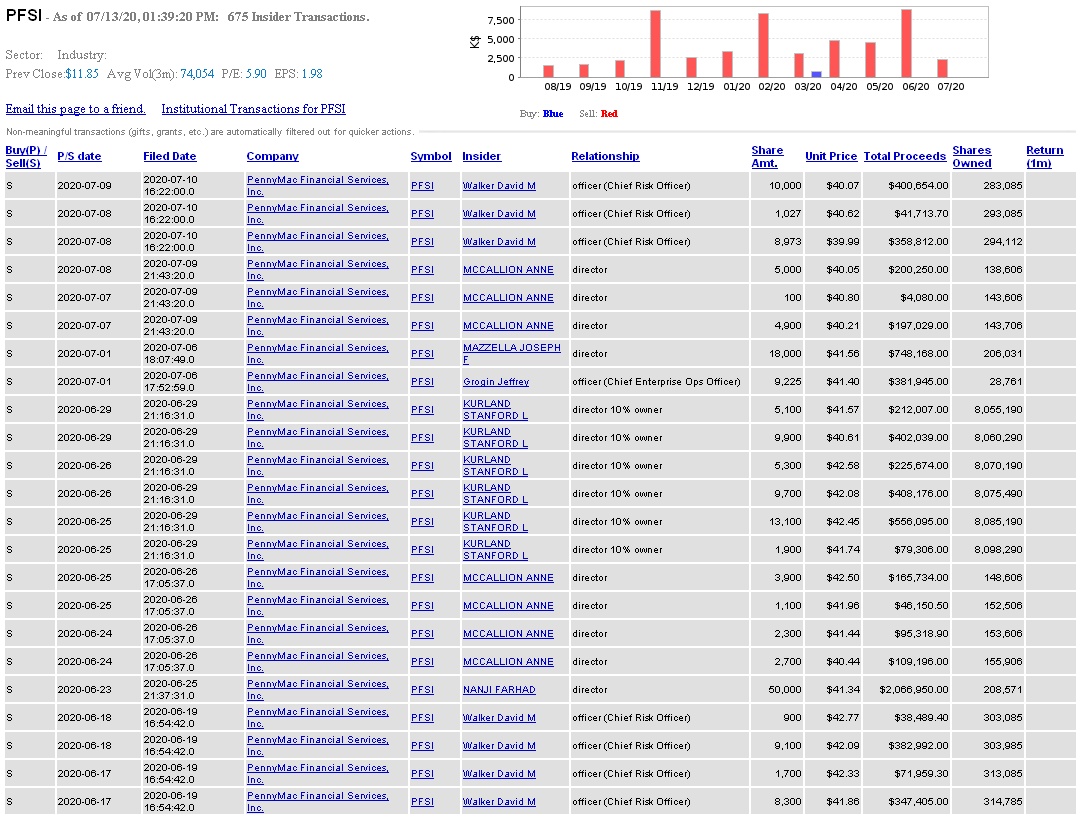
Financial Services Inc. (PFSI) is that Stanford Kurland is
Chairman of the Board of Directors and highest-paid manager.
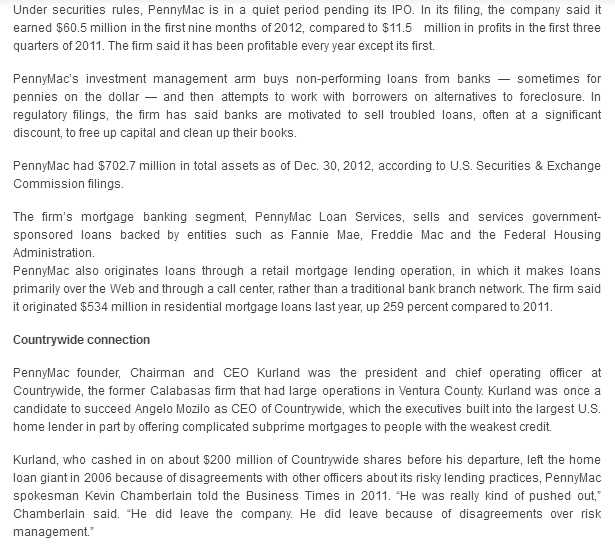
He was associated with Countrywide Mortgage in Southern
California which in turn was later associated with Bank of America.
It was known for making subprime loans and fell apart or driven
into extinction by regulators in the 2008 subprime lending
crisis, after Kurland sold off $200,000,000 worth of his shares
in Countrywide.
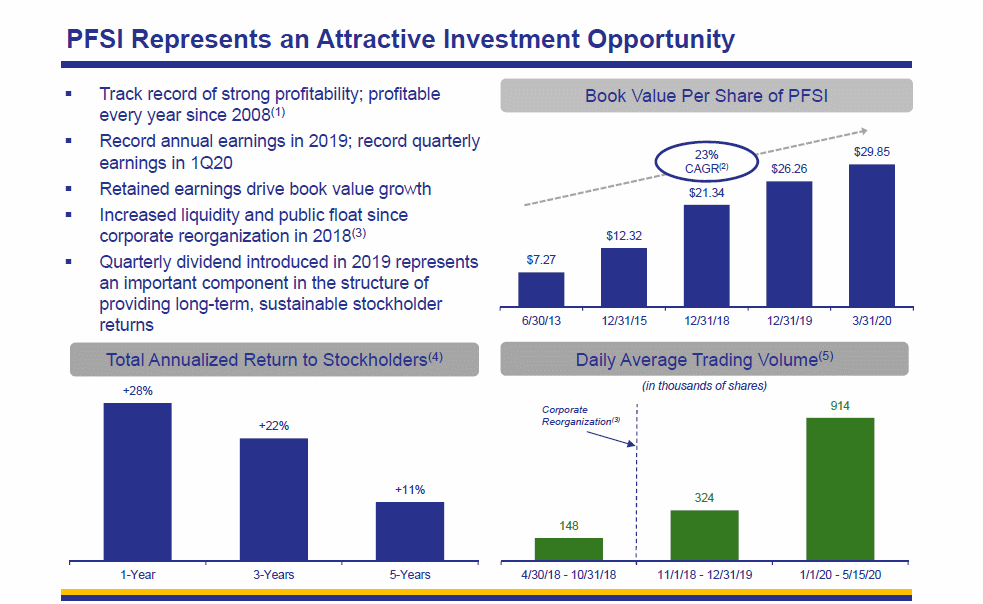
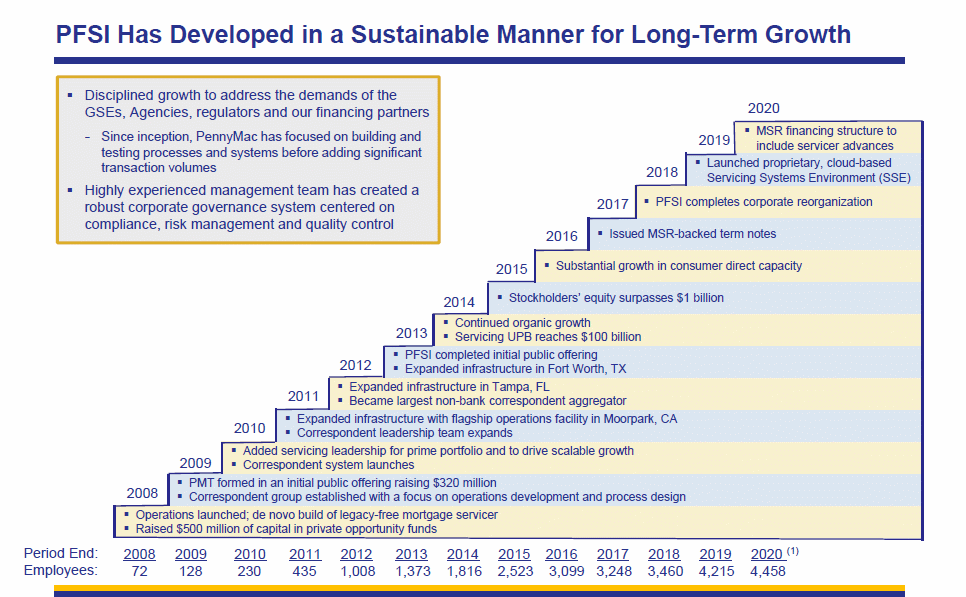
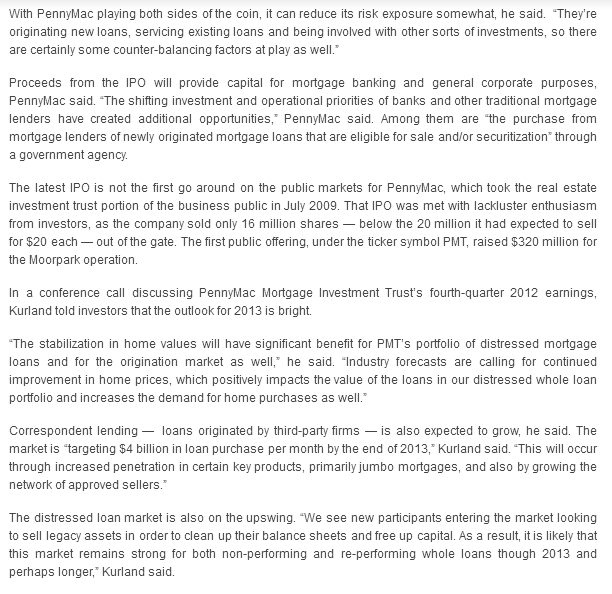
Pennymac was set up in 2008 and listed on the NYSE in 2013. It
was described as a "new venture" picking up the pieces of the
real estate meltdown of Countrywide. Kurland was never
prosecuted for his role in Countrywide sub-prime loans.
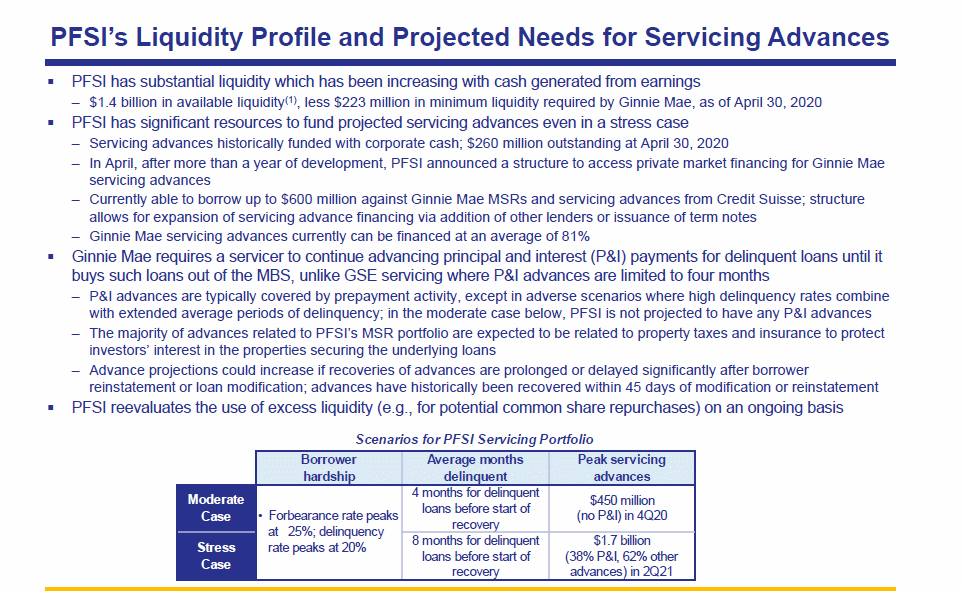
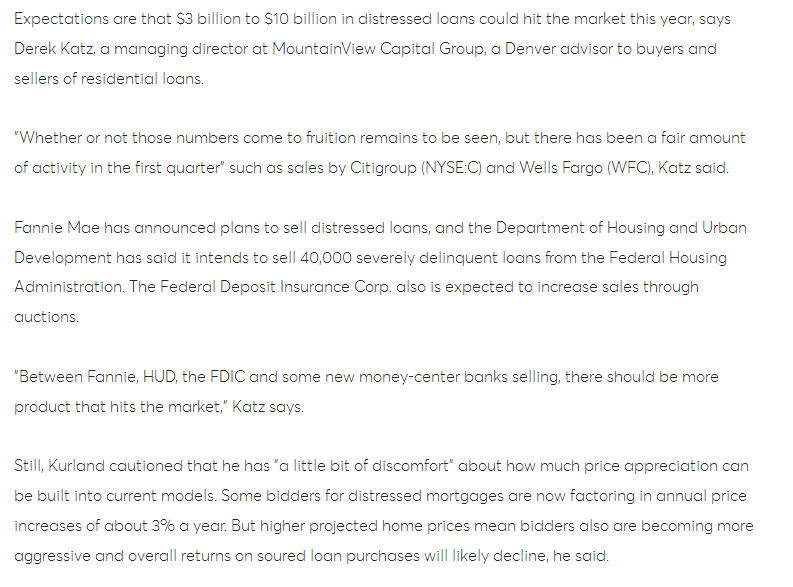
The company is keenly aware of government bailout programs to
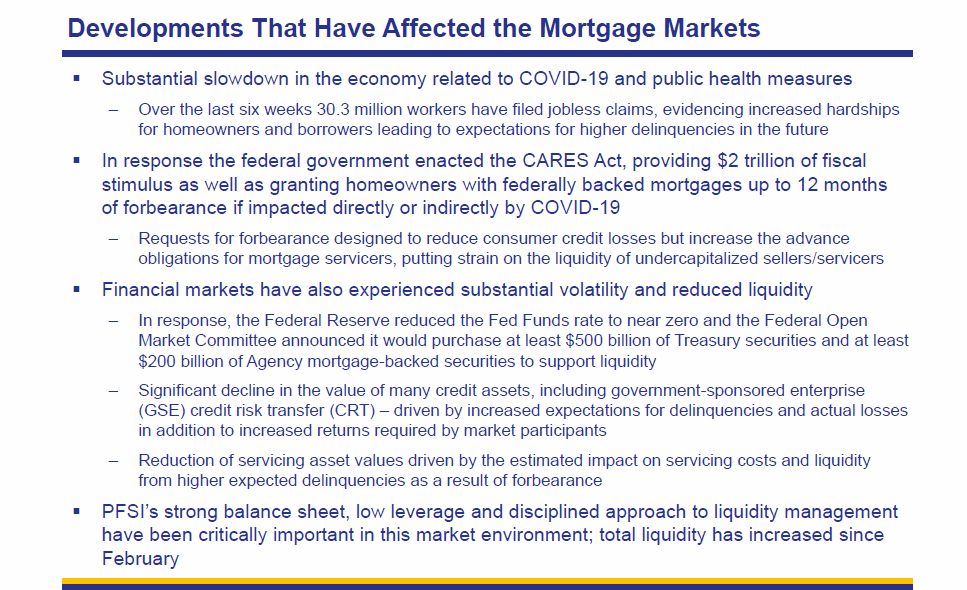
help distressed lendees. We found its "Management Discussion"
writeup unacceptably complicated and vague. However, the
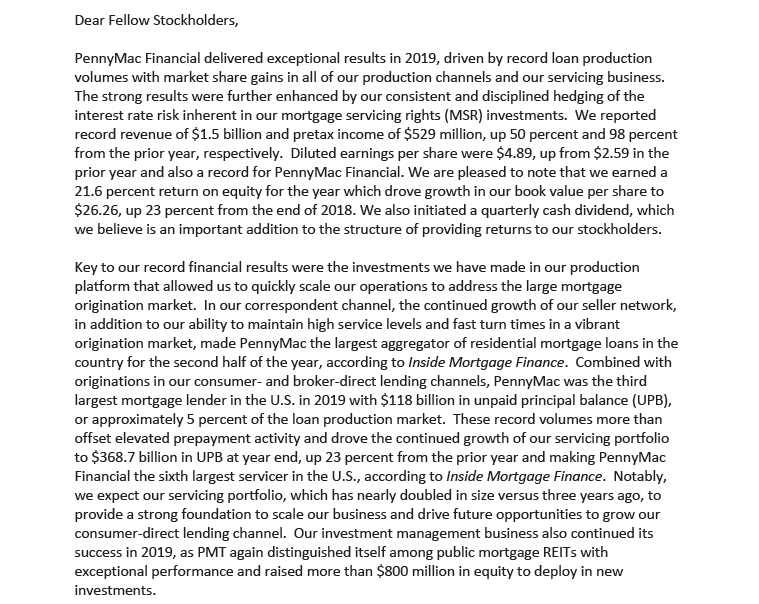
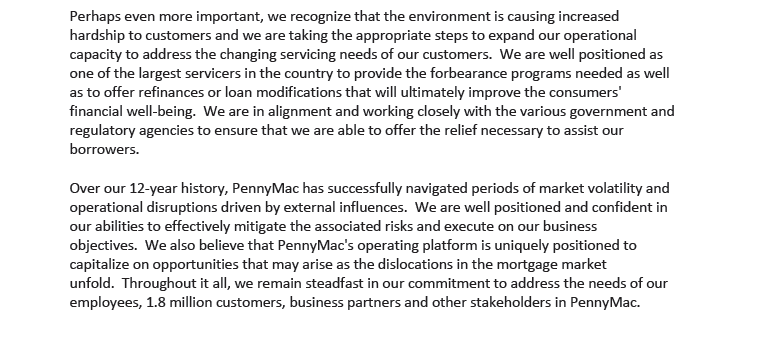
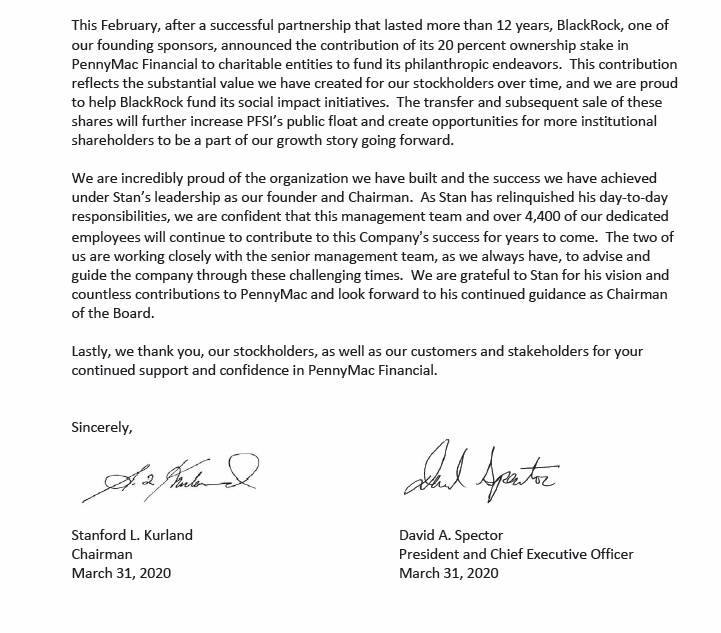
company has a CEO Letter to Shareholders and shows investor
concern even to the extent of a special dividend and regular
dividends amounting to around 1%.
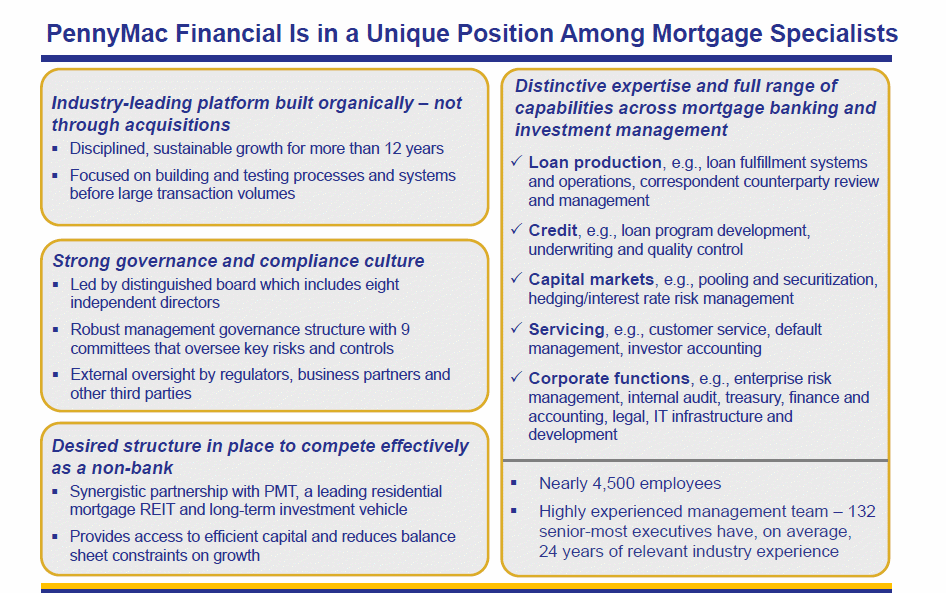
Many employees are holdovers from the Countrywide era and Bank of America
connections, with B of A having a processing center in So. Calif. located close
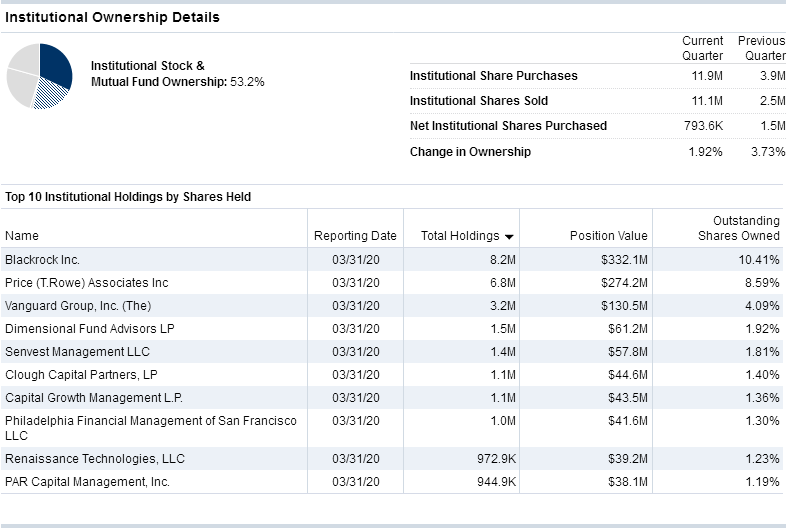
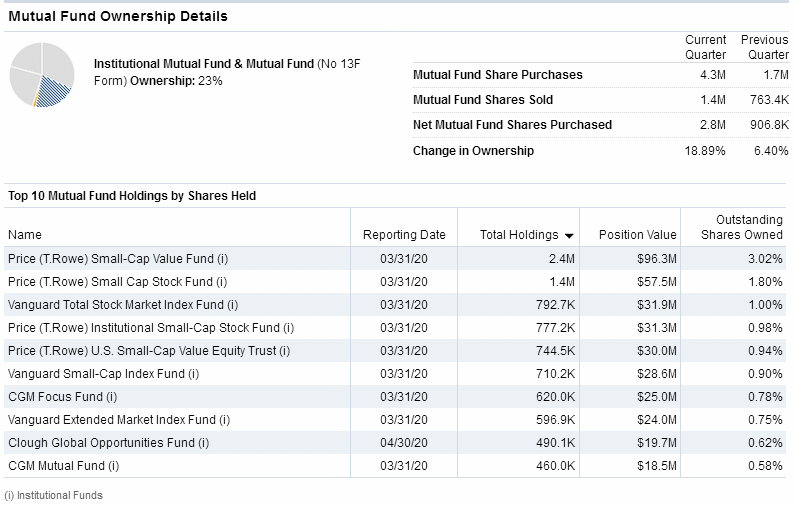
to Pennymac's offices. Executives seem overpaid to us. Still, institutions are
net acquirers and Dimensional Fund Advisors is present among the major
stockholders, which we regard as a good sign.
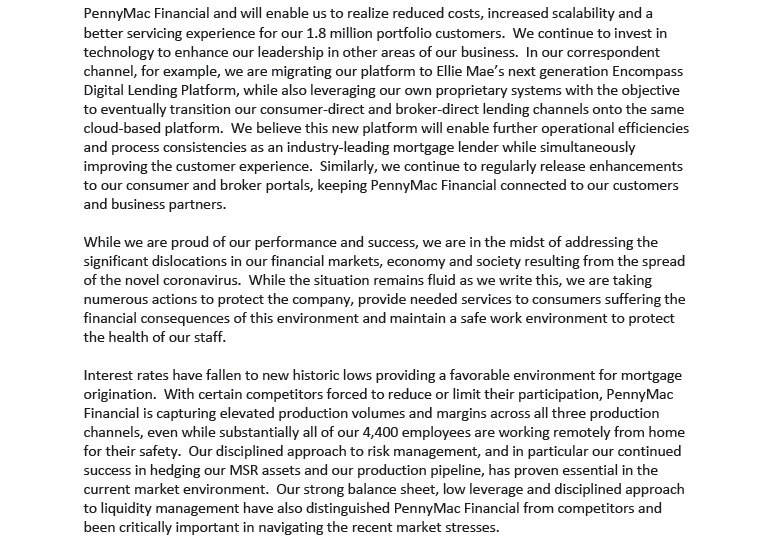
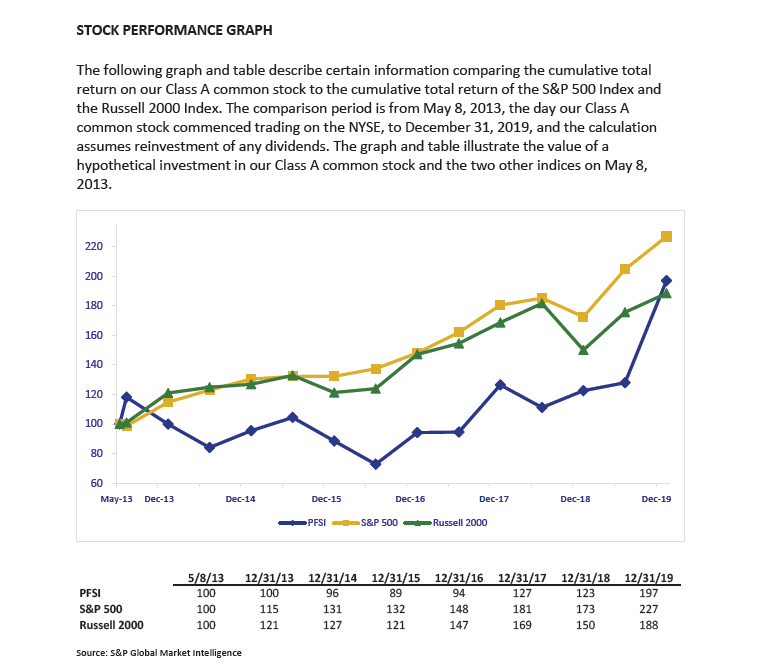
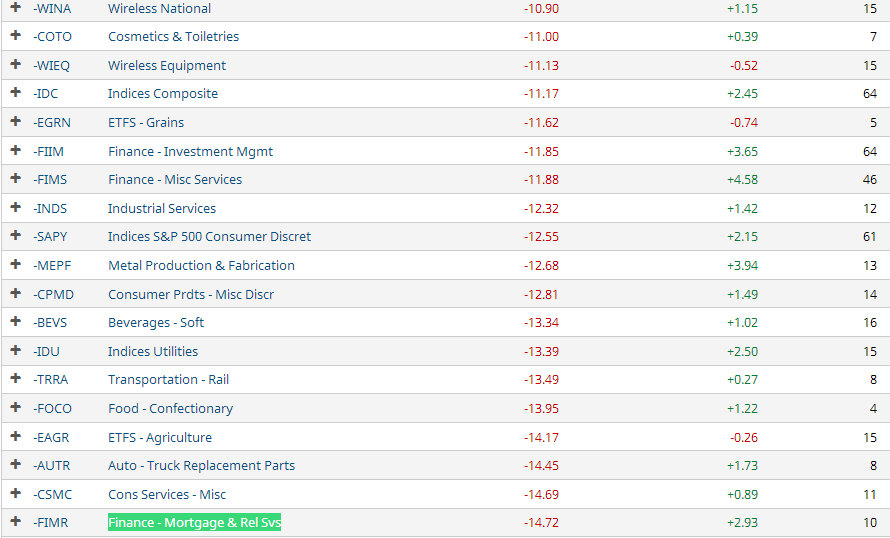
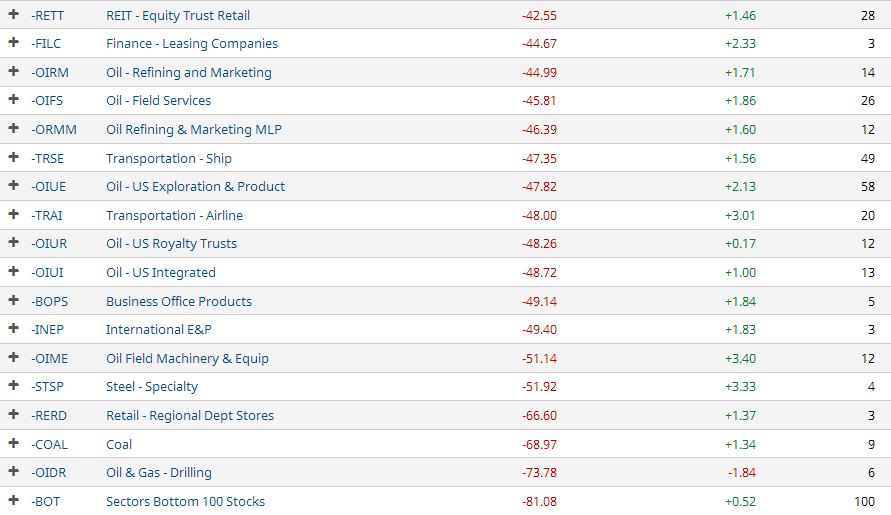
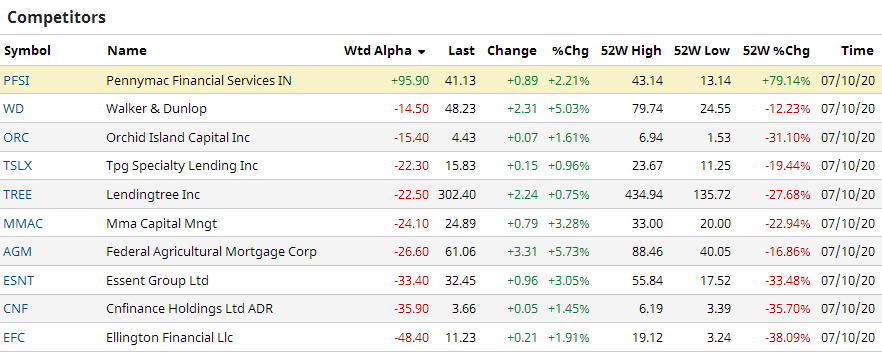
The stock has been on a strong upswing, leading all its competitors
in the mortgage servicing industry, which is of late a somewhat
weak industry group. However, both researchers and analysts
seem to agree the group shows a lot of promise because of
continual refinancing business in a situation where the Federal
Reserve is not anticipated to increase interest rates any time soon.
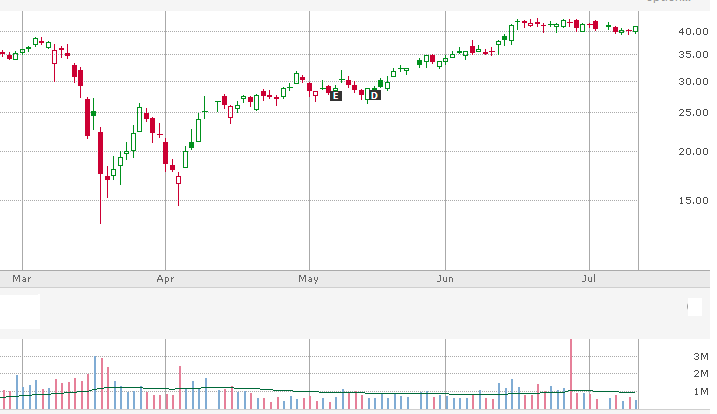
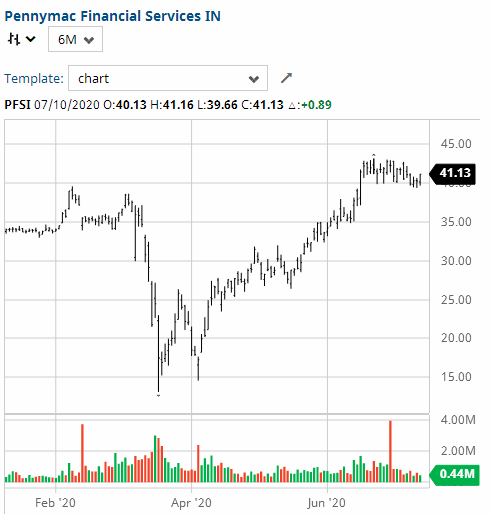
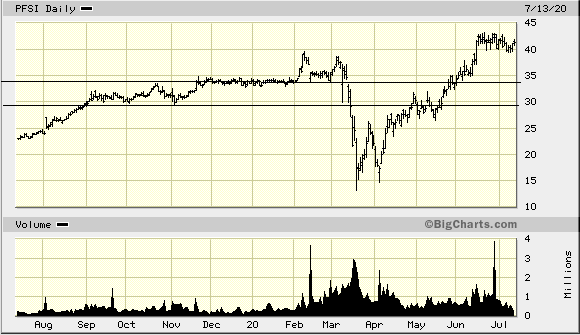
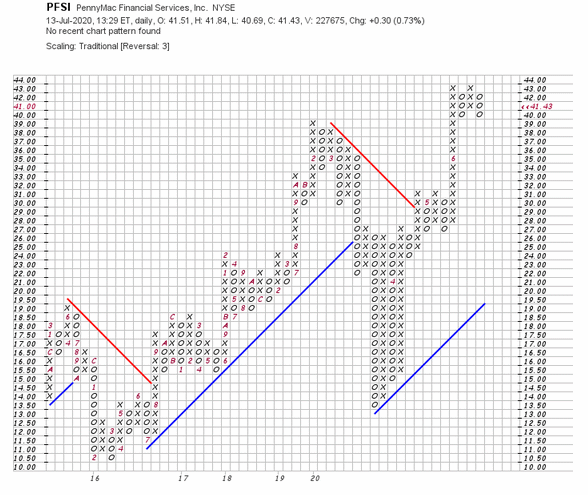
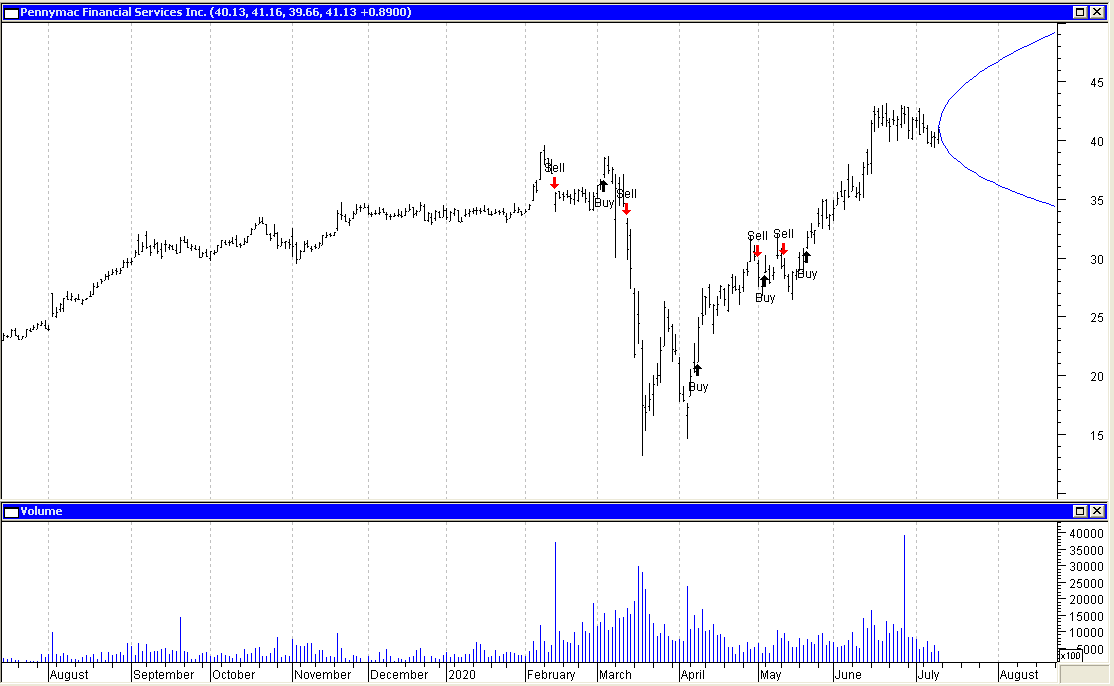
Stock charts look a little toppy, and while the stock melt down
in the pandemic crisis, it appears to be back above a recent
trading range into a new "breakout" range around $40+ / share.
Most analysts and researchers consider this area low risk
although projected earnings for next year are lower. The refi
business is anticipated to continue strong but taper off from
current levels.
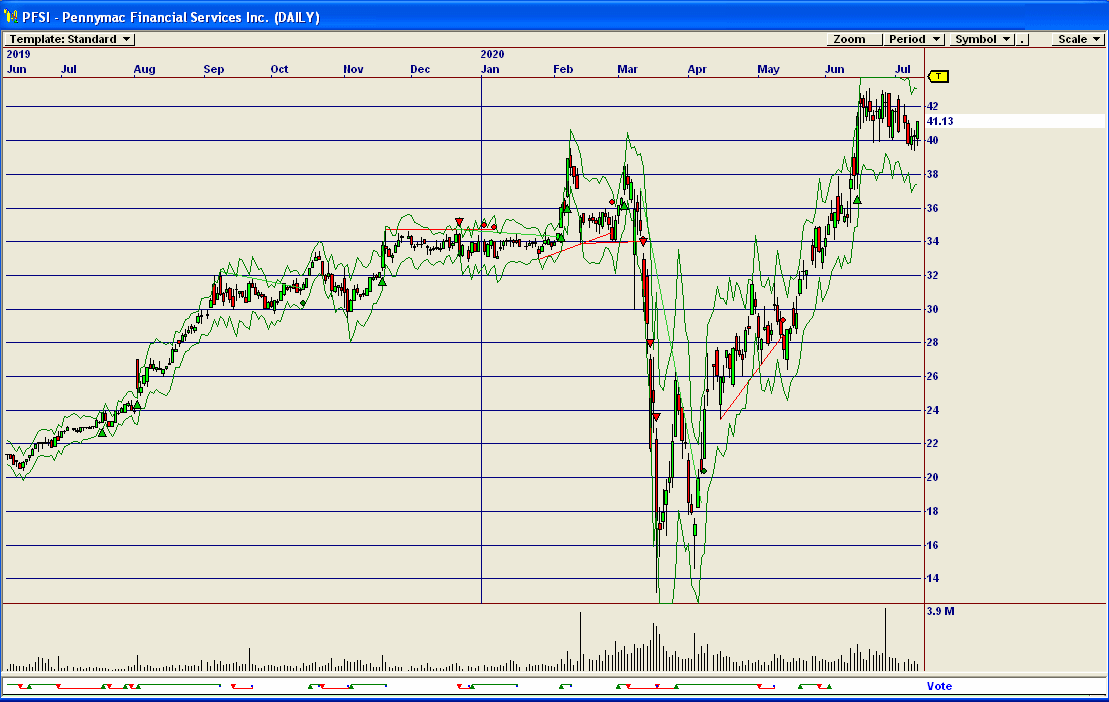
The stock tends to be reactive after establishing trading ranges
offering trading opportunities with indicators like Bollinger
Bands (reacting off of band extremes) working well.
The stock is normally fairly benign in slowly increasing in
value but it has nearly tripled in the past few months from a
brief pandemic low panic selling, so some care is indicated
because of its ability to make extreme moves without warning.
(WAIT FOR PAGE TO LOAD COMPLETELY BEFORE LINKS WORK.)
Company Profile
Company History
News
Comparison with Peers
Bond Issue
Zenith Index
Financial Statements
Avg. P/E to Current P/E
Financial Ratios
Intrinsic Value (Disc. CashFlow)
Fair Value Estimator
Projected Earnings
Research Reports
Analysts' Opinions
Insider Activity
Institutional Activity
Sentiment
Short Interest
Standard & Poor's
Management's Discussion
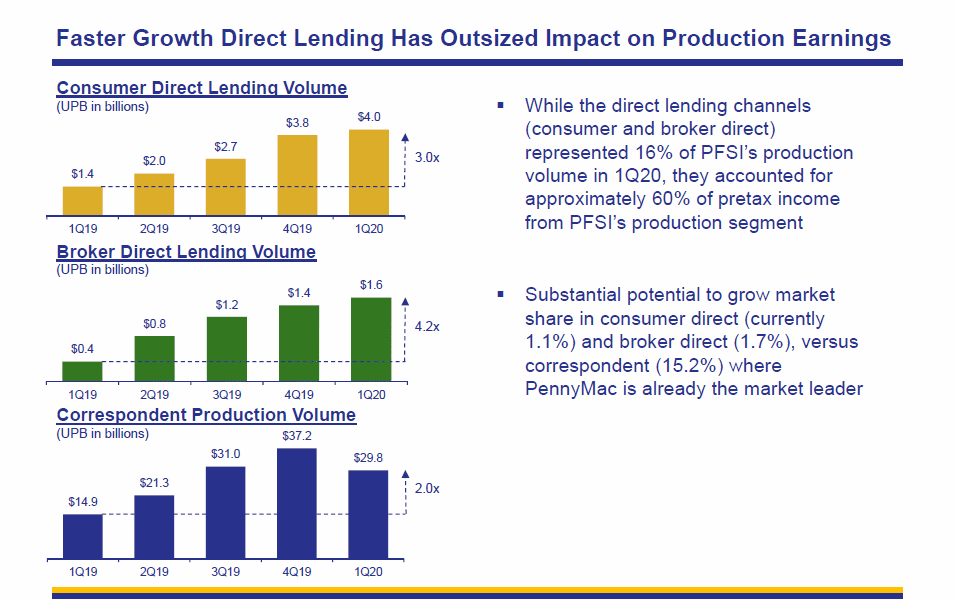
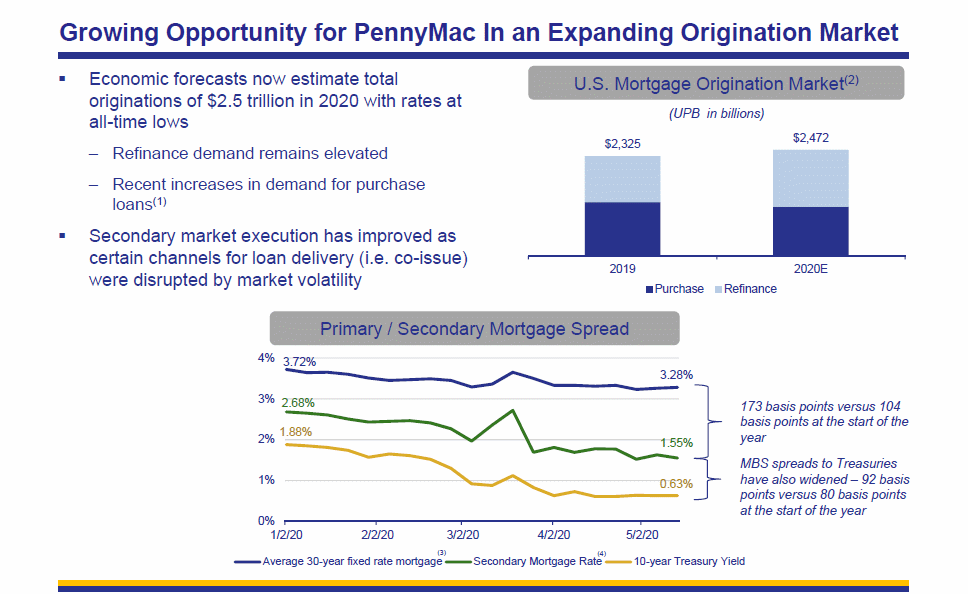
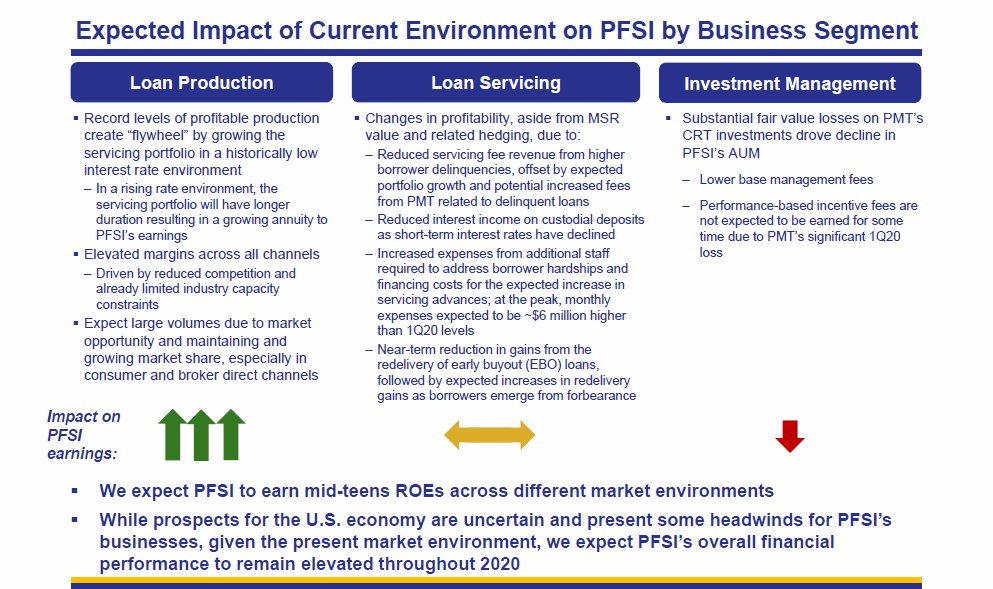
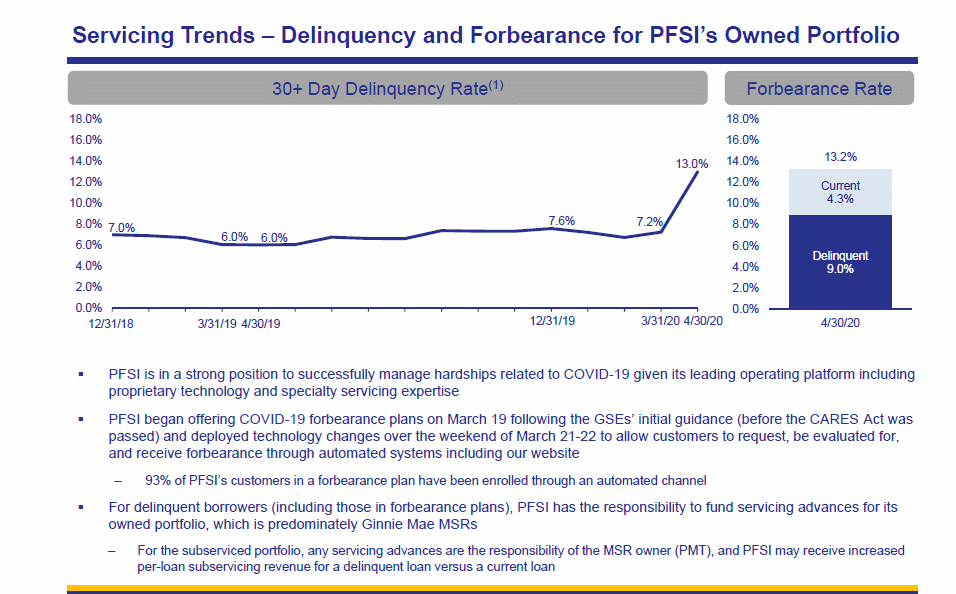
Channel Potential
MACD Histogram
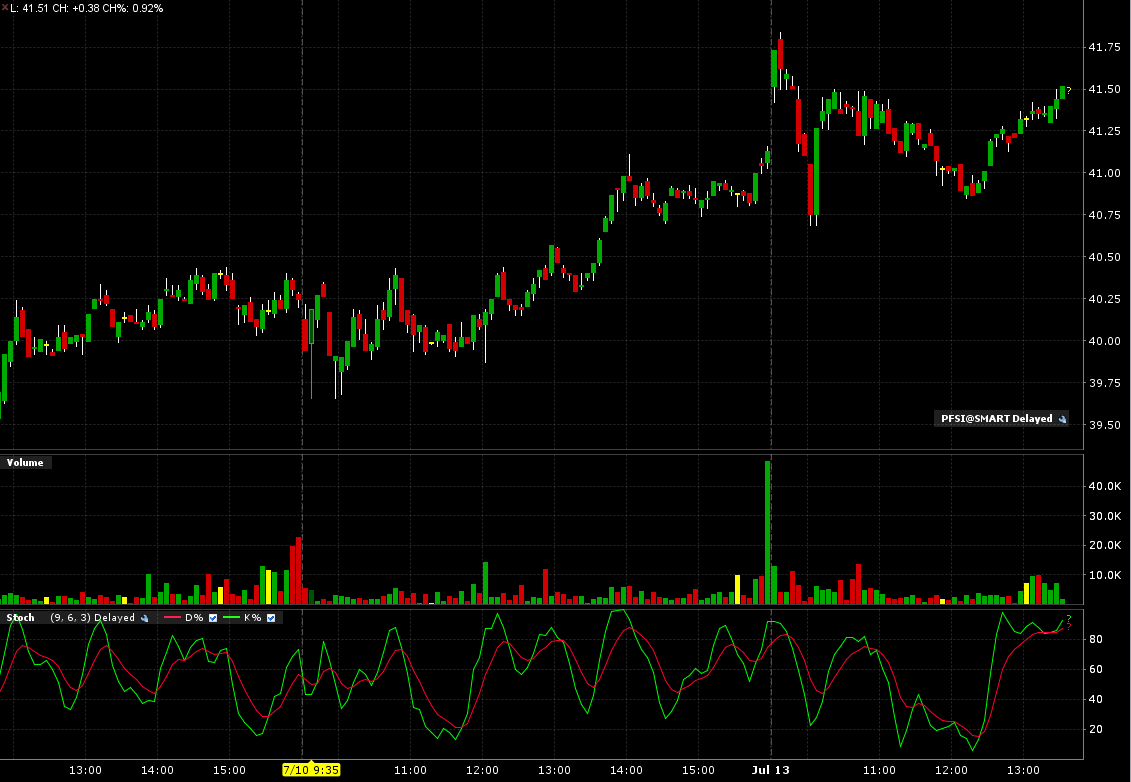
Intraday Chart
Val Idea
Stock Consultant
Point & Figure Chart
Wall Street Analyzer
Marketspace Chart
Time Series Forecast
Neural Network Prediction
Stock Options
Ultimate Trading Systems
Recommendation

Company Profile |

Company History |


News |
Comparison |
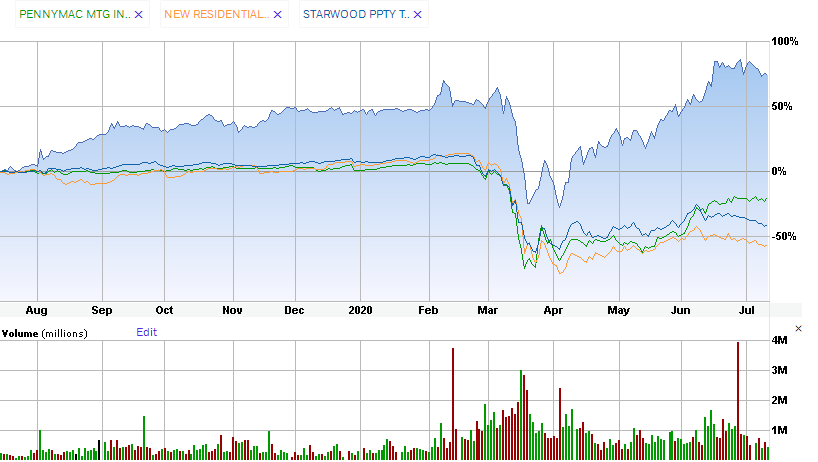
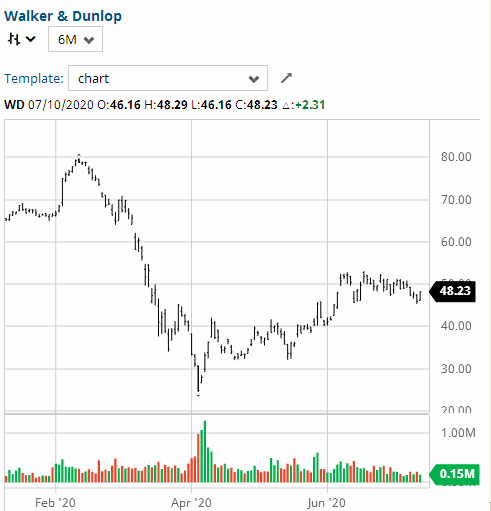
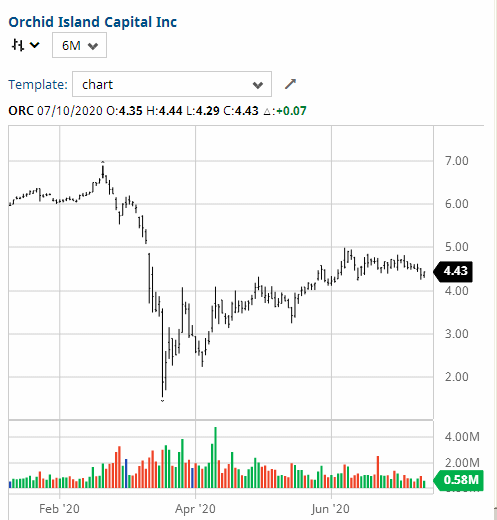
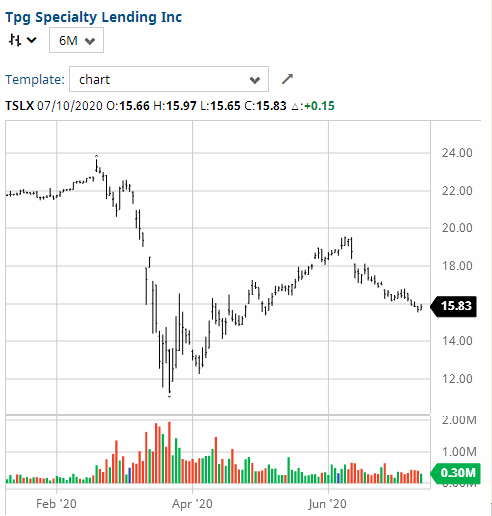
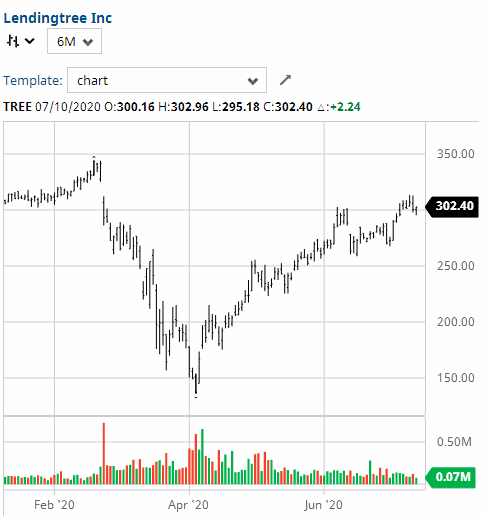
Similar Companies Performance:
Bond Issue |

Zenith Index |
Under current market conditions, a Zenith Index Score of 1.20 or above is required for a positive rating on this factor. 1.21 -1.30 is considered acceptable, 1.30-1.40 is considered strong and
> 1.40 is considered exceptionally strong. Accounting statements in this section often contain mistakes, especially in earlier years' totals, but data is deemed sufficient for us to give a rating. More accurate financial statements follow in the next section.
PFSI  PennyMac Financial Services, Inc.
   Exchange: NASD                          Group: Financial - Mortgage
   Rank of Industry:  32%                  Rank within Industry: 81 out of 252

      Shares Out:   79.23 (mil.)   Market Capitalization:$  3,258.81 (mil.)
      Sales (12 mo.): $  1,477.00 (mil.)              Sales Growth: 191.41%
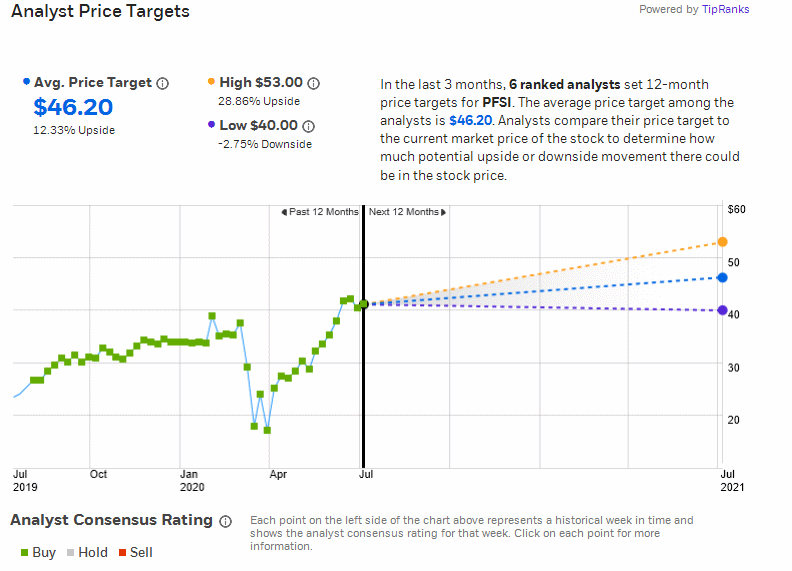
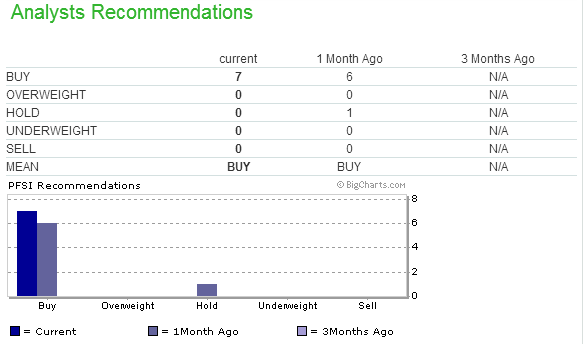
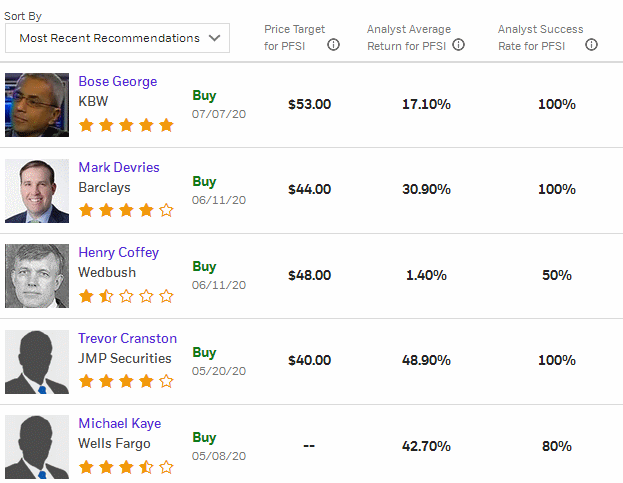
      Avg Broker Recommend (1=Strong Buy): 1.20   Consensus Target:  45.00
      Dividend:$ 0.00  Yield: 1.17%  Payout Ratio: 0.06  Payout Chg:  0.00%

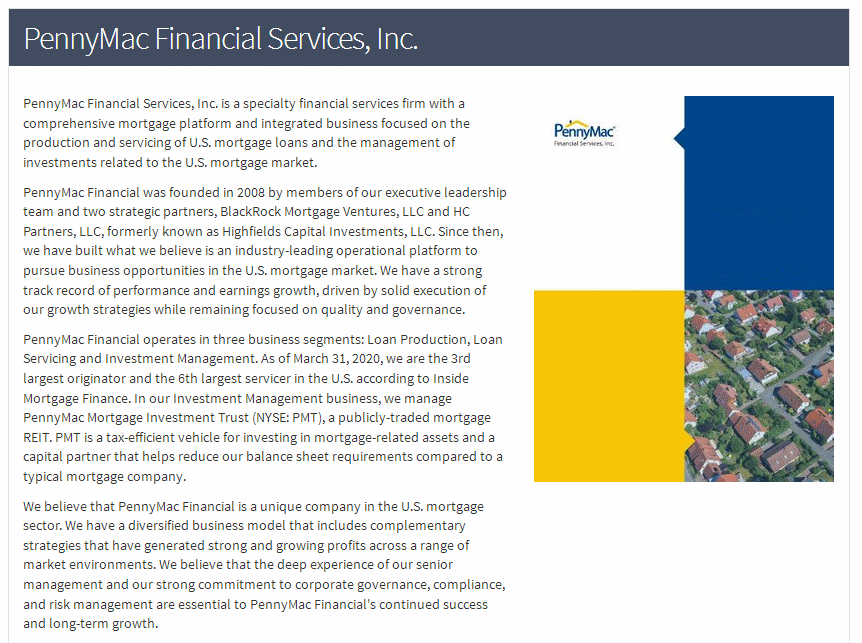
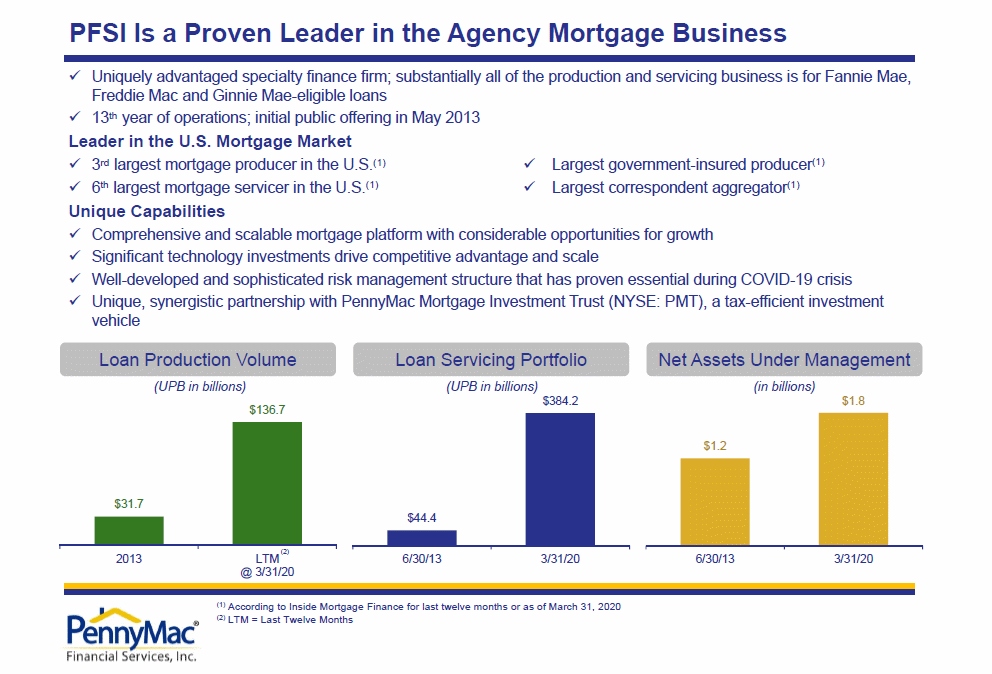
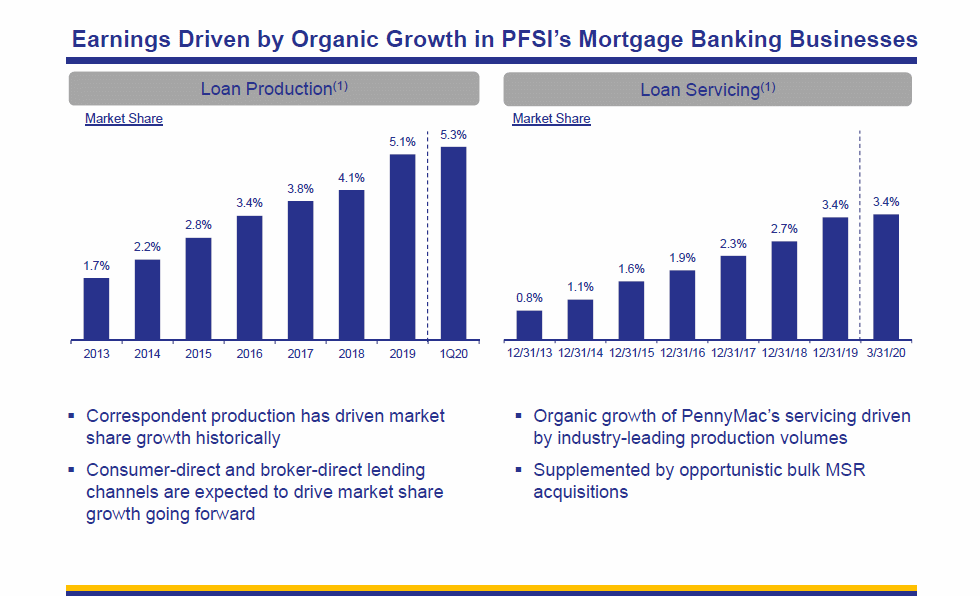
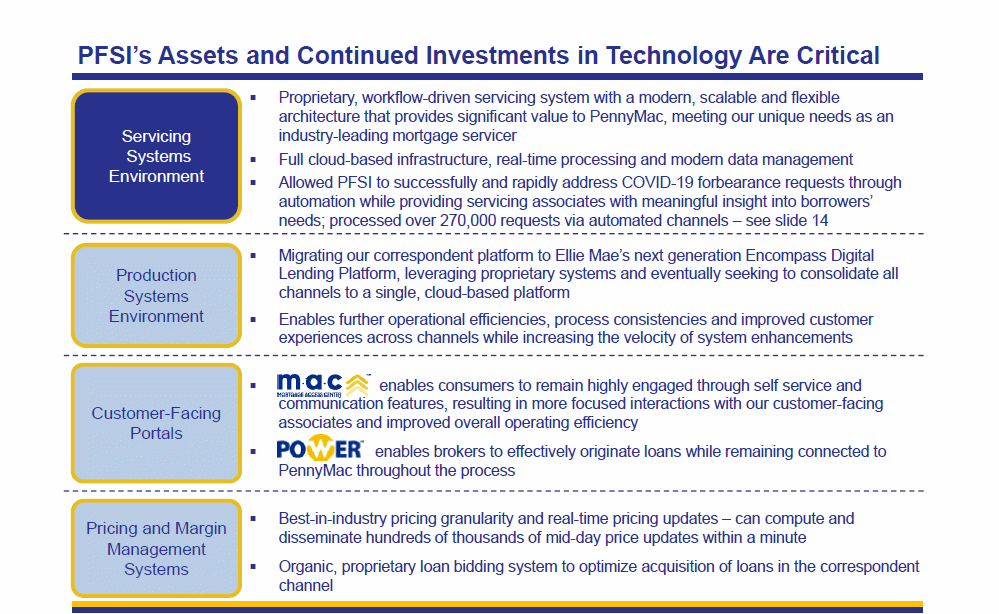
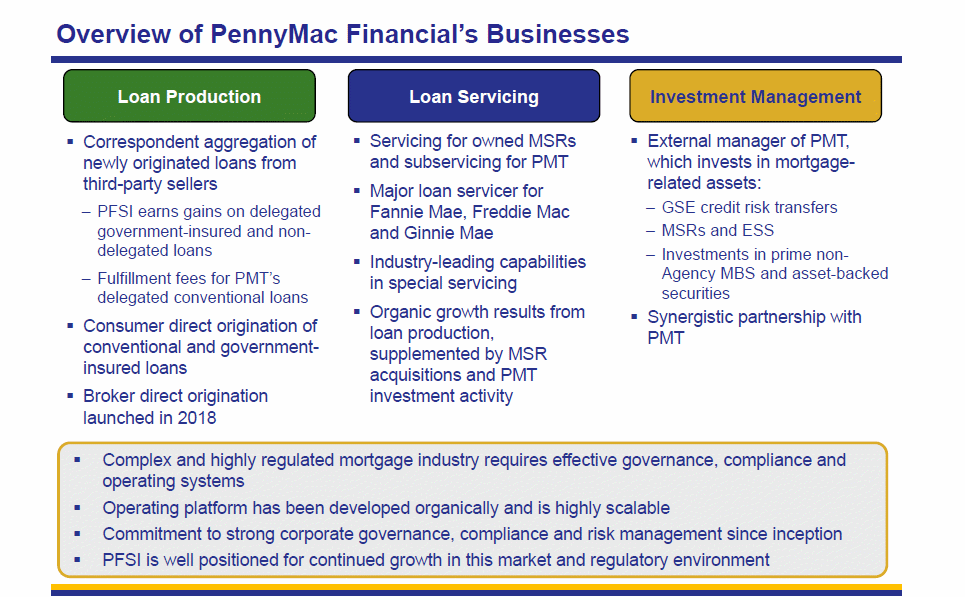
      PennyMac Financial Services, Inc. provides financial services primarily
      in the United States. The Company conducts its business in two segments:
      mortgage banking and investment management. Mortgage banking segment
      offers correspondent and retail lending businesses and loan servicing
      business. Investment management segment offers investment advisory and
      investment management services. PennyMac Financial Services, Inc. is
      headquartered in Moorpark, California.

   Recent Price:  41.13     52-Week High:  43.14     52-Week Low:  13.14

   20-Day Avg. Daily Volume =  1,024,133                    Beta:   1.18

Earnings per Share (EPS) Estimates:

                        This        Next        This        Next
                       Quarter     Quarter      Year        Year
                      06/2020     09/2020     12/2020     12/2021

    Average Estimate      3.08        2.82       11.83        8.37
 Number of Estimates         2           2           2           2
        Low Estimate      3.00        2.40       10.85        8.00
       High Estimate      3.08        3.03       12.39        8.09
        Year Ago EPS      0.92        1.51        4.89       11.62
          EPS Growth    230.43%      80.13%     137.63%     -30.77%

P/E Ratio Related Data:                                    EPS       Sales
  Current FY Estimate:   5.12                              Growth    Growth
   Trailing 12 Months:   3.54       vs. Previous Quarter:   98.40%    47.20%
     P/E Growth Ratio:   0.00          vs. Previous Year:  543.10%   191.41%

Price/Sales Ratio:  1.67    Price/Book Ratio:  1.38    Price/Cash Flow:  3.24

Other Fundamental Data:
                         06/30/20     03/31/20      12/31/19
Return on Investment         0.00        32.19         21.09
Return on Assets             0.00         6.73          4.40
Current Ratio                0.00         0.54          0.16
Quick Ratio                  0.54         0.54          0.16
Operating Margin             0.00        33.47         26.60
Net Margin                   0.00        33.47         26.60
Pre-Tax Margin               0.00         0.00          0.00
Book Value                  26.26        21.37         73.18
Inventory Turnover           0.00         0.00          0.00
Debt-to-Equity Ratio         0.00         2.15          2.31
Debt-to-Capital Ratio        0.00        68.30         69.78

Reported and Estimated Quarterly Earnings:
Reported                                03/2020   12/2019   09/2019   06/2019
                                           3.73      1.88      1.51      0.92
Estimated                              06/2020   09/2020   12/2020   12/2021
  Consensus 7 Days Ago                     3.08      2.82     11.80     38.30
  Upward Revisions                            0         0         0         0
  Downward Revisions                          1         1         1         1
  Consensus 30 Days Ago                    3.08      2.82     11.80     38.30
  Upward Revisions                            0         0         0         0
  Downward Revisions                          1         1         1         1

Annual Income Statements ($mil except EPS data):

                                   12/31/19 12/31/18 12/31/17 12/31/16 12/31/15

Sales                               1477.00   985.00   955.00   932.00   713.00
Cost of Goods                        282.00   165.00   138.00   108.00    85.00
Gross Profit                        1195.00   820.00   817.00   824.00   628.00
Selling, Deprec, Amort Expense       604.00   499.00   438.00   396.00   315.00
Income After Deprec + Amortization   591.00   321.00   380.00   428.00   313.00
Non-Operating Income                 -62.00   -53.00   -44.00   -45.00   -34.00
Interest Expense                       0.00     0.00     0.00     0.00     0.00
Pretax Income                        529.00   268.00   336.00   383.00   279.00
Income Taxes                         136.00    23.00    24.00    46.00    32.00
Minority Interest                      0.00   157.00   211.00   271.00   200.00
Investment Gains/Losses                0.00     0.00     0.00     0.00     0.00
Other Income/Charges                   0.00     0.00     0.00     0.00     0.00
Income from Continuing Operations    393.00   244.00   312.00   337.00   248.00
Extras + Discontined Operations        0.00     0.00     0.00     0.00     0.00
Net Income                             0.00    88.00   101.00    66.00    47.00
Income before Depr. + Amortization  1196.00   551.00   668.00   745.00   476.00
Depreciation + Amort. (Cash Flow)      0.00     0.00     0.00     0.00     0.00
Average Shares                        81.08    35.32    25.00    76.63    76.10
Diluted EPS bf Non-Recurring Items     4.89     2.59     2.20     2.94     2.17
Diluted Net EPS                        4.89     2.59     4.03     2.94     2.17


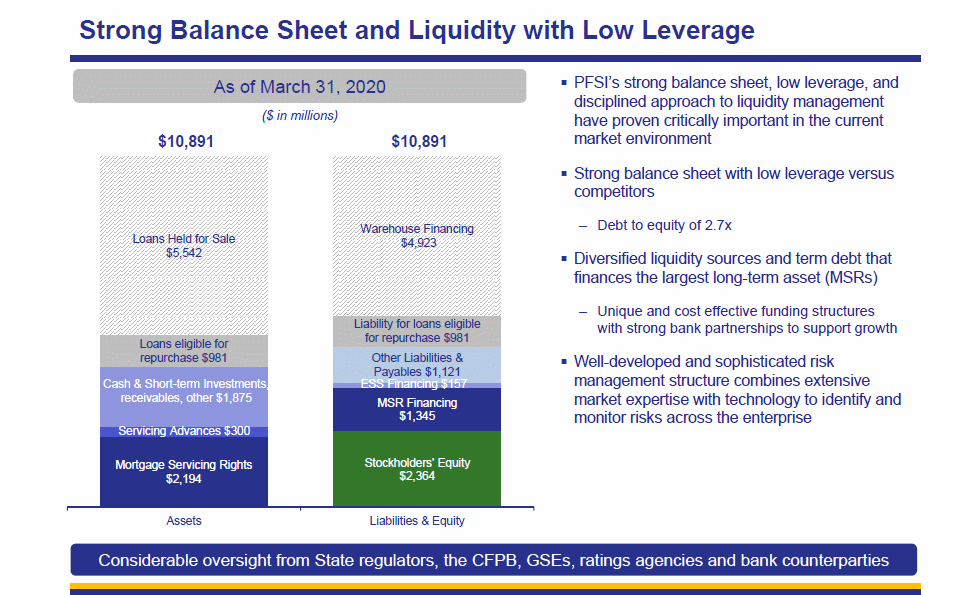
Balance Sheets ($mil. except per share data):

                                   12/31/19 12/31/18 12/31/17 12/31/16 12/31/15
Assets:

Cash + Equivalents                     0.00   263.00   273.00   208.00   185.00
Receivables                            0.00     0.00     0.00     0.00     0.00
Notes Receivable                       0.00     0.00     0.00     0.00     0.00
Inventories                            0.00     0.00     0.00     0.00     0.00
Other Current Assets                   0.00     0.00     0.00     0.00     0.00
Total Current Assets                 263.00   273.00   208.00   185.00   152.00
Property, Plant & Equipment           94.00    73.00    55.00    43.00    19.00
Investments + Advances                 2.00     1.00    10.00    72.00    71.00
Other Non-Current Assets             156.00   164.00   172.00   168.00   170.00
Deferred Charges                       0.00     0.00     0.00     0.00    18.00
Intangibles                         2927.00  2821.00  2120.00  1628.00  1412.00
Deposits + Other Assets             6763.00  4146.00  4804.00  3039.00  1663.00
Total Assets                           0.00    10.00     7.00     7.00     5.00

                                   12/31/19 12/31/18 12/31/17 12/31/16 12/31/15
Liabilities:

Notes Payable                       1294.00  1292.00   892.00   151.00    61.00
Accounts Payable                     175.00   156.00   107.00   135.00    90.00
Current Portion Long-Term Debt         0.00     0.00     0.00     0.00     0.00
Current Portion Capital Leases        21.00     7.00    21.00    23.00    14.00
Accrued Expenses                       0.00     0.00     0.00     0.00     0.00
Income Taxes Payable                   0.00     0.00     0.00     0.00     0.00
Other Current Liabilities            119.00   151.00   183.00   266.00   267.00
Total Current Liabilities           1610.00  1606.00  1203.00   575.00   432.00
Mortgages                           4668.00  2475.00  2923.00  2422.00  1403.00
Deferred Income Taxes                  0.00     0.00     0.00     0.00     0.00
Convertible Debt                       0.00     0.00     0.00     0.00     0.00
Long-Term Debt                        91.00     0.00     0.00     0.00     0.00
Non-Current Capital Leases             0.00     0.00     0.00     0.00     0.00
Other Non-Current Liabilities       1773.00  1744.00  1523.00   737.00   608.00
Minority Interest                      0.00     0.00     0.00     0.00     0.00
Total Liabilities                      0.00     8.00     5.00     5.00     3.00

                                   12/31/19 12/31/18 12/31/17 12/31/16 12/31/15
Shareholder Equity:

Preferred Stock                        0.00     0.00     0.00     0.00     0.00
Common Sock                            0.00     0.00     0.00     0.00     0.00
Capital Surplus                     1335.00  1311.00   204.00   183.00   172.00
Retained Earnings                    726.00   343.00   265.00   165.00    98.00
Other Equity                           0.00     0.00  1250.00  1052.00   792.00
Treasury Stock                         0.00     0.00     0.00     0.00     0.00
Total Shareholder Equity            2062.00  1654.00  1720.00  1399.00  1062.00
Total Liabilities+ Owners' Equity  10204.00  7479.00  7368.00  5134.00  3505.00
Total Common Equity                    0.00     0.00     0.00     0.00     0.00
Shares Outstanding                    78.50    77.40    23.50    22.30    21.80
Book Value per Share                  26.26    21.37    73.18    62.75    48.73


Cash Flow Statement:

    Operations, Investments, & Financial Activities

                                   12/31/19 12/31/18 12/31/17 12/31/16 12/31/15

Net Income                             0.00   392.97   244.44   311.52   336.98
Depreciation/Amortization + Deplet   604.94   229.64   287.98   317.18   163.33
Net Change in Assets/Liab.           -87.68   -27.29  -142.82   -48.31   -57.94
Net Cash f Discontinued Operations     0.00     0.00     0.00     0.00     0.00
Other Operating Activities         -3155.35   125.59 -1340.26 -1544.37  -299.80
Net Cash f Operating Activities        0.00    -2.00   572.40  -883.59  -938.52
Property + Equipment                 -12.00   -17.76   -17.91   -30.39   -11.90
Acquisition/Disp. of Subsidiaries      0.00     0.00     0.00     0.00     0.00
Investments                           43.21    52.26   -84.12   -39.65   -24.63
Other Investing Activity             117.57  -357.11  -237.20    35.30  -526.61
Net Cash from Investing              148.78  -322.61  -339.23   -34.74  -563.14

    Use of Funds

                                   12/31/19 12/31/18 12/31/17 12/31/16 12/31/15

Issue (Repurchase) Capital Stock       4.09     0.02    -7.35     0.15     0.00
Issuance (Repayment) of Debt       63768.75   -40.91  1235.40  1095.45   623.05
Increase/Decrease Short-Term Debt    -10.92   -14.37     0.00    -7.11    13.58
Dividends + Distributions              0.00     0.00     0.00     0.00     0.00
Other Financing Acitivies         -61623.21   -66.73   -66.88  -121.32   -97.42
Net Cash from Financing             2129.00  -132.03  1161.17   967.16   539.21
Effect of Exchange Rate Changes        0.00     0.00     0.00     0.00     0.00

Net Change in Cash + Equivalents      32.65   117.75   -61.64    -6.11    29.22

    Net Change in Cash & Equivalents

                                   12/31/19 12/31/18 12/31/17 12/31/16 12/31/15

Cash at Beginning of Per.            155.92    38.17    99.37   105.47    76.26
Cash at End of Period                188.58   155.92    37.73    99.37   105.47
Net Change in Cash + Equivalents      32.65   117.75   -61.64    -6.11    29.22


Zenith Indices:                      [Indices near +3.0, or near zero,
                                     or < zero bear special attention.]
P/E Ratio Tests:
Current P/E Ratio < 28?    0.0000     P/E Ratio > 5?             0.0000
P/E Ratio Vs Growth Rate:  3.0000     Forward P/E Ratio < 28?    3.0000

Sales Tests:
Sales < $500 mil.?         0.5076     Sales incr. 25% Yearly?    3.0000
Sales > $340 million?      2.8971     Inventory/Sales < 5%?      1.0000

Balance Sheet Tests:
Debt/Equity Ratio < 0.40?  0.1860     LTD/Net Assets:            3.0000
Debt Reduction:            3.0000     Intangibles/Assets < 10%?  0.0004
Current Ratio > 2?         0.5400     Return on Equity > 9.8%?   3.0000

Earnings Tests:
EPS 5-Yr. Growth > 18%?    1.0753     Operating Margin > 5%?     0.1494
EPS Annual Growth > 0%?    3.0000     Dividend Rate cp 2.7%:     0.4333
Earnings Consistent?       1.6667     Payout Ratio Decreasing?   0.0120
Net Income Increasing 25%? 0.6970     Price<15% below 52-wk Hi?  1.0964
Positive Cash Flow?        3.0000     Price/Book X PE < 22?      3.0000
Profit Margin > 7.5%?      3.0000     Price/Book < 1.6?          1.1594
Profit Margin Increasing?  1.2583     Stock Compared to S+P 500: 3.0000

Price & Float Tests:
Return on Investment>12%?  1.8935     Shares Out > 50 mil.?      1.5846
Return on Assets > 10%?    0.3667     Beta > 1.25?:              1.1800
Price/Sales Ratio < 2.3?   2.1090     Liquidity > 2%?            3.0000

Ownership Tests:
Analyst Following > 2.0?   2.5000     Market Capital'n > 300M?   3.0000
Owner's Equity Increasing? 1.5574     Shares Out Decreasing?     0.2817

PFSI                                   Overall Zenith Index:     1.9458
Financial Statements |
PENNYMAC FINANCIAL SERVICES INC CLASS A (PFSI)
INCOME STATEMENT
Fiscal year ends in December. USD in thousand 2015-12 2016-12 2017-12 2018-12 2019-12 TTM
Revenue 713,110 931,887 955,463 984,629 1,477,404 1,951,524
Cost of revenue 85,481 108,385 138,125 164,502 282,035 325,415
Gross profit 627,629 823,502 817,338 820,127 1,195,369 1,626,109
Operating expenses
Sales, General and administrative 314,899 395,553 460,312 526,347 633,179 706,941
Total operating expenses 314,899 395,553 460,312 526,347 633,179 706,941
Operating income 312,730 427,949 357,026 293,780 562,190 919,168
Other income (expense) -33,537 -44,866 -21,117 -26,083 -32,746 -35,285
Income before taxes 279,193 383,083 335,909 267,697 529,444 883,883
Provision for income taxes 31,635 46,103 24,387 23,254 136,479 230,810Net income from continuing operations 247,558 336,980 311,522 244,443 392,965 653,073
Other -200,330 -270,901 -210,765 -156,749 0 0
Net income 47,228 66,079 100,757 87,694 392,965 653,073
Net income available to common shareholders 47,228 66,079 100,757 87,694 392,965 653,073
Earnings per share
Basic 2.17 2.98 4.34 2.62 5.02 8.32
Diluted 2.17 2.94 4.03 2.59 4.89 8.04
Weighted average shares outstanding
Basic 21,755 22,161 23,199 33,524 78,206 78,465
Diluted 76,104 76,629 24,999 35,322 80,340 81,020
_________________________________________________________________________________________________________________________________
PENNYMAC FINANCIAL SERVICES INC CLASS A (PFSI)
BALANCE SHEET
Fiscal year ends in December. USD in thousand 2015-12 2016-12 2017-12 2018-12 2019-12
Assets
Current assets
Cash
Short-term investments 46,319 85,964 170,080 117,824 74,611
Total cash 151,791 185,331 207,805 273,113 262,902
Receivables 20,281 17,635 27,536 33,464 48,159
Prepaid expenses 299,354 348,306 318,066 313,197 331,169
Other current assets 1,321,130 2,393,721 3,107,655 2,521,647 4,912,953
Total current assets 1,792,556 2,944,993 3,661,062 3,141,421 5,555,183
Non-current assets
Property, plant and equipment
Gross property, plant and equipment 26,862 48,713 54,186 55,251 130,102
Accumulated Depreciation -10,551 -17,392 -24,733 -21,877 -26,532
Net property, plant and equipment 16,311 31,321 29,453 33,374 103,570
Equity and other investments 1,145 1,228 1,205 1,397 1,672
Intangible assets 1,414,960 1,638,877 2,145,317 2,860,360 2,989,920
Deferred income taxes 18,378 0 0 0 0
Other long-term assets 261,944 517,483 1,531,056 1,442,021 1,553,672
Total non-current assets 1,712,738 2,188,909 3,707,031 4,337,152 4,648,834
Total assets 3,505,294 5,133,902 7,368,093 7,478,573 10,204,017
Liabilities and stockholders' equity
Liabilities
Current liabilities
Accounts payable 89,915 134,611 106,716 156,212 175,273
Taxes payable 0 25,088 52,160 400,546 504,569
Other current liabilities 679,548 555,052 419,970 367,278 298,024
Total current liabilities 769,463 714,751 578,846 924,036 977,866
Non-current liabilities
Long-term debt 1,462,739 2,557,482 3,800,438 3,758,401 5,933,071
Capital leases 13,579 23,424 20,971 6,605 112,130
Minority interest 791,524 1,052,033 1,250,263 0 0
Other long-term liabilities 197,163 438,889 1,248,164 1,135,740 1,119,443
Total non-current liabilities 2,465,005 4,071,828 6,319,836 4,900,746 7,164,644
Total liabilities 3,234,468 4,786,579 6,898,682 5,824,782 8,142,510
Stockholders' equity
Common stock 2 2 2 8 8
Additional paid-in capital 172,354 182,772 204,103 1,310,648 1,335,107
Retained earnings 98,470 164,549 265,306 343,135 726,392
Total stockholders' equity 270,826 347,323 469,411 1,653,791 2,061,507
Total liabilities and stockholders' equity 3,505,294 5,133,902 7,368,093 7,478,573 10,204,017
_________________________________________________________________________________________________________________________________
PENNYMAC FINANCIAL SERVICES INC CLASS A (PFSI)
Statement of CASH FLOW
Fiscal year ends in December. USD in thousand 2015-12 2016-12 2017-12 2018-12 2019-12 TTM
Cash Flows From Operating Activities
Net income 247,558 336,980 311,522 244,443 392,965 653,073
Depreciation & amortization 155,552 306,124 281,633 258,814 609,040 611,859
Investments losses (gains) 0 82 -94 -589 -557 424
Stock based compensation 17,521 16,198 20,697 25,251 24,771 32,608
Change in working capital -23,082 -29,645 -136,098 -27,287 -87,678 50,106
Accounts receivable 7,343 2,760 -10,802 -9,672 -20,257 -33,165
Prepaid expenses -100,506 -85,955 -15,675 -33,415 -98,121 -103,741
Accounts payable 26,307 33,041 -41,412 32,750 38,551 49,934
Income taxes payable 0 25,570 29,901 25,313 104,023 198,407
Other working capital 43,774 -5,061 -98,110 -42,263 -111,874 -61,329
Other non-cash items -344,405 -1,568,261 -1,361,245 71,764 -3,183,664 -4,189,230
Net cash provided by operating activities 53,144 -938,522 -883,585 572,396 -2,245,123 -2,841,160
Cash Flows From Investing Activities
Investments in property, plant, and equipmen -9,122 -21,852 -6,791 -13,421 -6,124 -4,992
Purchases of investments -24,632 -66,960 -120,734 -122,227 0 0
Sales/Maturities of investments 2,033 0 0 52,256 0 0
Purchases of intangibles -382,824 -146 -178,531 -227,664 -227,445 -40,068
Other investing activities -148,597 54,219 -33,175 -11,555 382,351 1,402,838
Net cash used for investing activities -563,142 -34,739 -339,231 -322,611 148,782 1,357,778
Cash Flows From Financing Activities
Debt issued 51,485,576 78,401,712 59,655,288 67,959,448 87,279,784 99,125,680
Debt repayment -50,927,524 -77,425,464 -58,464,568 -68,061,472 -85,133,936 -96,876,784
Common stock repurchased 0 0 -8,599 -5,293 -1,056 -5,177
Dividend paid 0 0 0 -10,054 -9,708 -19,441
Other financing activities -18,840 -9,090 -20,947 -14,665 -6,092 -6,776
Net cash provided by (used for) financing 539,214 967,156 1,161,174 -132,034 2,128,995 2,217,507
Net change in cash 29,216 -6,105 -61,642 117,751 32,654 734,125
Cash at beginning of period 76,256 105,472 99,367 38,173 155,924 144,913
Cash at end of period 105,472 99,367 37,725 155,924 188,578 879,038
Free Cash Flow
Operating cash flow 53,144 -938,522 -883,585 572,396 -2,245,123 -2,841,160
Capital expenditure -394,728 -30,535 -202,314 -258,529 -262,954 -81,803
Free cash flow -341,584 -969,057 -1,085,899 313,867 -2,508,077 -2,922,963
____________________________________________________________________________________________________________________________________________
Average to Current P/E Ratios |
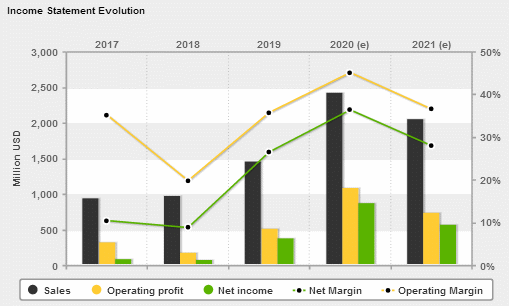
              (PFSI)     PennyMac Financial Services Inc.

                               2015    2016    2017    2018    2019

          Annual Earnings:     2.19    2.94    4.03    2.59    4.89
Average Price During Year:    17.49   14.15   17.27   21.37   25.06

                P/E Ratio:     7.99    4.81    4.28    8.25    5.12

 Average 5-Year P/E Ratio  =   6.09
             Current Price =  41.13

Previous 5 Quarter Earnings:   0.58    0.92    1.51    1.88    3.73

          Current Annualized (Last Four Quarters) Earnings =   7.12
                                                           ________
                                 Average PE / Current PE =     1.05
                                                           --------

                                      ...a number above 1.00 is good
                                                1.00 or below is bad
Financial Ratios |
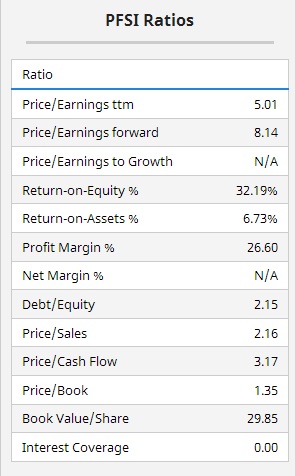
. . . . . . . . . . . . Lowest to Highest, Compared to Industry
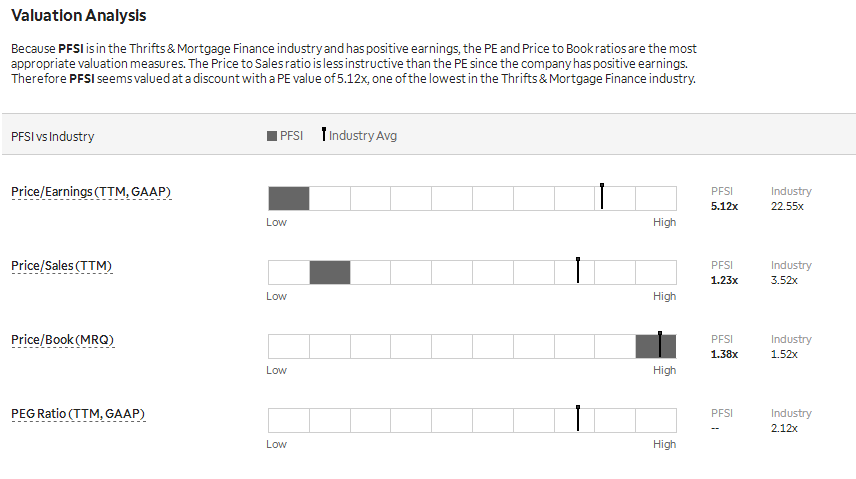
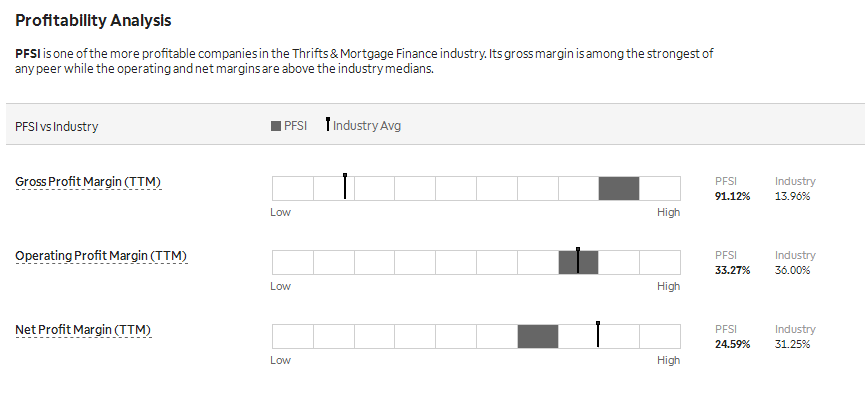
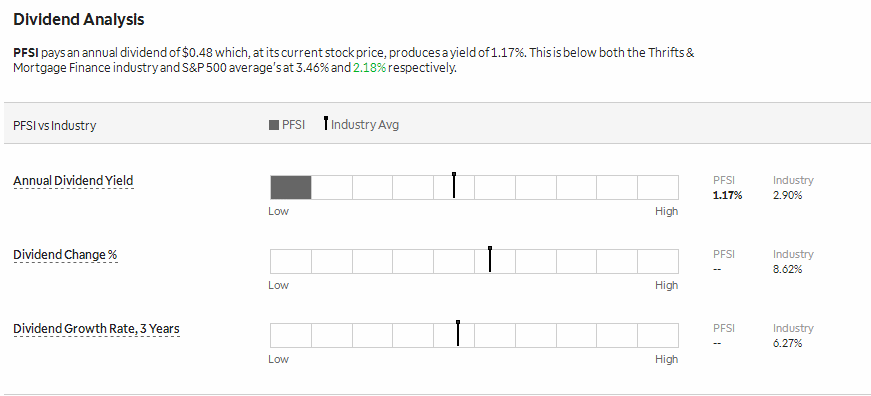
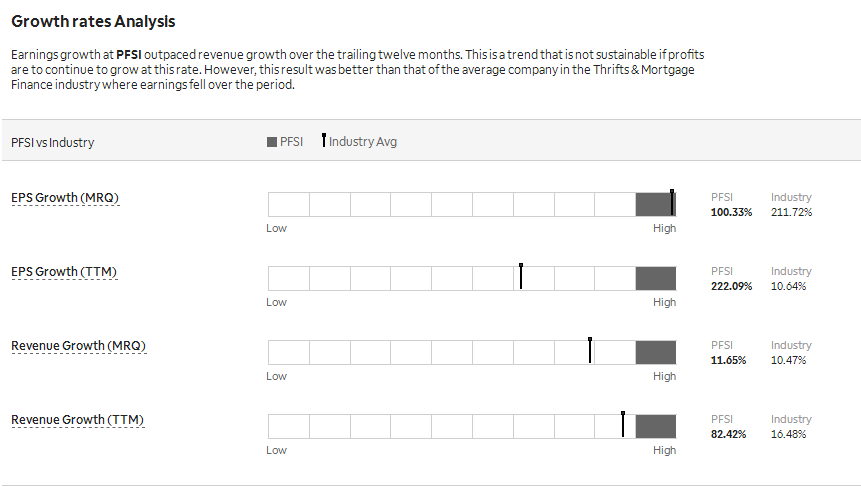
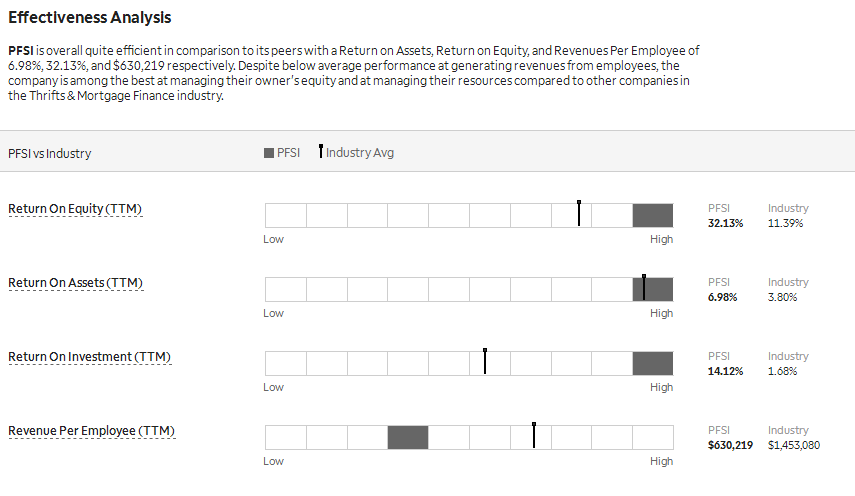
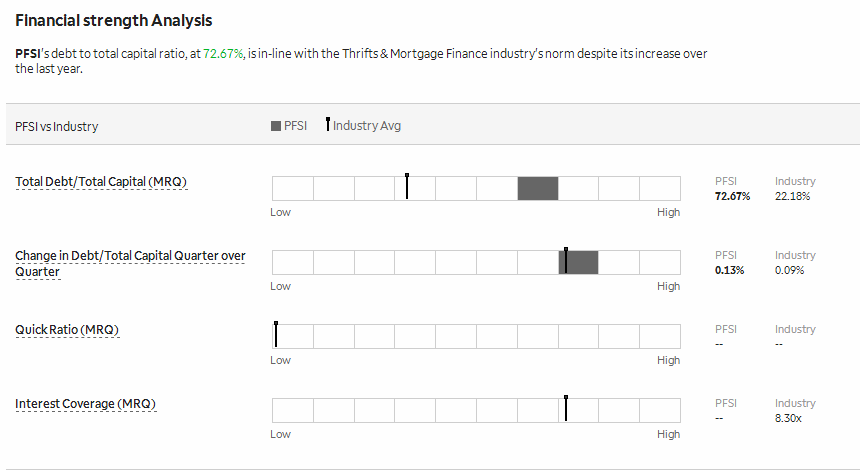
Intrinsic Value (DCF) |
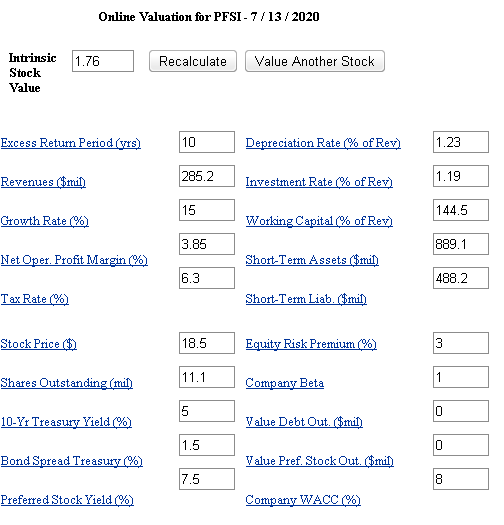
Intrinsic Value by Discounted Cash Flow Method:
Fair Value Estimator |
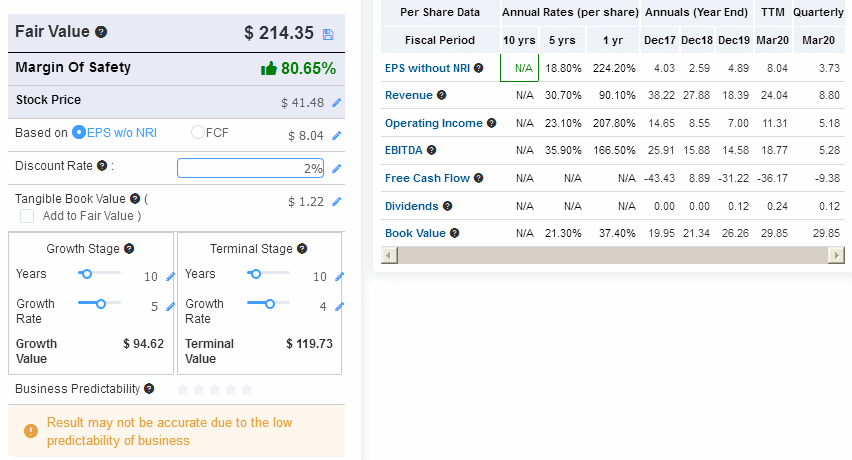
Fair Value Estimate:
Projected Earnings |

Research Reports |
Analysts' Opinions |


Insider Activity |
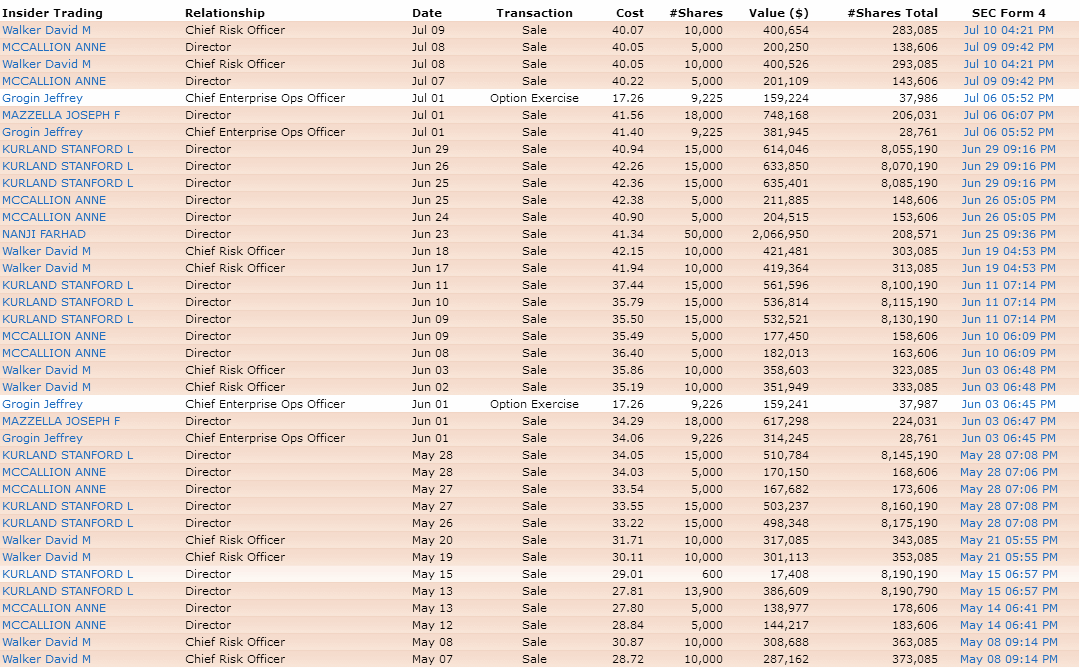
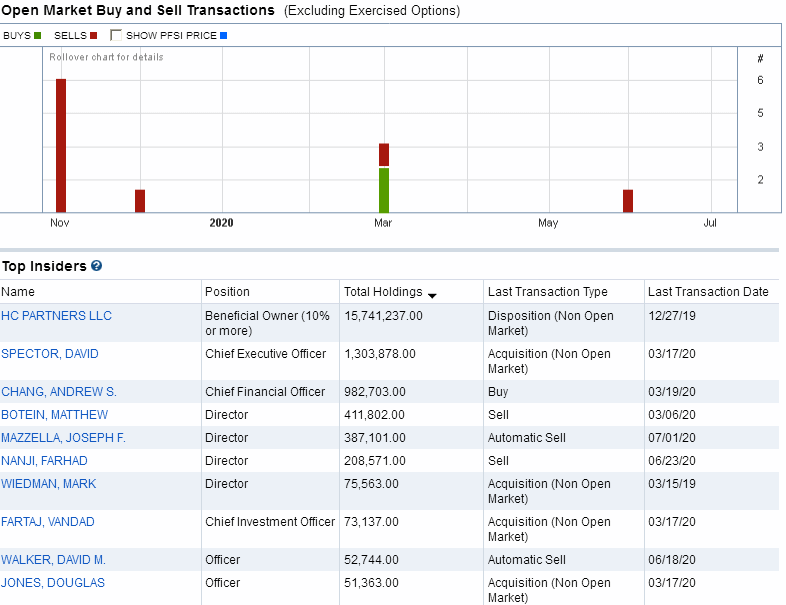
Institutional Activity |
Institutional Ownership:
Sentiment |
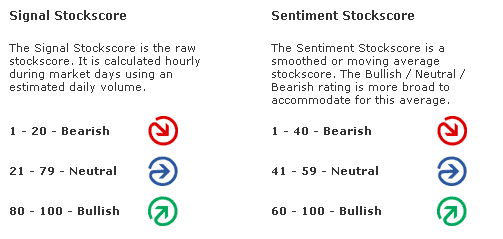
Zenith uses the "sentiment" score above or below 50 to award a positive or negative point in the Decision Matrix.


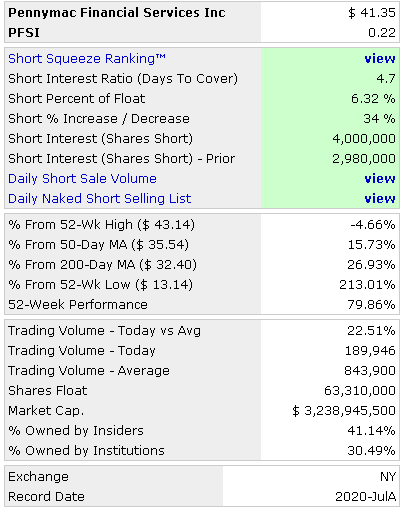
Short Interest Ratio |
As the short interest rises as a percentage of average daily share volume (Days to Cover), this is considered a measure of negative sentiment. Similarly, a decrease in that percentage is considered positive sentiment.

Standard & Poor's |
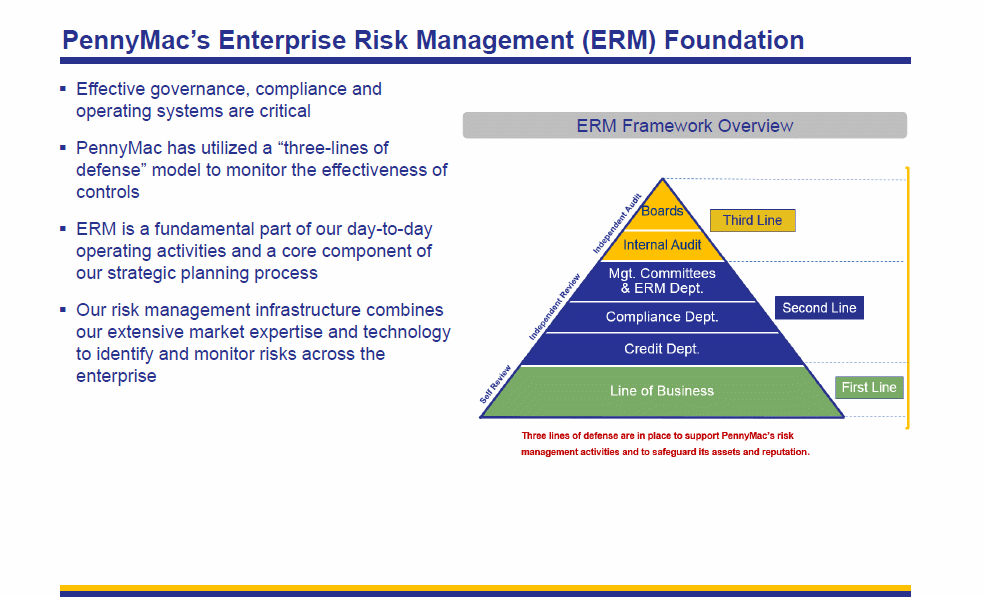
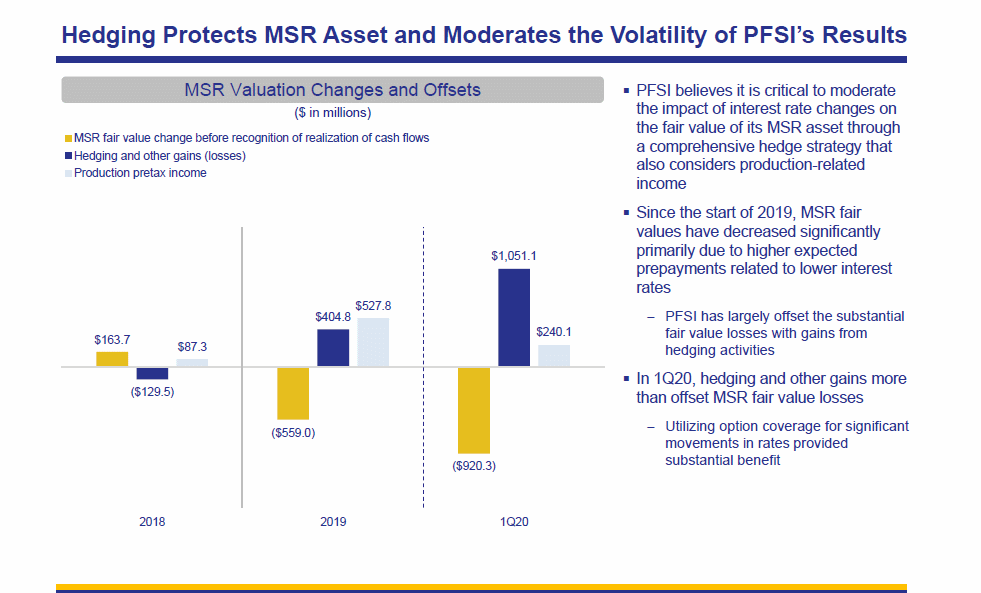
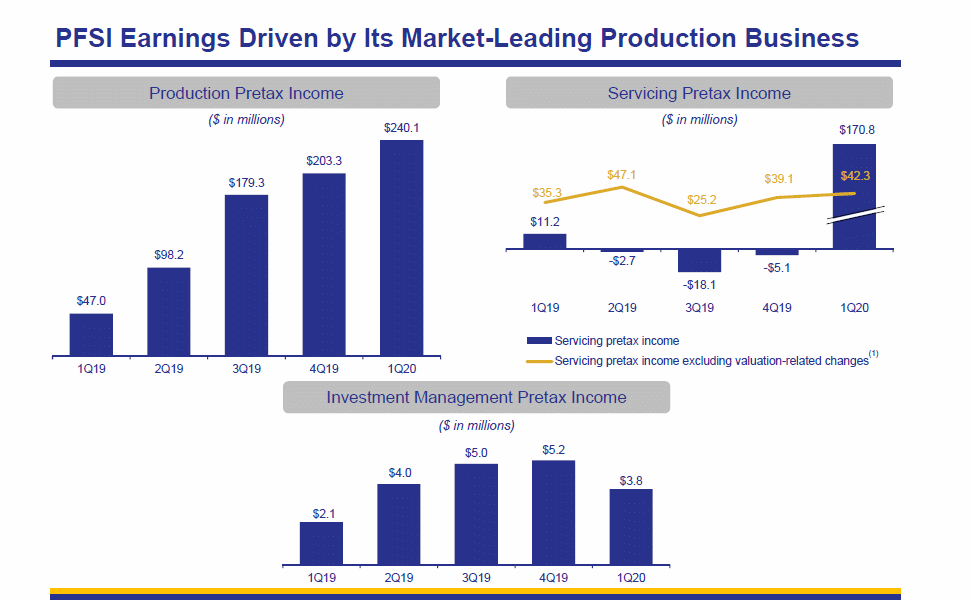
Management's Discussion of Results of Operations Excerpts |
Channeling Potential |
The summary below includes a value for `Degree,' which refers on a
scale of 1 to 10 the range of a channel in the period under consi-
deration compared to the total range of price movement. It also looks
for the last closing price to be within the channel, otherwise zeroed.
The `Index' is the `Degree' weighted for volatility.  Generally, the
the higher the index, the more suitable is the stock for trading as
a `rolling stock' between channel high and low points.

Results for PENNYMAC FINANCIAL SERVICES:
Symbol? PFSI
Total Months Available:  86
       Months in Cycle?   4

Months Covered by Periods:  12

Period 1           Period 2          Period 3
   H1      L1        H2      L2        H3      L3
  33.46   22.75     39.57   29.93     43.14   13.14

RANGE   =  43.14  TO   13.14            Close =  40.24
CHANNEL =  33.46  TO   29.93           Degree =   1
Volatility =   8.77%                    Index =   0
MACD Histogram Divergence |
The theory is that connecting the two most recent peaks or valleys of the MACD histogram will signal the direction of the next major move.
Intraday Chart |
2 Days:
Val Idea |
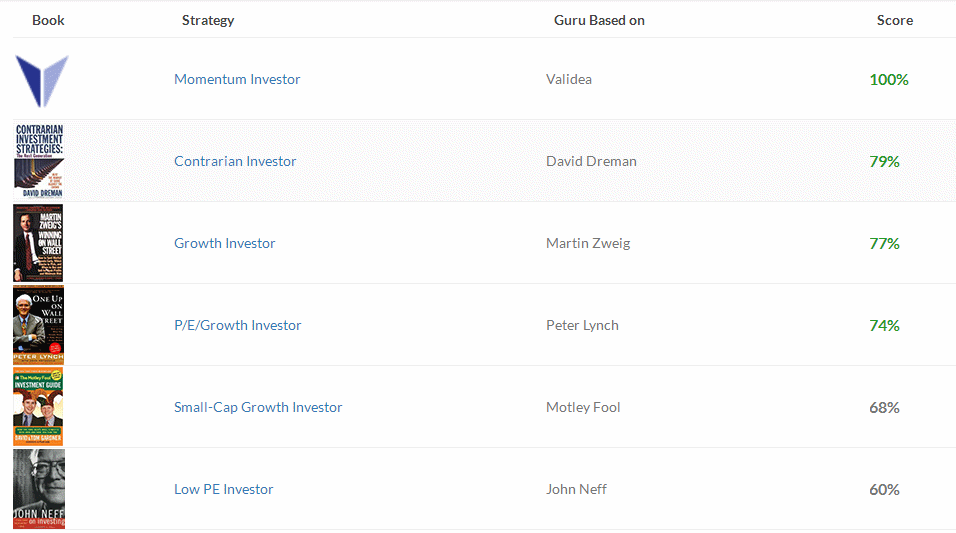
8 out of 9 favorable, (positive opinion.)

Stock Consultant |
Point & Figure Chart |
Wall Street Analyzer |
Marketspace Chart |
Time Series Forecast |
Neural Network Prediction |
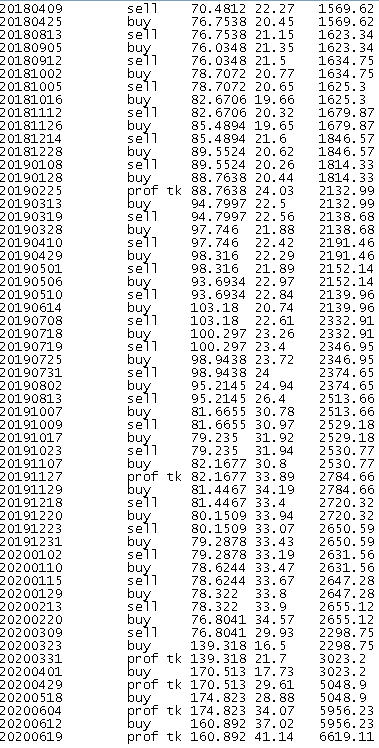
"Neurostock" can only track long trades. Therefore its performance, as tracked by itself on stocks which are consistently falling, may not appear as good as it could if each "sell" signal were a "short sale."

![]()

Ultimate Trading Systems |
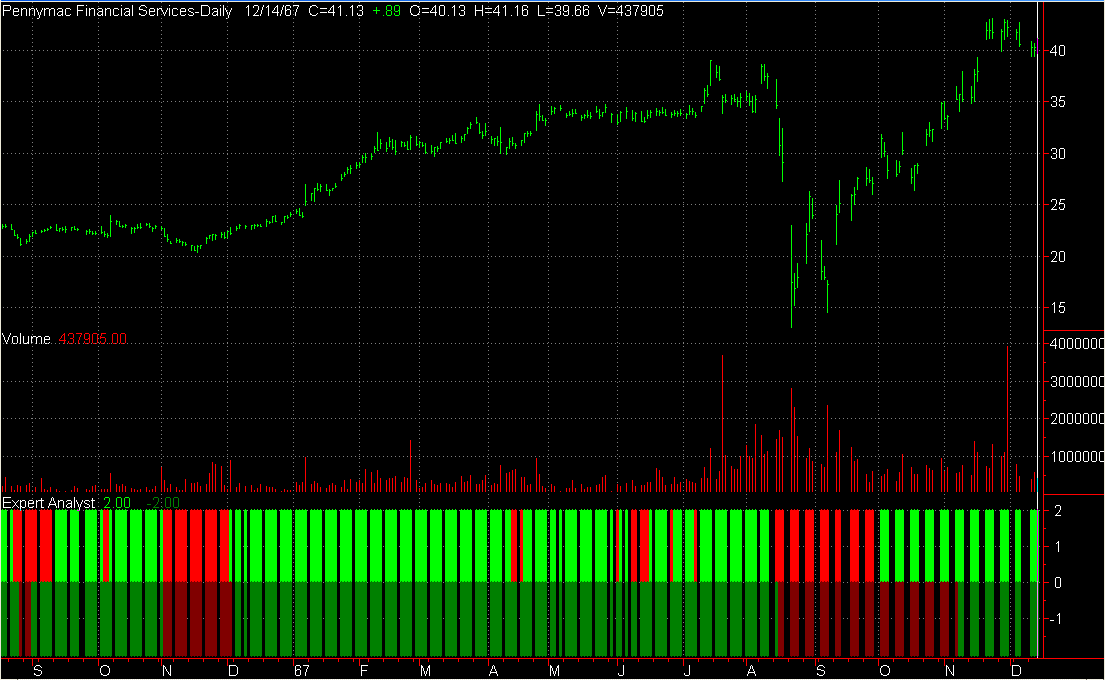
2 out of 3 of the ultimate systems favor an upmove.
System Below:
Short term outlook: Positive: Bright Green, Negative: Bright Red
Long term outlook: Postive: Dark Green, Negative: Dark Red.

Recommendation |
| Factors | Weighted Points |
|---|---|
| News | - 1 |
| Comparison | - 1 |
| Industry | - 1 |
| Bond Issue | 0 |
| Zenith Index | + 1 |
| Non-GAAP vs. GAAP Earnings | - 1 |
| Cash Flow | + 1 |
| Average to Current P/E | + 1 |
| Ratios | + 1 |
| Intrinsic Value DCF | - 1 |
| Fair Value Estimator | + 1 |
| Projected Earnings | - 1 |
| Research Reports | + 1 |
| Analysts | + 1 |
| Executive Perquisites | - 1 |
| Insider Activity | - 1 |
| Institutional Activity | + 1 |
| Management Reporting | - 1 |
| Short Interest | - 1 |
| Sentiment | + 1 |
| Standard & Poor's | + 1 |
| MACD Histogram Divergence | - 1 |
| Val Idea | + 1 |
| Stock Consultant | - 1 |
| Point & Figure | + 1 |
| Wall Street Analyzer | - 1 |
| Marketspace Chart | + 1 |
| Time Series Chart | + 1 |
| Neural Network | - 1 |
| Stock Options | + 1 |
| Ultimate Trading Systems | + 1 |
| Total | + 3 |
Place 725 shares of Pennymac Financial Services, Inc. (PFSI) on the Active List.