|
(WAIT FOR PAGE TO LOAD COMPLETELY BEFORE LINKS WORK.)
Corporate Webpages |
Lakeland Industries, Inc.
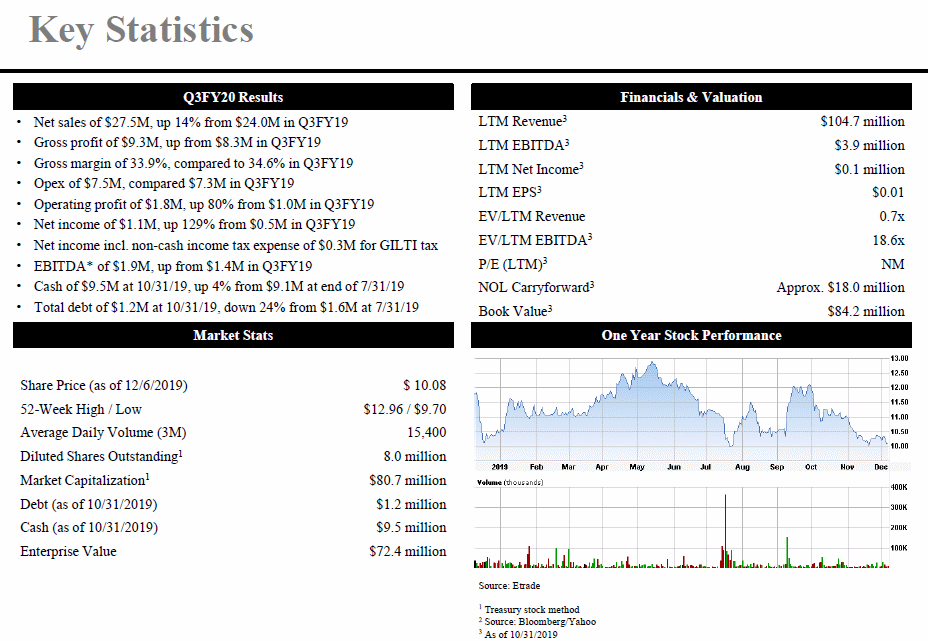
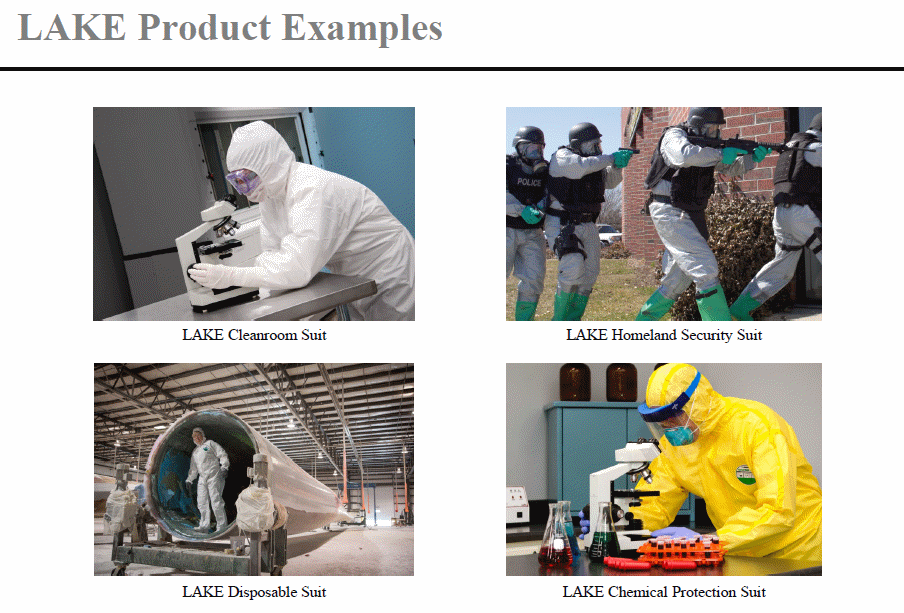
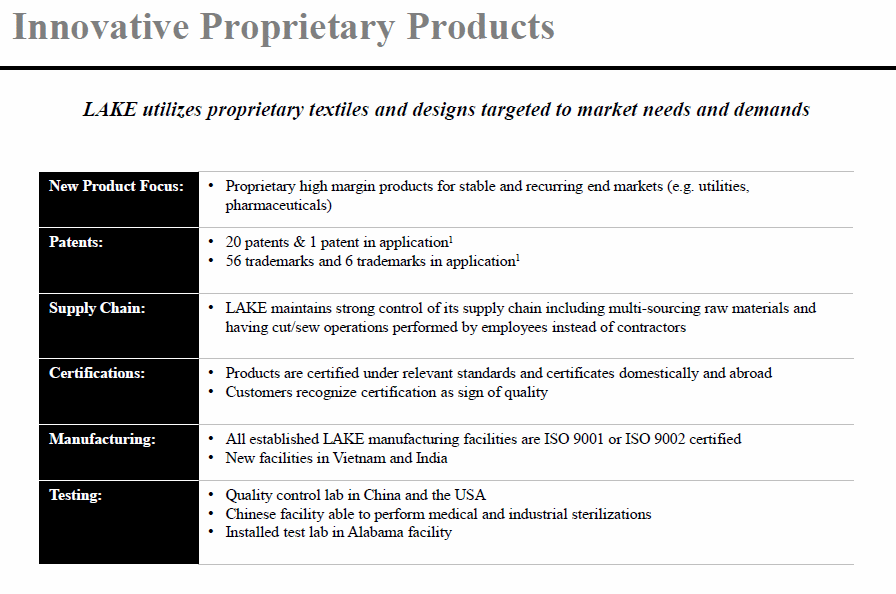
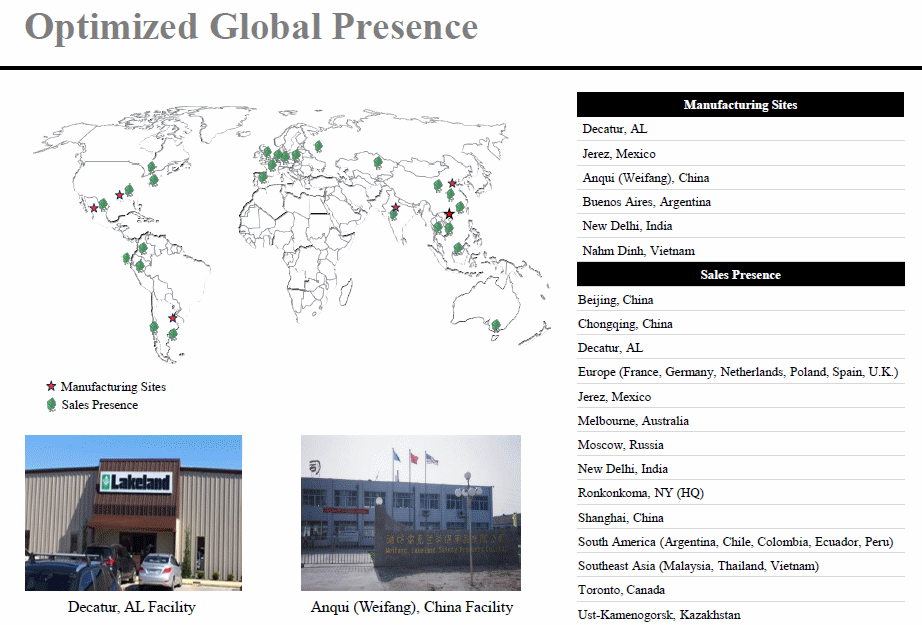
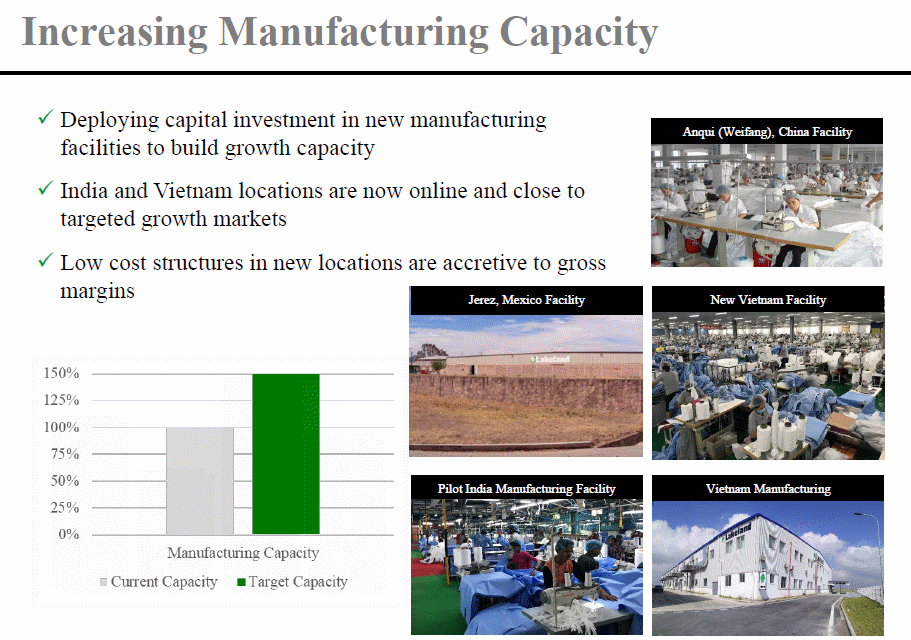
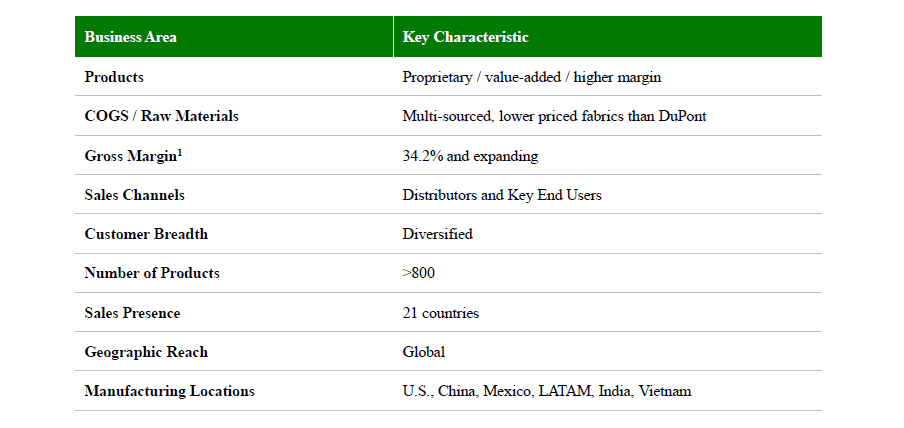
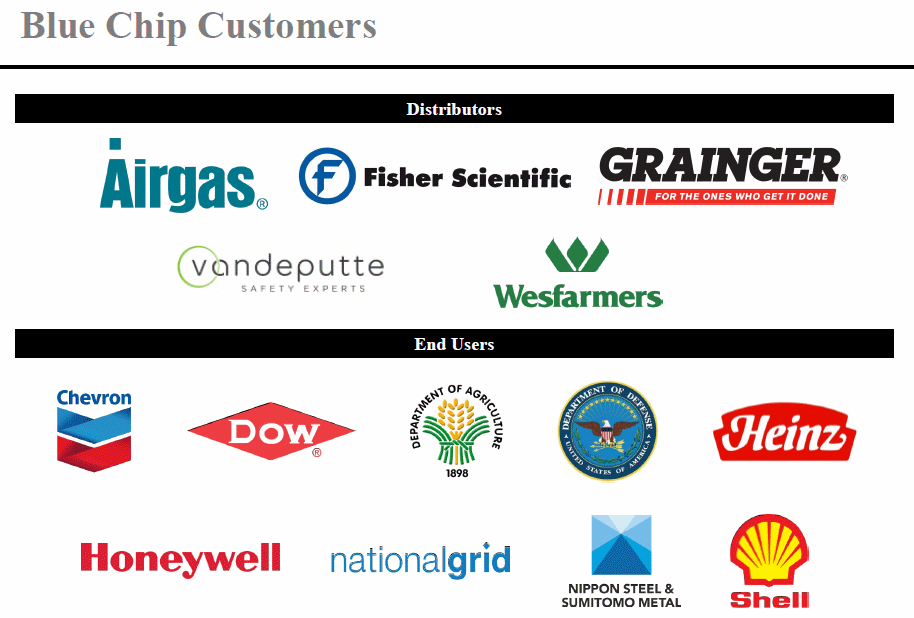
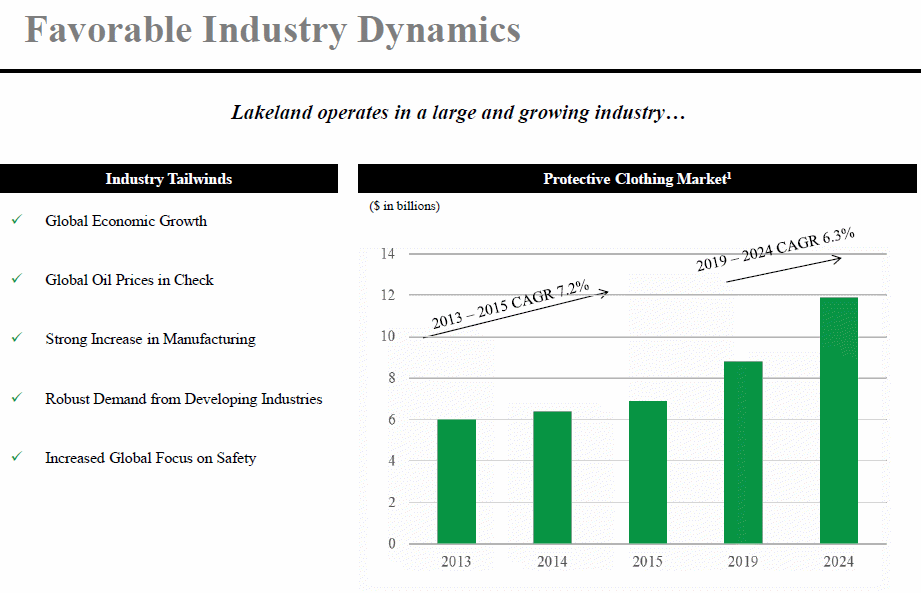
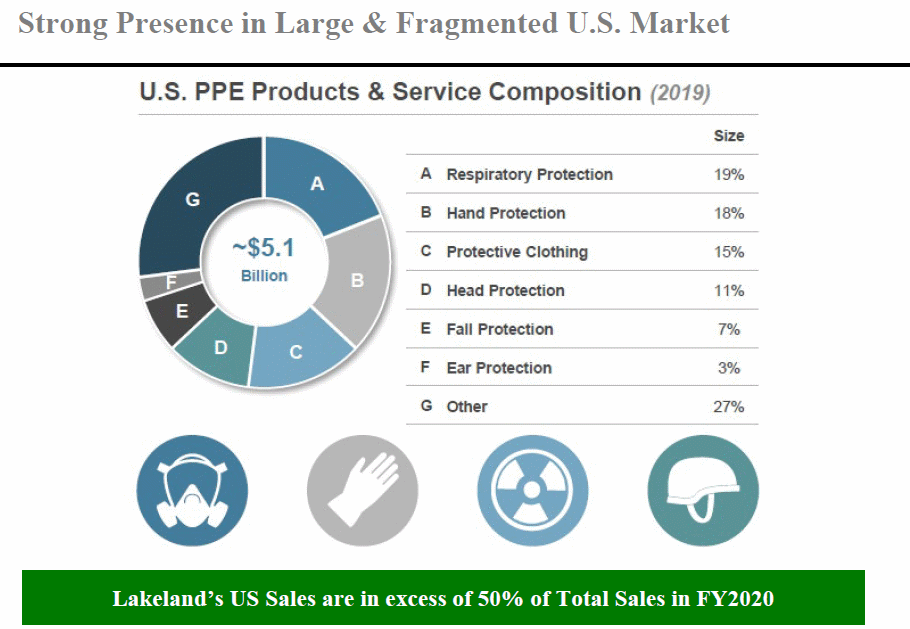
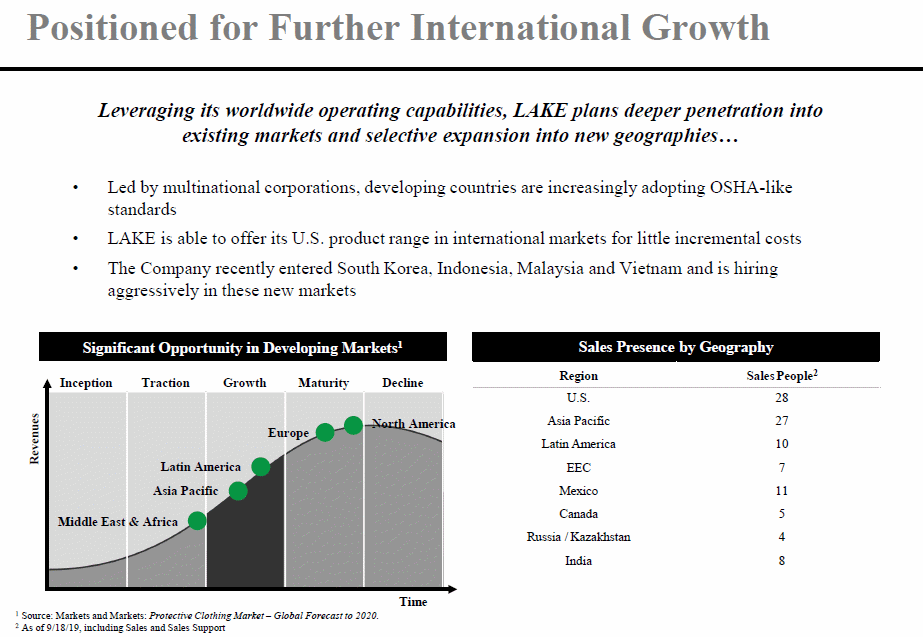
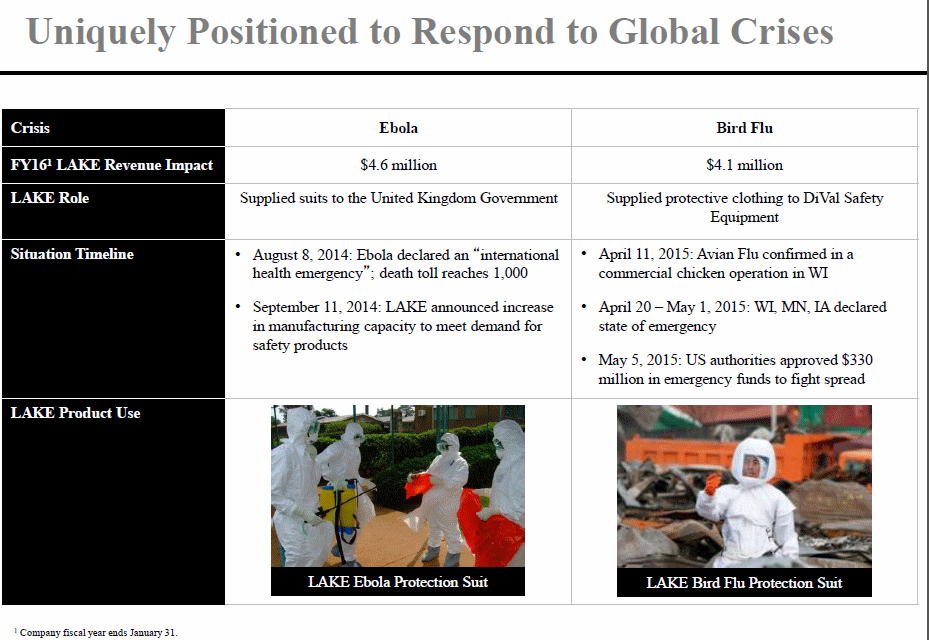
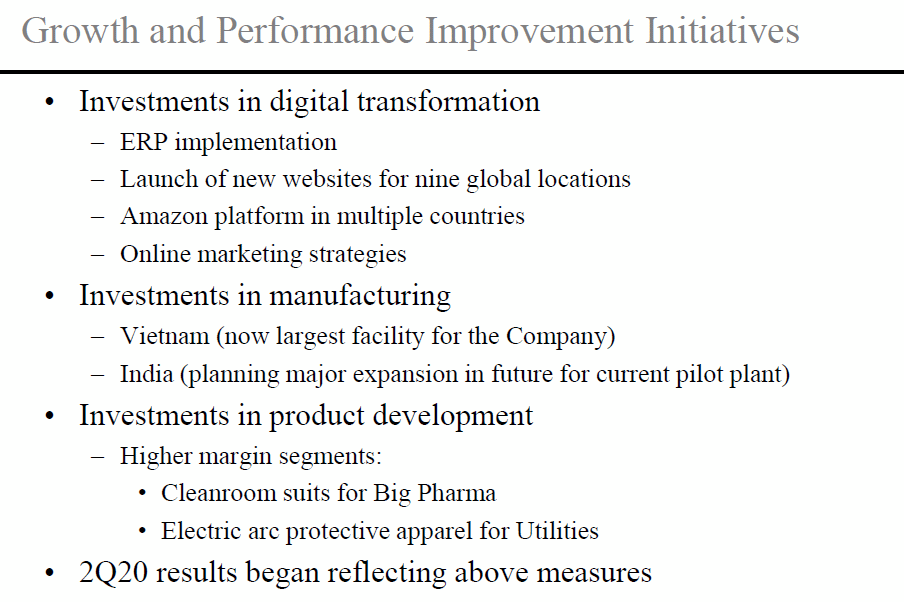
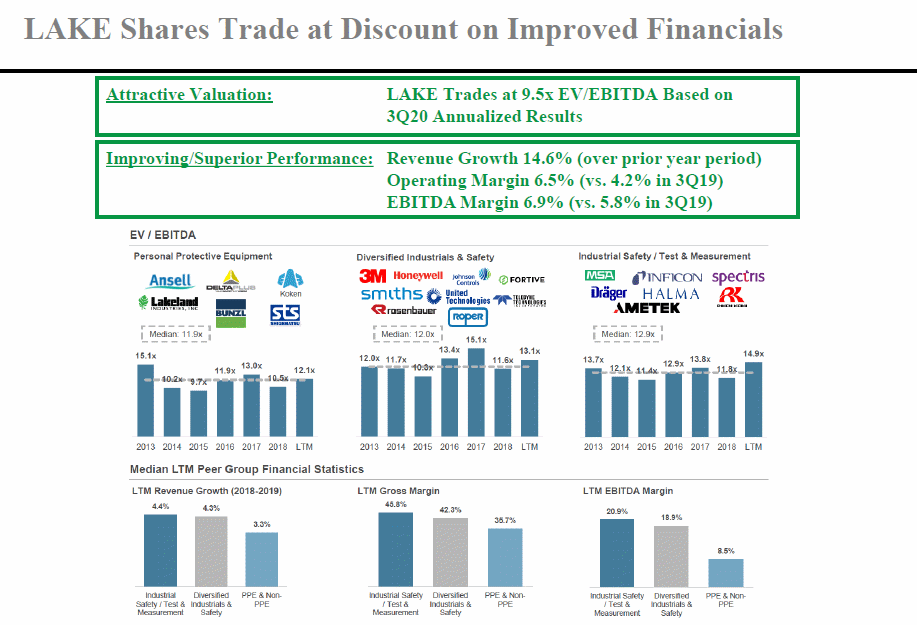
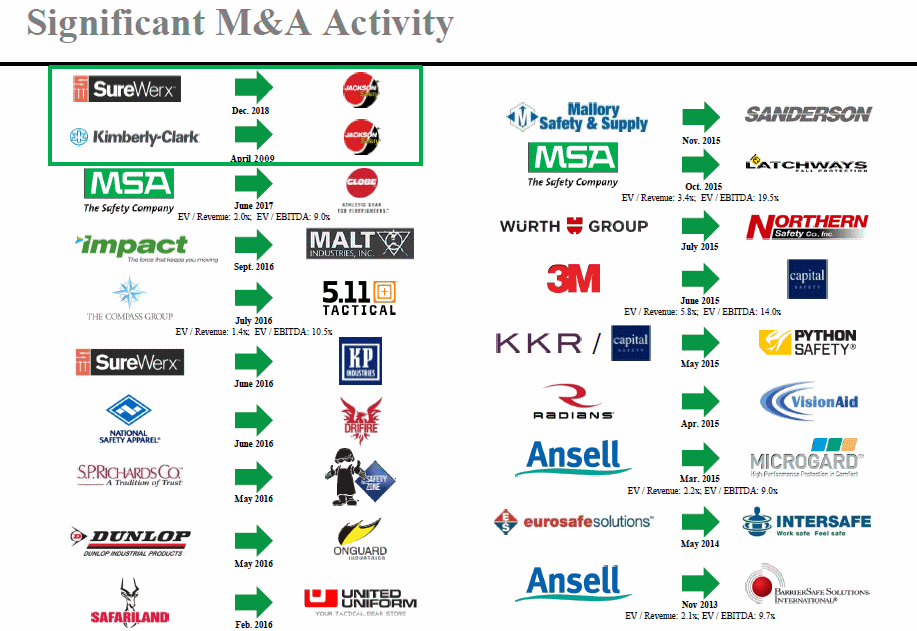
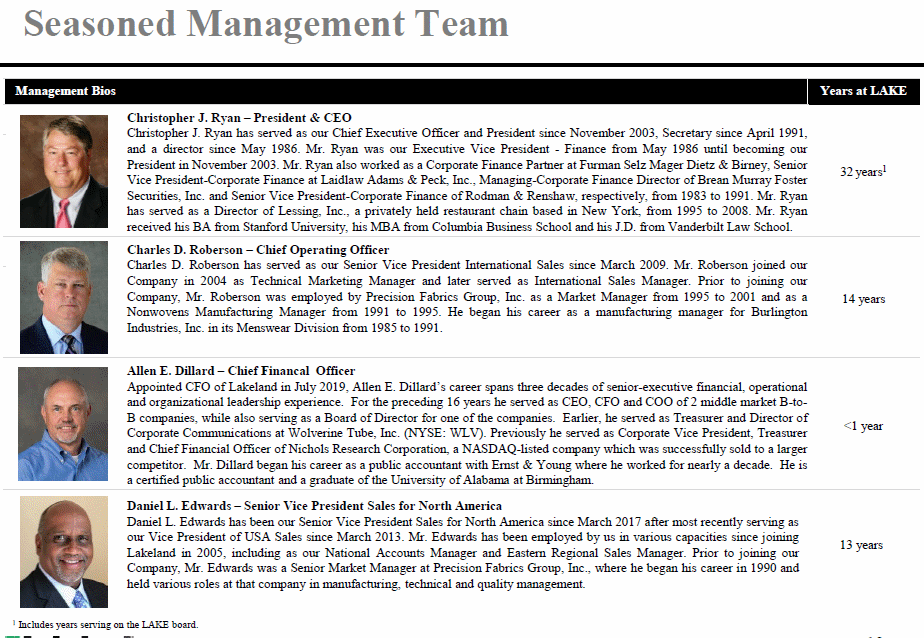
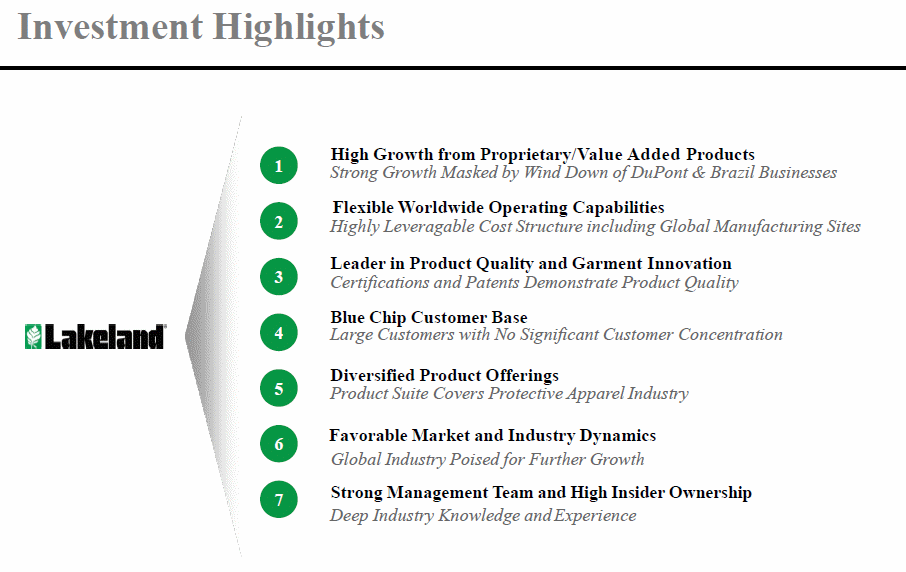
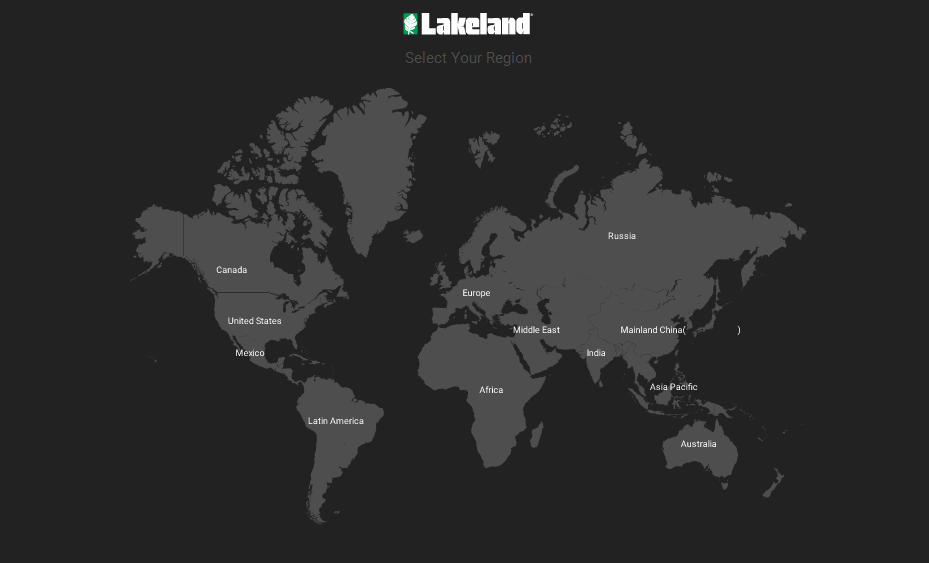
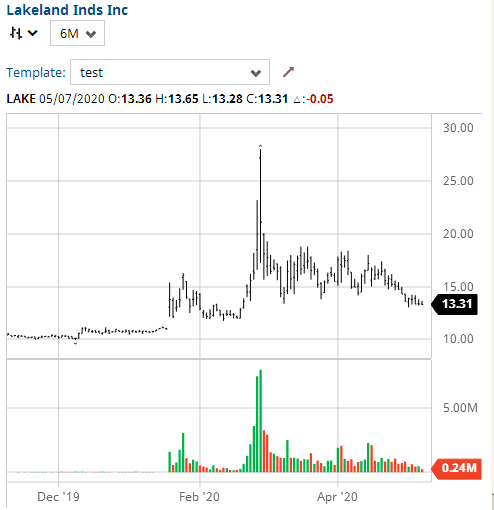
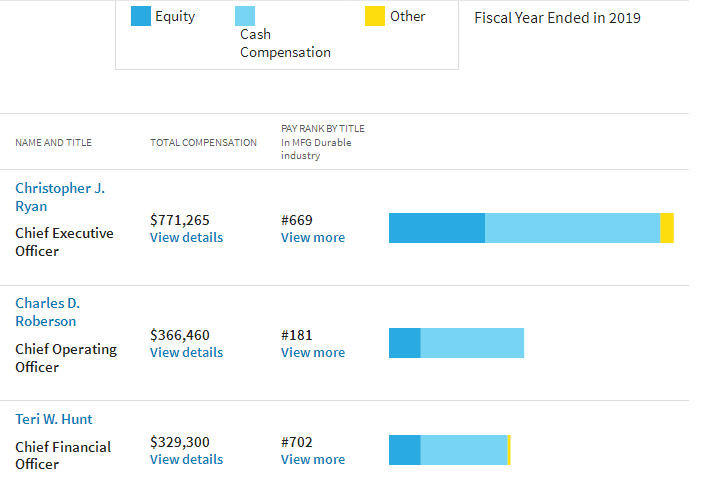
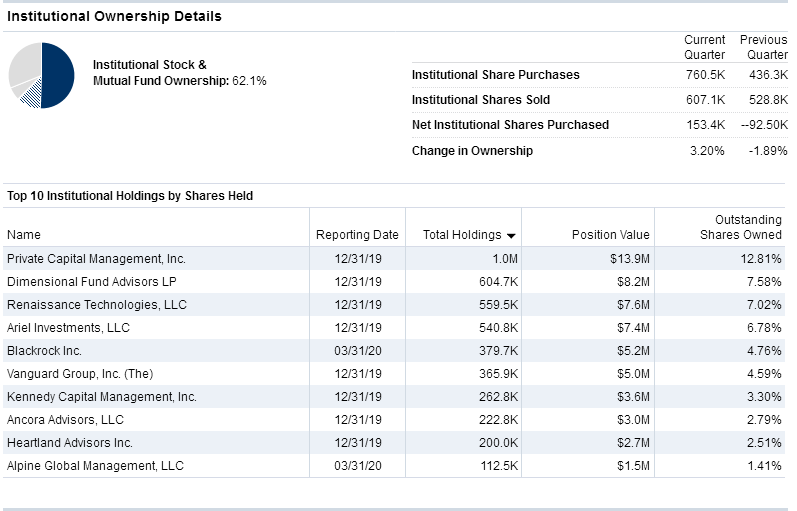
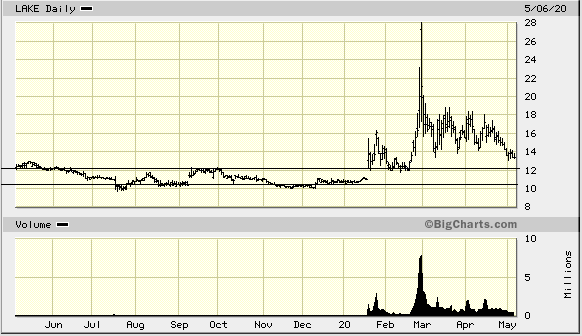
While the pandemic has been slowing down most businesses, it has been a boon to a select few. These are companies that produce safety and protective wear and equipment, or certain vaccines, or perhaps things like toilet paper and paper towels. Lakeside Industries, Inc. (LAKE) is a major producer of safety protective gear that can be used in various industrial applications including hospitals. The Government has finally ordered some companies to start producing equipment for the war on the virus utilizing the Defense Production Act, albeit belatedly. Soon after it was learned we had a pandemic, Lakeside stock nearly doubled in one month. It was similar to what happened to the stock during the Ebola crisis in mid-2014, and just as before, the stock came crashing down again shortly afterward. The need for protective gear in microbiology applications in hospitals is very great in this country and prospects look good for increasing Lakeside earnings. Lakeside is already fundamentally a strong stock in our opinion with a high Zenith Index. Unfortunately, researchers are slightly negative on the stock including Standard & Poor's, although we don't quite understand why. A single analyst gives it high marks. We think it is important to note that Dimensional Fund Advisors (DFA) is a, if not "the", major shareholder among institutions. We think that is an extremely strong sign. Management is modestly compensated. There is no glitzy annual report nor CEO Letter to Shareholders, the company relying on the present trend toward web-conference calls. The company's website is somewhat limited but does emphasize a strong international presence for a Texas-based corporation. It also hi-lites a host of prestige customers, large corporations which use its products, and also high merger and acquisition activity to try to propel the company into a high growth situation. Its average to current p/e ratio shows a rare possible stock share price increase potential to regain historical averages. The company has very little debt. The key buzz words for this company are "PPE" or "personal protective equipment" and the company is ramping up new production facilities to meet exceptional demand. News consists primarily of improving earnings reports. The stock chart appears to be settling back into a former channel range of roughly $10-$12/share. Investors may be fearful that the stock will lapse back into that range, especially after the corporation floated a significant number of additional stock shares diluting the share value. But the proceedsare being used to ramp up production, and Capex is good for growth and future earnings power. |
Corporate Wepages |


Company Profile |

Company History |
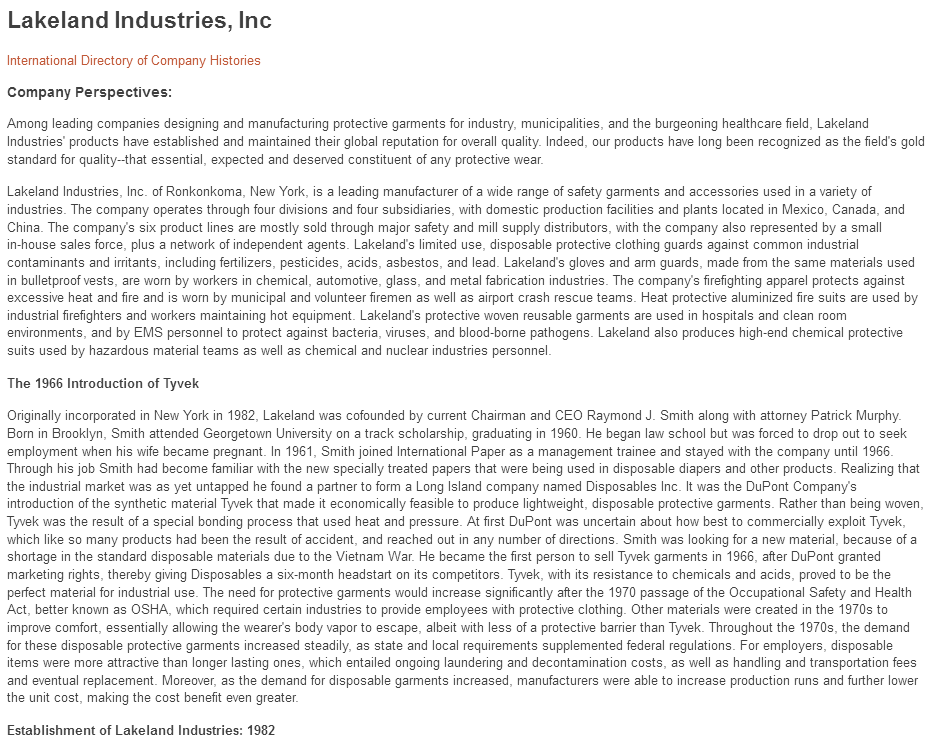
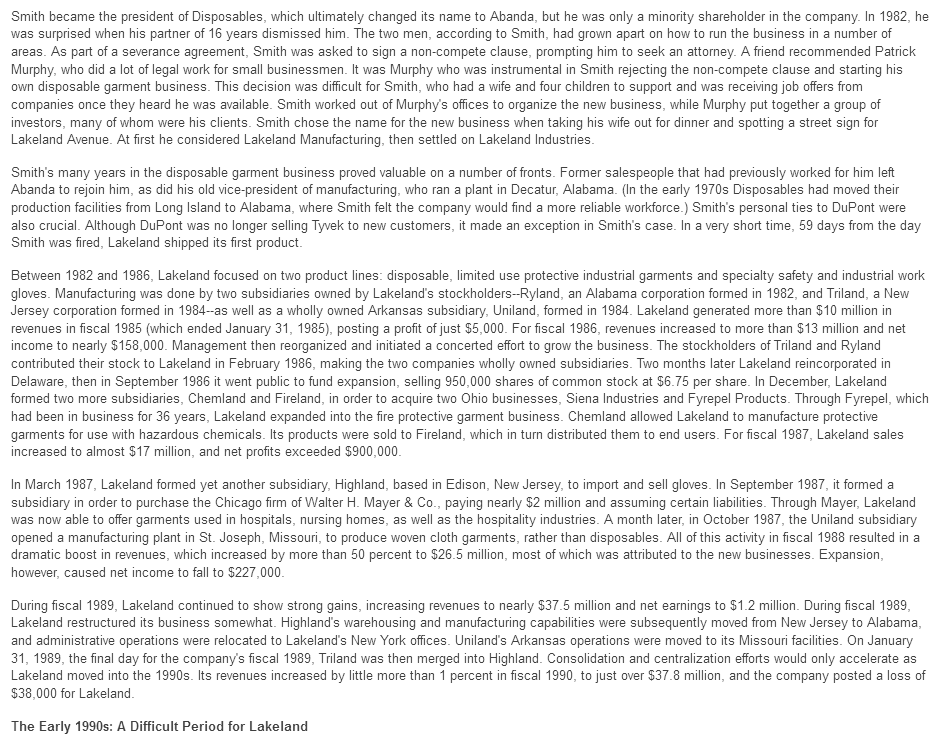
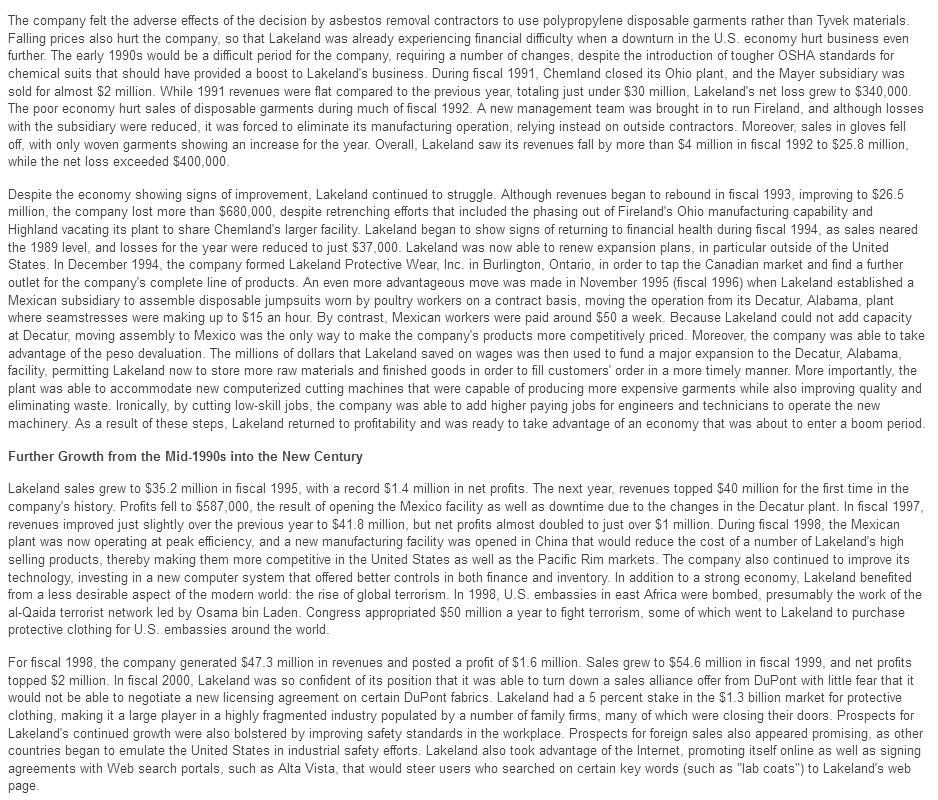


News |
Comparison |
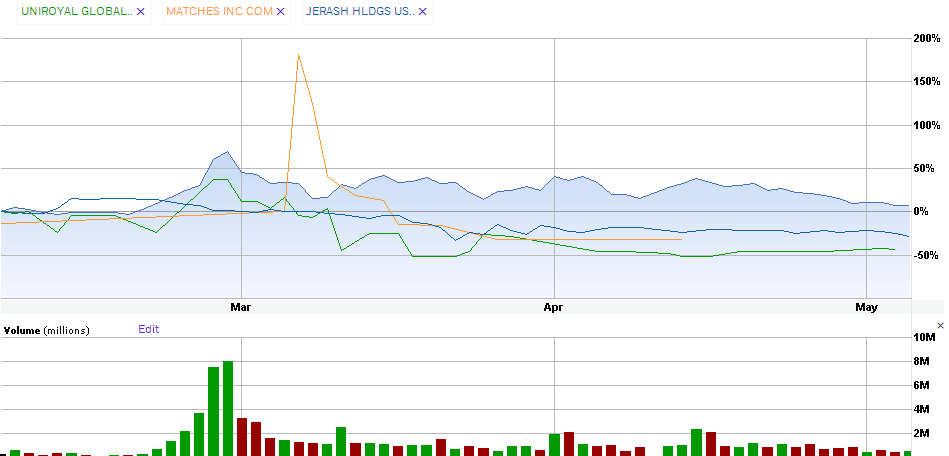
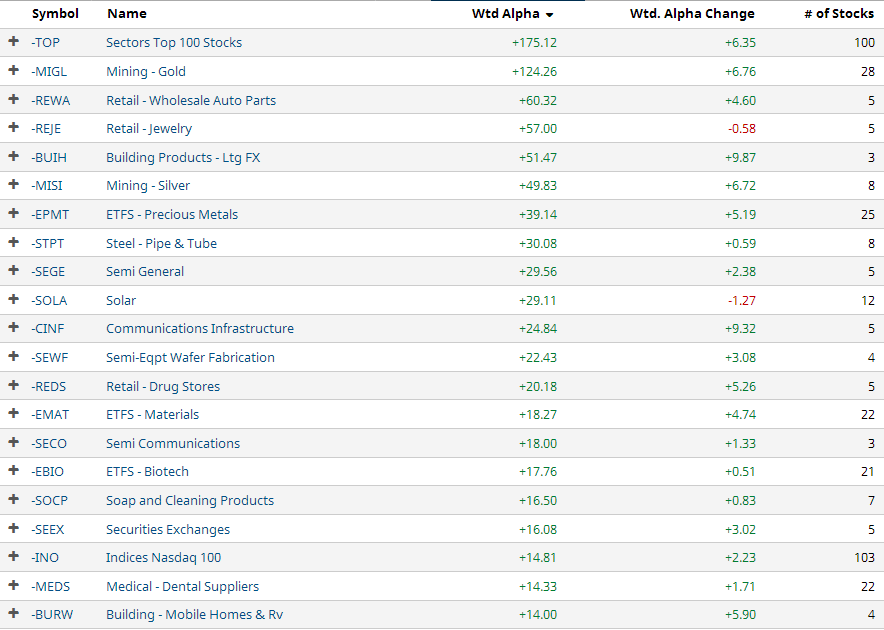
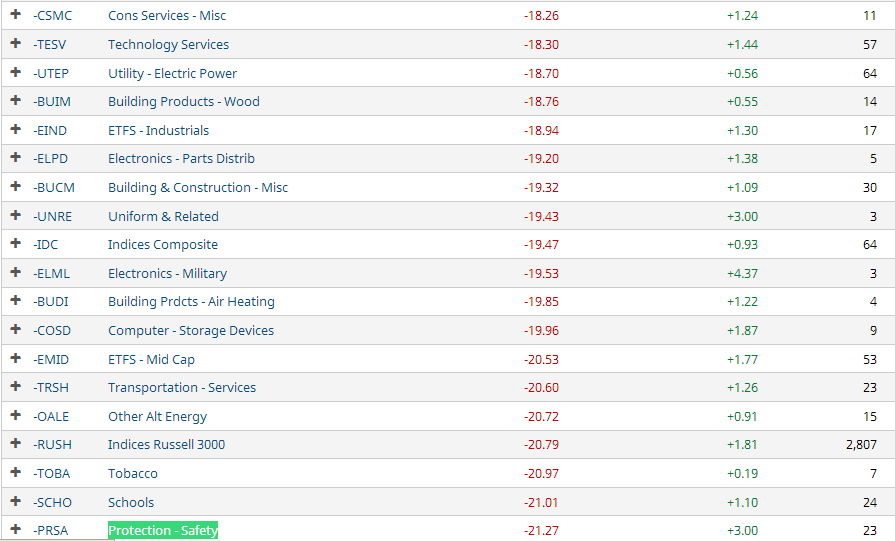
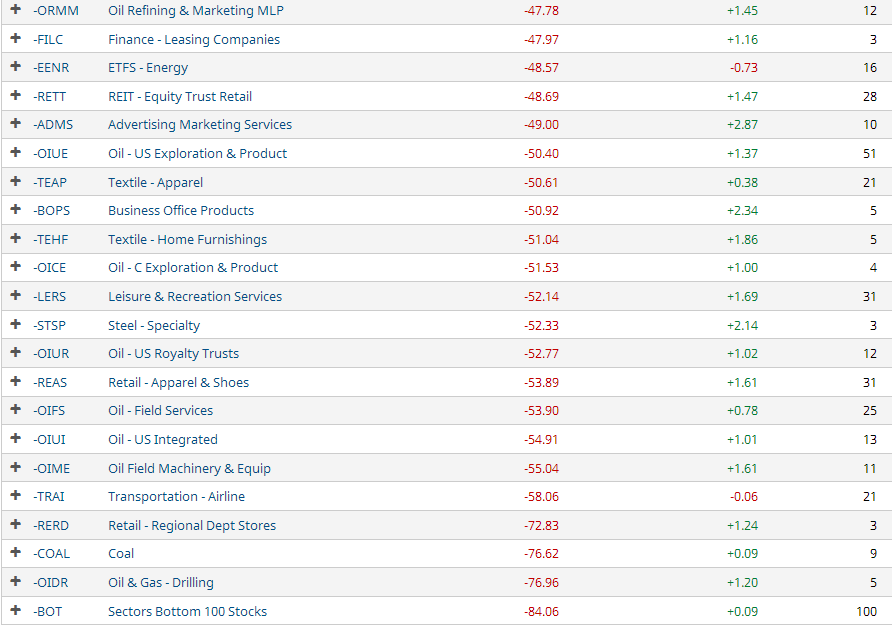
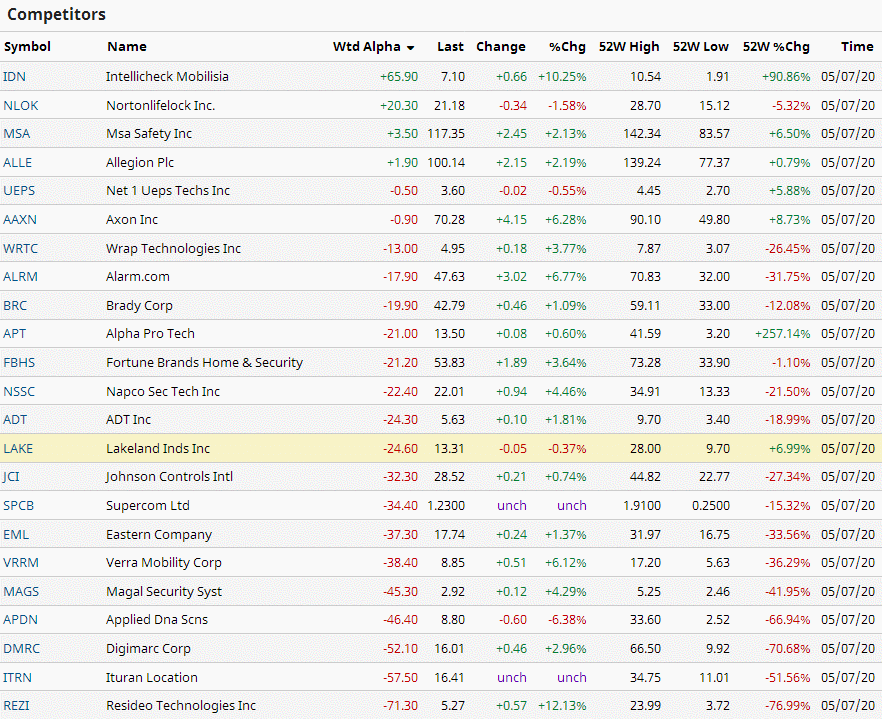
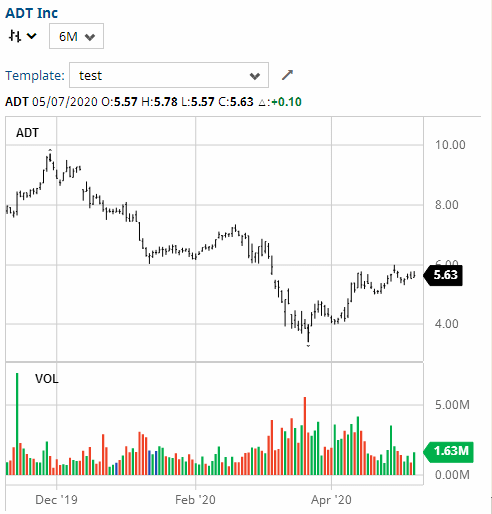
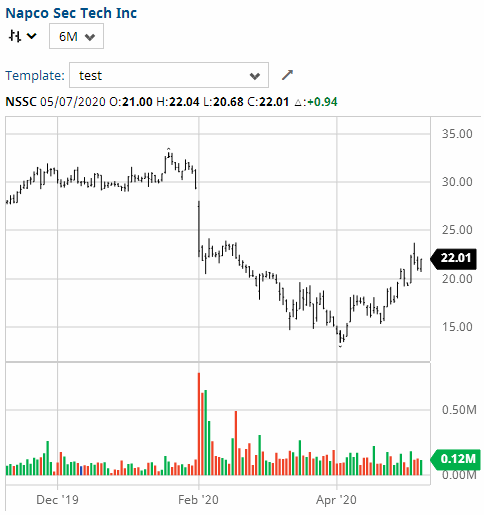
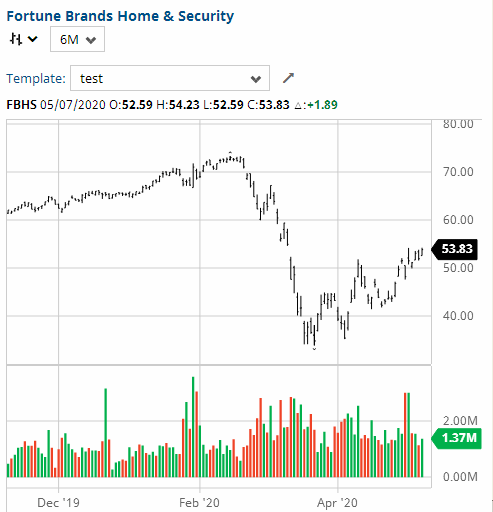
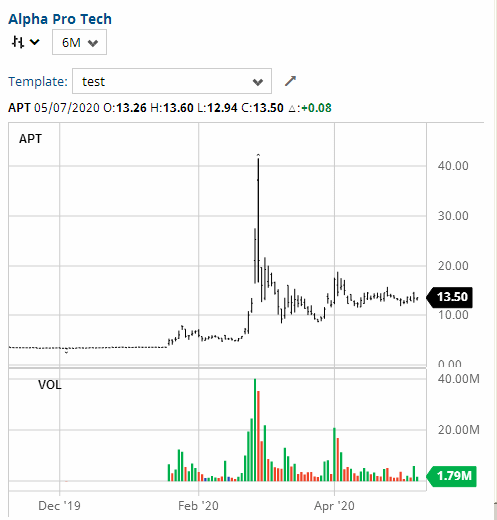
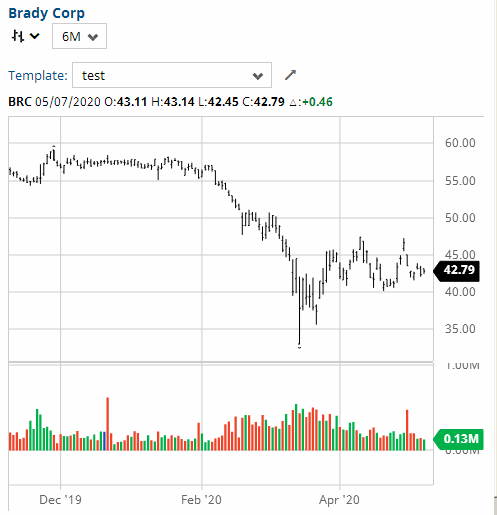
Similar Companies Performance:
Bond Issue |

Zenith Index |
Under current market conditions, a Zenith
Index Score of 1.20 or above is required for a positive rating on this
factor. 1.21 -1.30 is considered acceptable, 1.30-1.40 is considered
strong and
> 1.40 is considered exceptionally strong.
Accounting statements in this section often contain mistakes,
especially in earlier years' totals, but data is deemed sufficient for
us to give a rating. More accurate financial statements follow in the
next section.
Lakeland Industries, Inc. (LAKE)                          Exchange: Nasdaq
202 Pride Lane SW
Decatur, AL 35603                Sector: Consumer Cyclical
United States                    Industry: Apparel Manufacturing

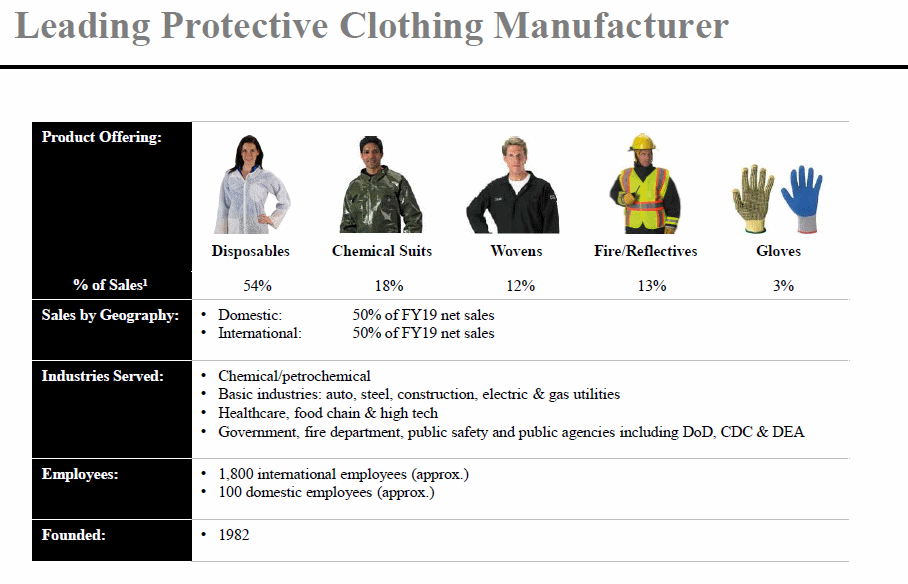
Lakeland Industries, Inc. manufactures and sells industrial protective
clothing and accessories for the industrial and public protective
clothing market worldwide. It offers limited use/disposable protective
clothing, such as coveralls, laboratory coats, shirts, pants, hoods,
aprons, sleeves, arm guards, caps, and smocks; high-end chemical
protective suits to provide protection from highly concentrated, toxic
and/or lethal chemicals, and biological toxins; and firefighting and
heat protective apparel to protect against fire, burns, and excessive
heat. The company also provides reusable woven garments, including
electrostatic dissipative apparel for electric and gas utilities; flame
resistant meta aramid, para aramid, and FR cotton
coveralls/pants/jackets used in petrochemical and refining operations;
FR fabrics; and cotton and polycotton coveralls, lab coats, pants, and
shirts. In addition, it provides high visibility clothing comprising
reflective apparel, including vests, T-shirts, sweatshirts, jackets,
coats, raingear, jumpsuits, hats, and gloves; and gloves and sleeves
that are used in the automotive, glass, and metal fabrication
industries. The company sells its products to a network of approximately
1,600 safety and industrial supply distributors through in-house sales
teams, customer service group, and independent sales representatives. It
serves end users, such as integrated oil, chemical/petrochemical,
automobile, steel, glass, construction, smelting, cleanroom, janitorial,
pharmaceutical, and high technology electronics manufacturers, as well
as scientific, medical laboratories, and the utilities industry; and
federal, state, and local governmental agencies and departments. The
company was founded in 1982 and is headquartered in Decatur, Alabama.

Last Trade:  13.36                           52-Week Range:  28.00 -   9.70
Employees: 1,829                             Avg.Volume:   1,278,275 Shares

Corporate Governance:
Pillar scores are Audit: N/A; Board: N/A; Shareholder Rights: N/A; Compensation:
 N/A.
         (A lower number means less governance risk.)

EPS:  0.41    Dividend Amount: $ 0.00          Yield:  0.00%
             Ex-Dividend Date: N/A             Payout Ratio:   0.00

Key Statistics:

    Trailing P/E:  32.46              Forward P/E (est.):  17.76
                                           Target Price:  20.25

Qrtly Stock Price Growth (yoy):   5.36%               Beta:  -0.11
Qrtly S&P Index   Growth (yoy):  12.60%        Short Ratio:   0.95%
    Qrtly Revenue Growth (yoy):  52.00%         Shares Out:  7970000
   Qrtly Earnings Growth (yoy):   0.00%

          Book Value:  10.67                    Debt/Equity:   4.00%
    Price/Book Value:   1.30        Operating Profit Margin:   5.45%
         Price/Sales:   1.03                  Profit Margin:   3.04%
         Market Cap:     106,113,000       Return on Equity:   3.90%
    Enterprise Value:      98,980,000      Return on Assets:   3.78%

    Operating Cash Flow:          3,590
         Free Cash Flow:          1,869


Annual Income Statement:                          (All numbers in thousands)
  Period Ending                             1/31/2020   1/31/2019   1/31/2018

  Total Revenue                                107,809      99,011      95,987
  Cost of Revenue                               69,912      65,105      59,784
  Gross Profit                                  37,897      33,906      36,203

Operating Expenses:
  Research & Development                             0           0           0
  Selling, General & Administrative                  0           0           0
  Total Operating Expenses                      32,021      30,341      27,726

Operating Income or Loss                         5,876       3,565       8,477

Income from Continuing Operations:
  Total Other Income/Expenses Net                   -7          41          29
  Interest Expense                                 116         125         163
  Income Before Taxes                            5,753       3,481       8,343
  Income Tax Expense                             2,472       2,022       7,903


Net Income from Continuing Op.s                  3,281       1,459         440

Non-recurring Events:
  Extraordinary Items                                0           0           0
  Net Income                                     3,281       1,459         440

Net Income Avail to Common Shares                3,281       1,459         440


Annual Cash Flow Statement:                   (All numbers in thousands)
  Period Ending                         1/31/2020     1/31/2019     1/31/2018

  Net Income                                 3,281         1,459           440

Operating Activities:
  Depreciation                               1,645           965           775
  Changes in Accounts Recv'bls              -1,414        -2,549        -3,068
  Changes in Liabilities                     2,557        -1,318          -257
  Changes in Inventories                    -2,156           152        -7,109
  Changes in other Oper'g Acts              -3,300        -1,796        -7,882

Total Cash Flow f Operations                 3,590         1,785           648

Investing Activities:
  Capital Exenditures                       -1,033        -3,103          -905
  Investments                                    0             0             0
  Other Cash Flows fr Investing                  0             0             0

Total Cash Flows from Investing             -1,033        -3,103          -905


Financing Activities:
  Dividends Paid                                 0             0             0
  Sale of Purchase of Stock                   -530          -530         9,584
  Other Cash Flows fr Financing                  0             0             0

Total Cash Flows from Financing               -688        -1,551         5,579

Change in Cash & Cash Equiv.                 1,775        -2,957         5,423


Annual Balance Sheets:                              (All Numbers in Thousands)
  Period Ending                          1/31/2020     1/31/2019     1/31/2018
Current Assets:
  Cash & Cash Equivalents                    12,831        15,788        10,365
  Short Term Investments                          0             0             0
  Net Receivables                            16,477        14,119        10,704
  Inventory                                       0             0             0
  Other Current Assets                        2,319         1,555         2,121
  Total Current Assets                       75,470        76,500        60,086

  Long-Term Investments                      19,915        17,696        17,332
  Property, Plant & Equipt                   10,781         8,789         8,527
  Goodwill                                      871           871           871
  Intangible Assets                               0             0             0
  Other Assets                                  158           504         1,077

Total Assets                                 94,723        94,531        84,554


Current Liabilities:
  Accounts Payable                            6,214         7,057         4,928
  Current Portion LT Debt                     2,825         1,182         1,018
  Other Current Liabilities                       0             0             0
  Total Current Liabilities                  10,334        10,379         12,325

  Long Term Debt                              1,161         1,312           716
  Other Liabilities                               0             0             0

Total Liabilities                            11,495        11,691        13,047
Stockholder Equity:
  Common Stock                                   85            85            76
  Retained Earnings                          14,300        12,841        12,401
  Capital Surplus                            -2,252        -1,651        -2,382
  Total Stockholder Equity                   83,228        82,840        71,507


Lakeland Industries, Inc. (LAKE)            [Indices near +3.0, near zero,
                                            or < zero bear special attention.]
P/E Ratio Tests:
P/E Ratio < 28?            0.8626          P/E Ratio > 5?             1.0000
P/E Ratio Vs Growth Rate:  0.0000          Forward P/E Ratio < 28?    1.5764
Price/Sales Ratio < 2.3?   2.2308          Inventory/Sales < 5%?      1.0000
Sales < $1 Billion?        3.0000          Operating Margin < 7.5%?   1.3761

Balance Sheet Tests:
Debt/Equity < 0.40?        3.0000          Long-Term Debt Service:    3.0000
LTD Being Reduced?         0.0000          Short-Term Debt Service:   0.0000
Current Ratio > 2?         3.0000          Working Capital >= 1.5?    0.2081
Leverage Ratio < 20%?      3.0000          Debt/Assets < 1?           3.0000
Quick Ratio > 1?           3.0000          Inventory Turnover > 1?    1.0000
Share Equity Increase:     2.1632          Market Cap.< 1.5 Billion?  3.0000
                                           Intangibles < 3% Assets?   3.0000
Income Tests:
Profit Margin < 7.5%?      0.4053          EPS Annual Growth > 10%?   0.0445
Dividend Yield > 2.0%?     0.0000          EPS 3-yr Growth > 15?      0.0201
Enterprise Value/Revenue   0.9842          EPS Growth Consistent?     2.0000
Enterprise Value/EBITDA:   3.0000          Collection < 45 days?      0.8067
EPS Qrtly Growth > 10%?    0.0000          Gross Pft/Cur. LTD > 1?    3.0000
                                           Borrowing Int. Rate < 6%?  0.6005
Stock Performance Tests:
Volatility > 25%?          2.6143          % Held by Insiders < 5%?   1.0730
Beta > 1.25?              -0.0880          % Held by Institut. < 50?  0.7757
50 Da MA > 200 Da MA?      0.5704          % Held by Institut. > 30?  2.1487
52-Wk Change vs. S&P 500:  0.1031          Short Ratio > 5?           0.1900
Price/Book Value < 3?      3.0000          Short % of Float > 20?     0.7545
Return on Assets > 17%?    0.2224          Average Volume > 100,000?  3.0000

Cash Flow Tests:
Oper. C.F. > Lever'd C.F:  1.9208          Positive Free Cash Flow?   3.0000
Positive Oper. Cash Flow?  3.0000          Price to C.F.Ratio < 14?:  0.7007
                                           Cash Flow / Assets > 10%?  0.5607

LAKE   Lakeland Industries, Inc.           Overall Zenith Index:      1.4865
Financial Statements |
LAKELAND INDUSTRIES INC (LAKE) INCOME STATEMENT Fiscal year ends in January. USD in thousands 2016-01 2017-01 2018-01 2019-01 2020-01 TTM Revenue 99,646 86,183 95,987 99,011 107,809 107,809 Cost of revenue 63,313 54,546 59,784 65,105 69,912 69,912 Gross profit 36,333 31,637 36,203 33,906 37,897 37,897 Operating expenses Other operating expenses 24,521 24,790 27,726 30,341 32,021 32,021 Total operating expenses 24,521 24,790 27,726 30,341 32,021 32,021 Operating income 11,812 6,847 8,477 3,565 5,876 5,876 Interest Expense 785 620 163 125 116 116 Other income (expense) -120 46 29 41 -7 -7 Income before taxes 10,907 6,273 8,343 3,481 5,753 5,753 Provision for income taxes 3,117 2,380 7,903 2,022 2,472 2,472 Net income from continuing operations 7,790 3,893 440 1,459 3,281 3,281 Net income from discontinuing ops -3,936 0 0 0 0 0 Net income 3,854 3,893 440 1,459 3,281 3,281 Net income available to common shareholders 3,854 3,893 440 1,459 3,281 3,281 Earnings per share Basic 0.54 0.54 0.06 0.18 0.41 0.41 Diluted 0.53 0.53 0.06 0.18 0.41 0.41 Weighted average shares outstanding Basic 7,172 7,258 7,638 8,111 8,006 8,006 Diluted 7,254 7,327 7,692 8,170 8,037 8,037 ____________________________________________________________________________________________________________________________________________ LAKELAND INDUSTRIES INC (LAKE) BALANCE SHEET Fiscal year ends in January. USD in thousands 2016-01 2017-01 2018-01 2019-01 2020-01 Assets Current assets Cash Total cash 7,022 10,365 15,788 12,831 14,606 Receivables 11,476 10,704 14,119 16,477 17,702 Inventories 40,841 35,535 42,919 42,365 44,238 Deferred income taxes 1,555 0 0 0 0 Prepaid expenses 1,143 1,361 2,119 1,478 1,228 Other current assets 1,635 2,121 1,555 2,319 2,033 Total current assets 63,672 60,086 76,500 75,470 79,807 Non-current assets Property, plant and equipment Gross property, plant and equipment 18,118 17,332 17,696 19,915 22,533 Accumulated Depreciation -8,850 -8,805 -8,907 -9,134 -10,176 Net property, plant and equipment 9,268 8,527 8,789 10,781 12,357 Goodwill 871 871 871 871 871 Intangible assets 95 0 0 0 0 Deferred income taxes 12,783 13,515 7,557 7,267 5,939 Other long-term assets 1,571 1,555 814 334 431 Total non-current assets 24,588 24,468 18,031 19,253 19,598 Total assets 88,260 84,554 94,531 94,723 99,405 Liabilities and stockholders' equity Liabilities Current liabilities Short-term debt 12,734 5,068 369 158 1,155 Capital leases 0 0 0 0 835 Accounts payable 4,254 4,928 7,057 6,214 7,204 Accrued liabilities 1,575 1,018 1,182 2,825 2,445 Other current liabilities 1,395 1,311 1,771 1,137 1,300 Total current liabilities 19,958 12,325 10,379 10,334 12,939 Non-current liabilities Long-term debt 691 716 1,312 1,161 0 Capital leases 0 0 0 0 1,414 Other long-term liabilities 95 6 0 0 0 Total non-current liabilities 786 722 1,312 1,161 1,414 Total liabilities 20,744 13,047 11,691 11,495 14,353 Stockholders' equity Common stock 76 76 85 85 85 Additional paid-in capital 64,468 64,764 74,917 75,612 75,171 Retained earnings 8,508 12,401 12,841 14,300 17,581 Treasury stock -3,352 -3,352 -3,352 -4,517 -5,023 Accumulated other comprehensive income -2,184 -2,382 -1,651 -2,252 -2,762 Total stockholders' equity 67,516 71,507 82,840 83,228 85,052 Total liabilities and stockholders' equity 88,260 84,554 94,531 94,723 99,405 ____________________________________________________________________________________________________________________________________________ LAKELAND INDUSTRIES INC (LAKE) Statement of CASH FLOW Fiscal year ends in January. USD in thousands 2016-01 2017-01 2018-01 2019-01 2020-01 TTM Cash Flows From Operating Activities Net income 3,854 3,893 440 1,459 3,281 3,281 Depreciation & amortization 986 1,194 775 965 1,645 1,645 Investment/asset impairment charges 0 200 751 150 0 0 Deferred income taxes -57 734 5,957 290 1,328 1,328 Stock based compensation 586 276 424 744 -403 -403 Change in working capital -8,478 5,495 -7,882 -1,796 -3,300 -3,300 Accounts receivable 1,443 896 -3,068 -2,549 -1,414 -1,414 Inventory -4,239 5,494 -7,109 152 -2,156 -2,156 Prepaid expenses 574 -218 -759 641 250 250 Accounts payable -3,306 585 1,955 -372 1,090 1,090 Accrued liabilities -3,271 -633 658 892 -220 -220 Other working capital 321 -629 441 -560 -850 -850 Other non-cash items 2,591 -299 183 -27 1,039 1,039 Net cash provided by operating activities -518 11,493 648 1,785 3,590 3,590 Cash Flows From Investing Activities Investments in property, plant, and equipmen -840 -413 -905 -3,103 -1,033 -1,033 Other investing activities -1,835 0 0 0 0 0 Net cash used for investing activities -2,675 -413 -905 -3,103 -1,033 -1,033 Cash Flows From Financing Activities Debt issued 6,564 1,463 1,707 175 0 0 Debt repayment -2,148 -9,147 -5,866 -535 -158 -158 Common stock issued 0 0 10,114 0 0 0 Common stock repurchased -750 -21 -376 -1,191 -530 -530 Other financing activities 40 41 0 0 0 0 Net cash provided by (used for) financing 3,706 -7,664 5,579 -1,551 -688 -688 Effect of exchange rate changes -200 -73 101 -88 -94 -94 Net change in cash 313 3,343 5,423 -2,957 1,775 1,775 Cash at beginning of period 6,709 7,022 10,365 15,788 12,831 12,831 Cash at end of period 7,022 10,365 15,788 12,831 14,606 14,606 Free Cash Flow Operating cash flow -518 11,493 648 1,785 3,590 3,590 Capital expenditure -840 -413 -905 -3,103 -1,033 -1,033 Free cash flow -1,358 11,080 -257 -1,318 2,557 2,557 ____________________________________________________________________________________________________________________________________________
Average to Current P/E Ratios |
              (LAKE)     Lakeland Industries Inc.

                               2015    2016    2017    2018    2019

          Annual Earnings:     0.60    0.53    0.06    0.18    0.41
Average Price During Year:    10.75   10.57   12.55   13.68   11.24

                P/E Ratio:    17.92   19.94  209.10   75.99   27.41

 Average 5-Year P/E Ratio  =  70.07
             Current Price =  13.36

Previous 5 Quarter Earnings:  -0.24   -0.06    0.17    0.14    0.15

          Current Annualized (Last Four Quarters) Earnings =   0.46                                                           ________
                                 Average PE / Current PE =     2.41
                                                           --------

                                      ...a number above 1.00 is good
                                                1.00 or below is bad
Financial Ratios |
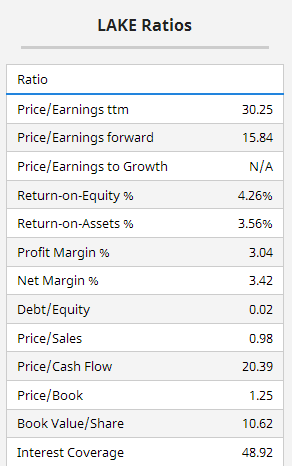
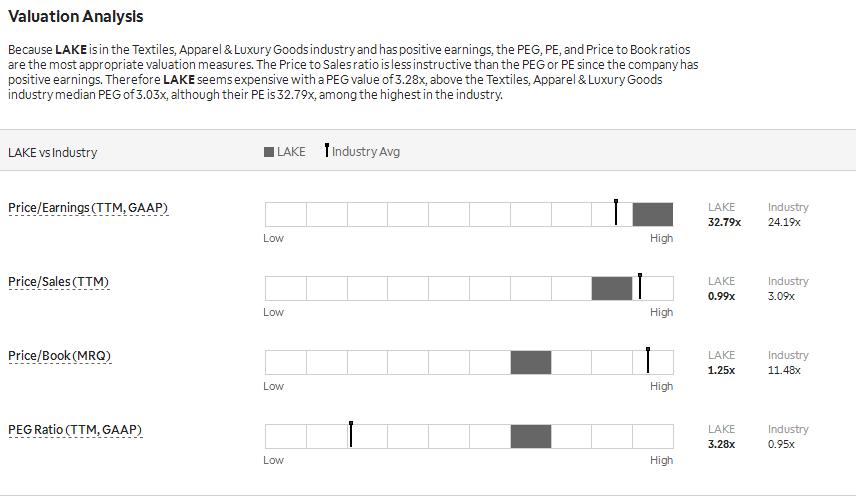
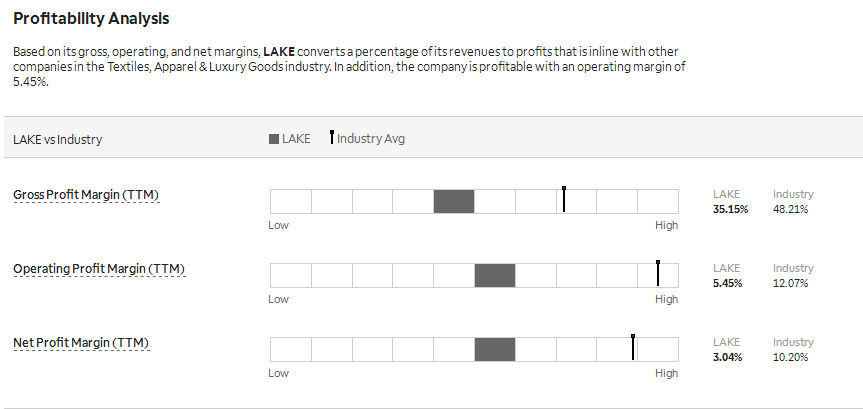
. . . . . . . . . . . . Lowest to Highest, Compared to Industry
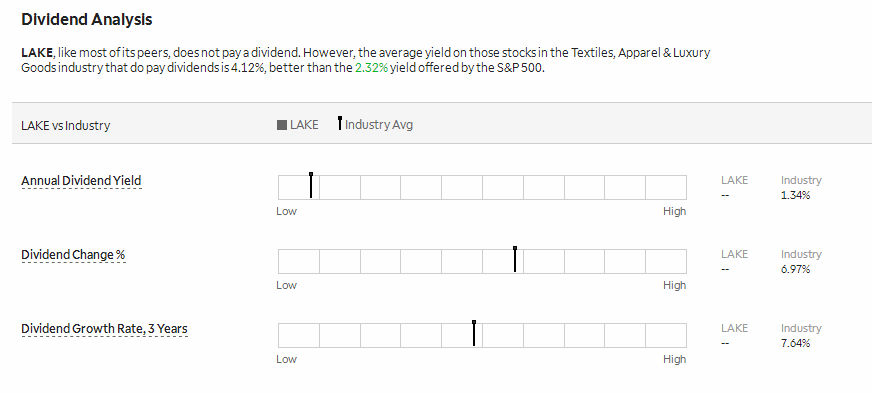
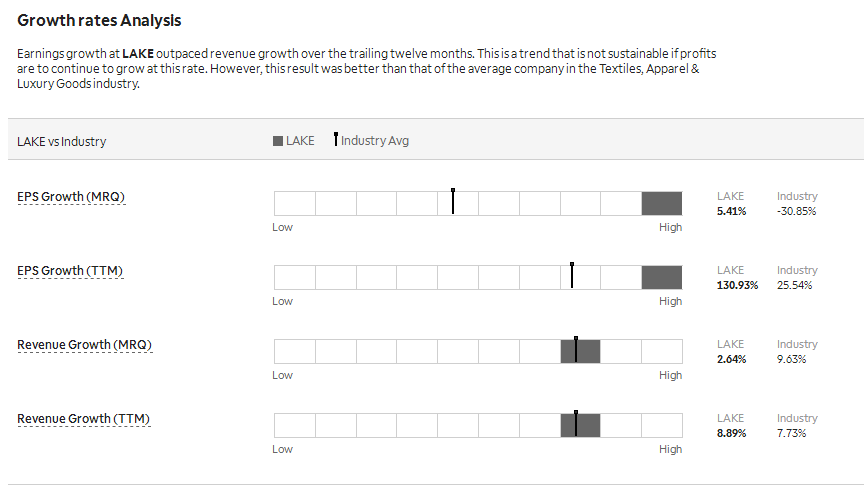
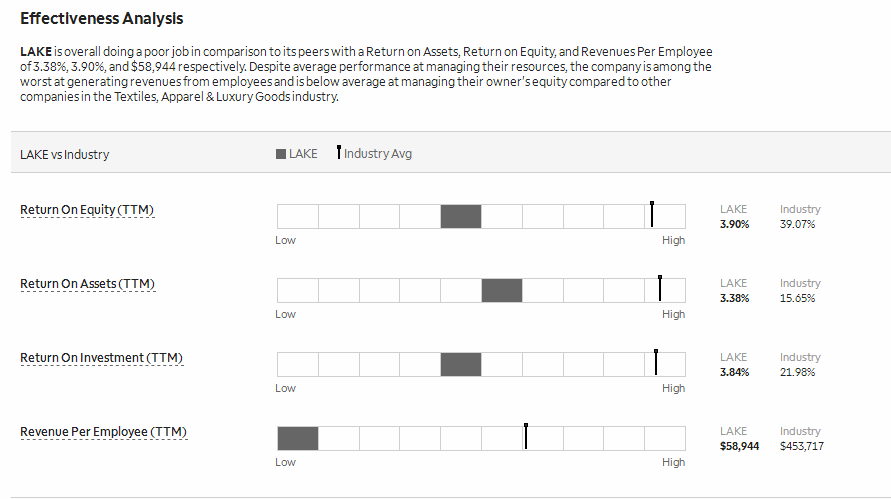
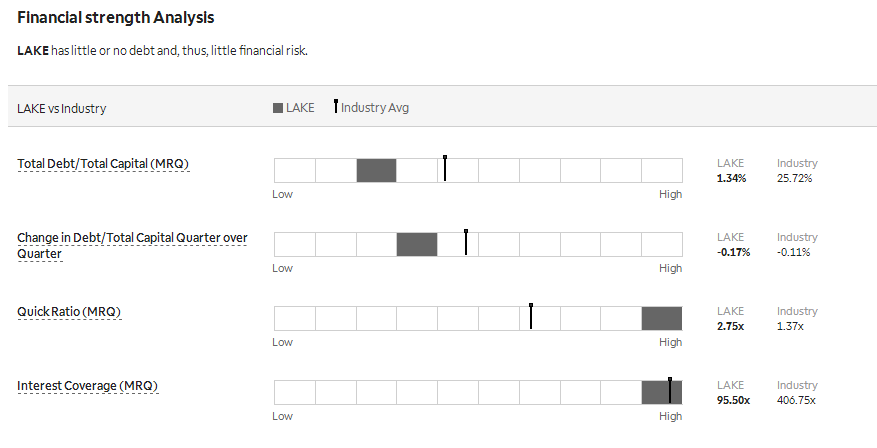
Intrinsic Value (DCF) |
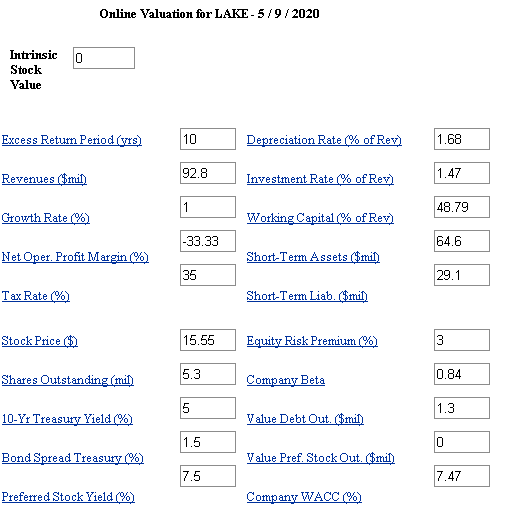
Intrinsic Value by Discounted Cash Flow Method:
Fair Value Estimator |
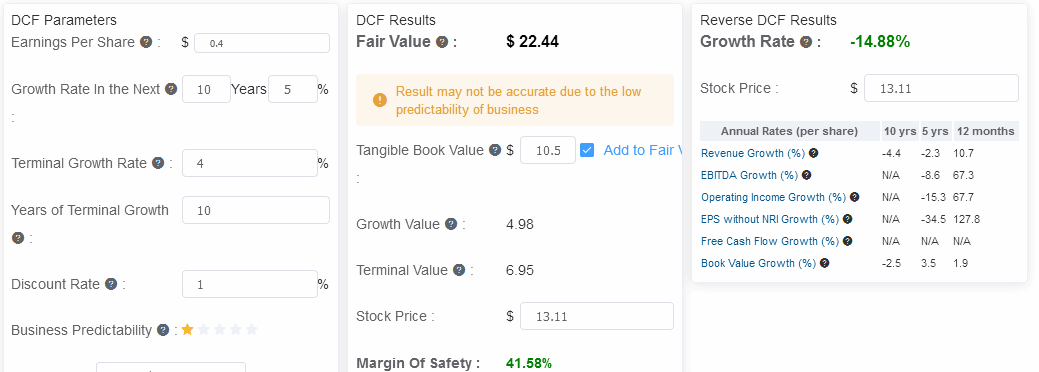
Fair Value Estimate:
Projected Earnings |

Research Reports |
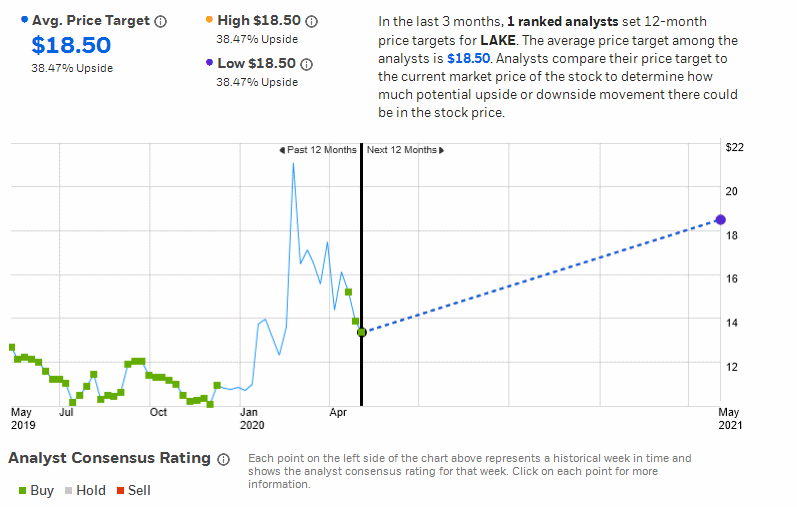
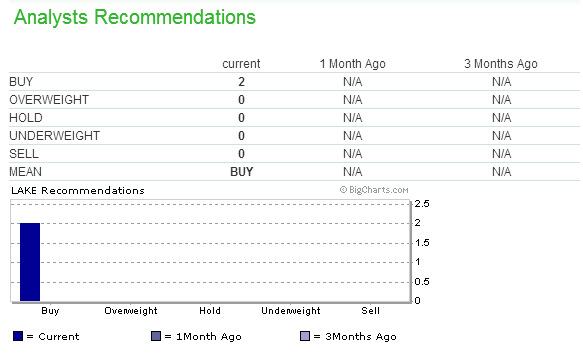
Analysts' Opinions |


Insider Activity |
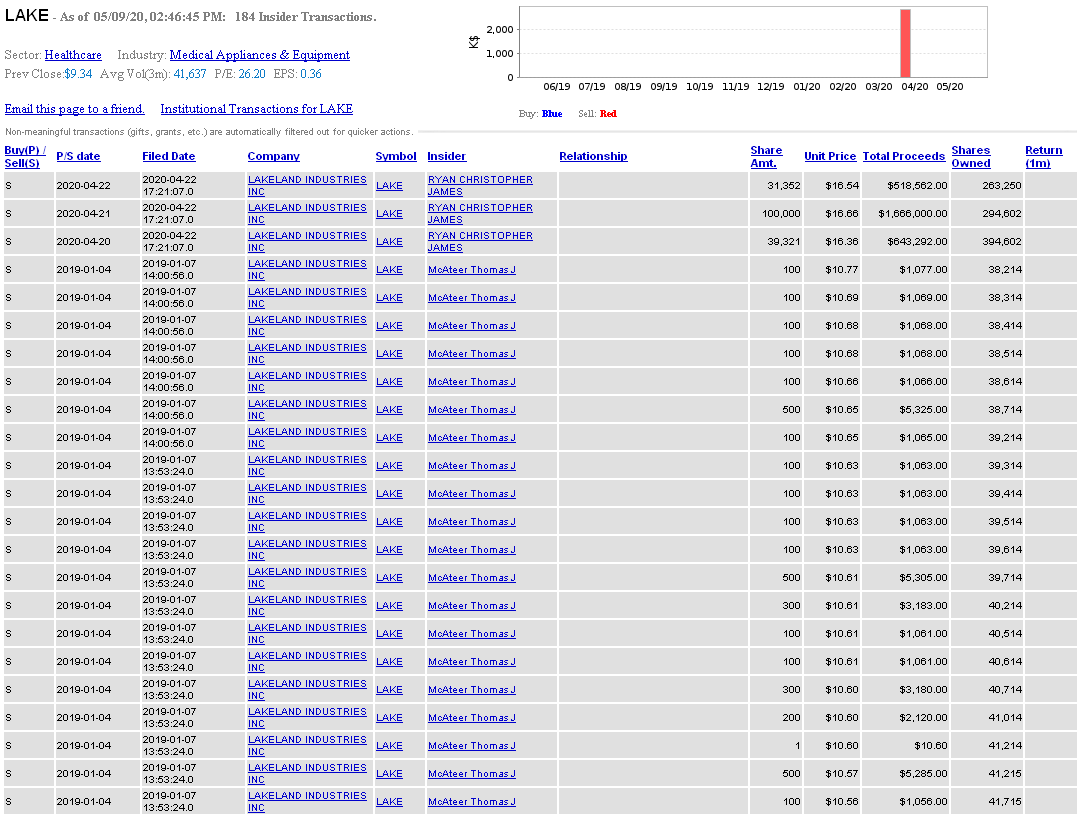

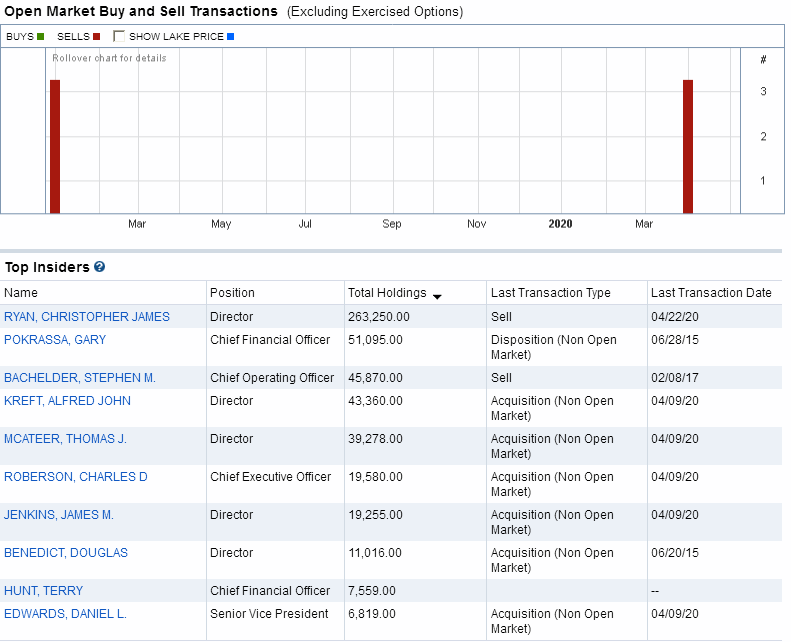
Institutional Activity |
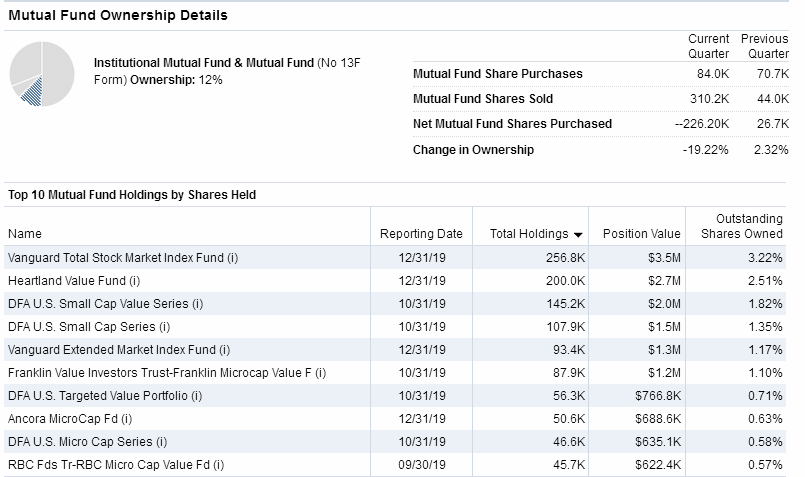
Institutional Ownership:
Sentiment |
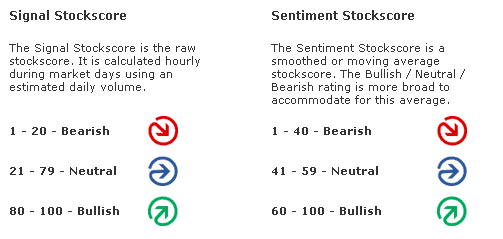
Zenith uses the "sentiment" score above or below 50 to award a positive or negative point in the Decision Matrix.


Short Interest Ratio |
As the short interest rises as a percentage of average daily share volume (Days to Cover), this is considered a measure of negative sentiment. Similarly, a decrease in that percentage is considered positive sentiment.


Standard & Poor's |
Management's Discussion of Results of Operations Excerpts |
Channeling Potential |
The summary below includes a value for `Degree,' which refers on a
scale of 1 to 10 the range of a channel in the period under consi-
deration compared to the total range of price movement. It also looks
for the last closing price to be within the channel, otherwise zeroed.
The `Index' is the `Degree' weighted for volatility.  Generally, the
the higher the index, the more suitable is the stock for trading as
a `rolling stock' between channel high and low points.

Results for LAKELAND INDUSTRIES INC.:
Symbol? LAKE
Total Months Available:  24
       Months in Cycle?   4

Months Covered by Periods:  12

Period 1           Period 2          Period 3
   H1      L1        H2      L2        H3      L3
  12.96    9.70     12.28    9.97     28.00   10.53

RANGE   =  28.00  TO    9.70            Close =  13.35
CHANNEL =  12.28  TO   10.53           Degree =   1
Volatility =  13.11%                    Index =   1
MACD Histogram Divergence |
The theory is that connecting the two most recent peaks or valleys of the MACD histogram will signal the direction of the next major move.
Intraday Chart |
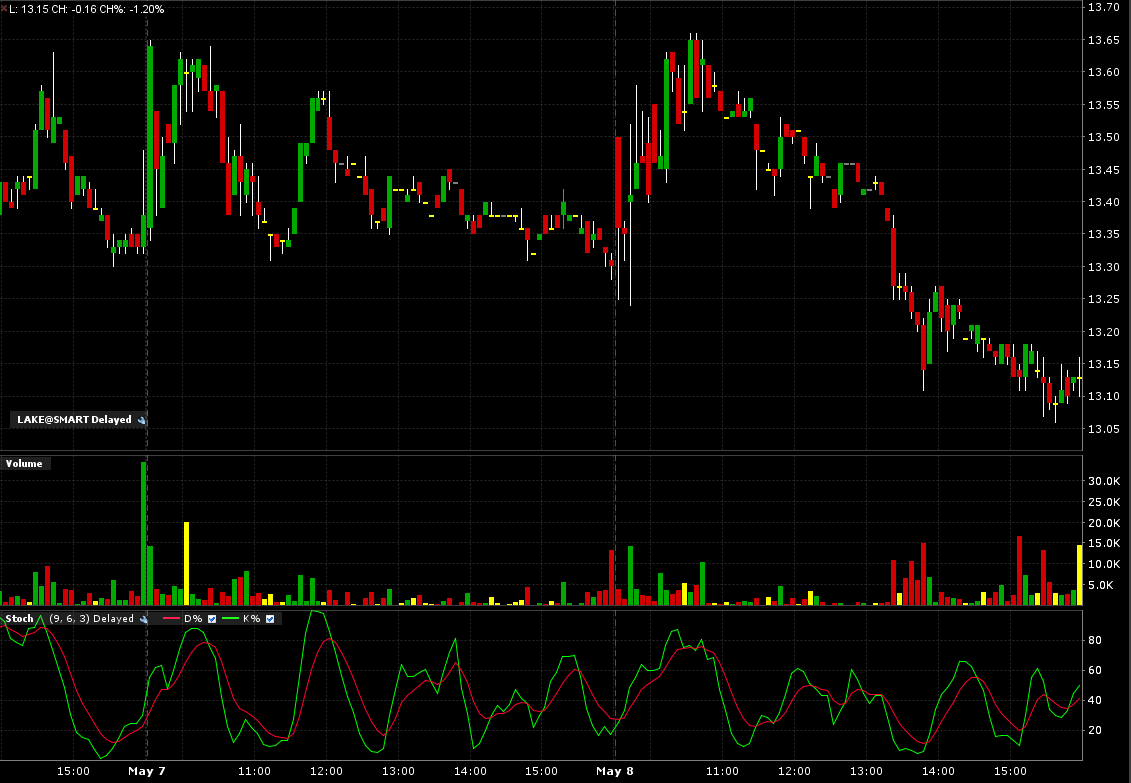
2 Days:
Val Idea |
3 out of 8 favorable, (negative opinion.)
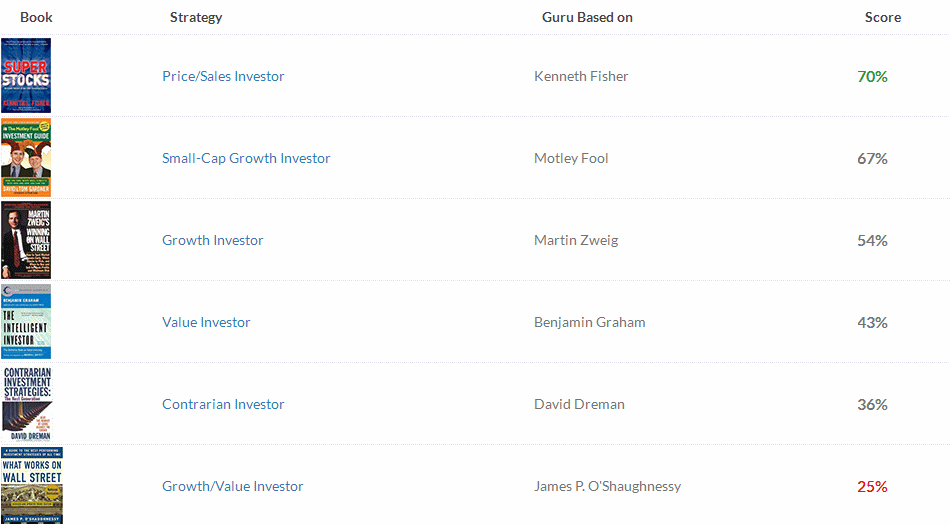

Stock Consultant |
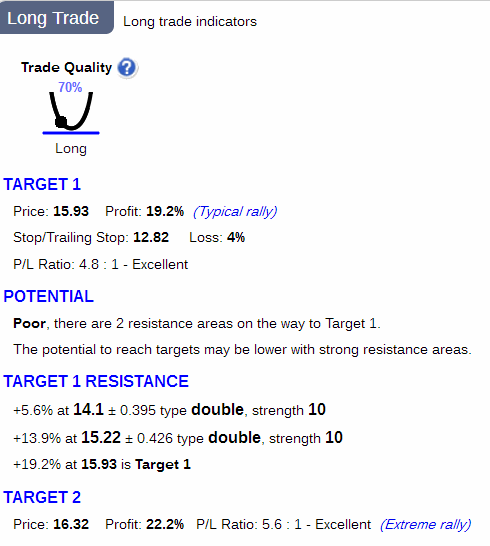
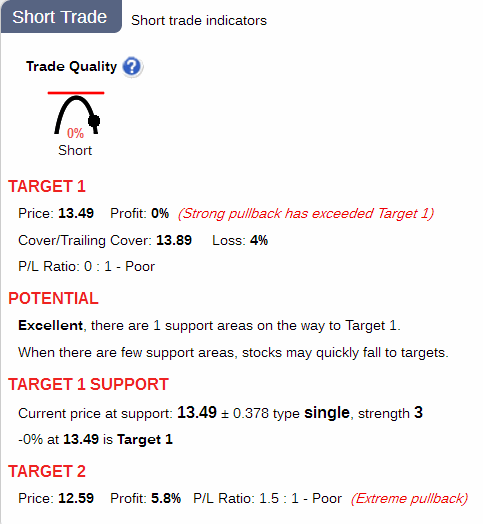
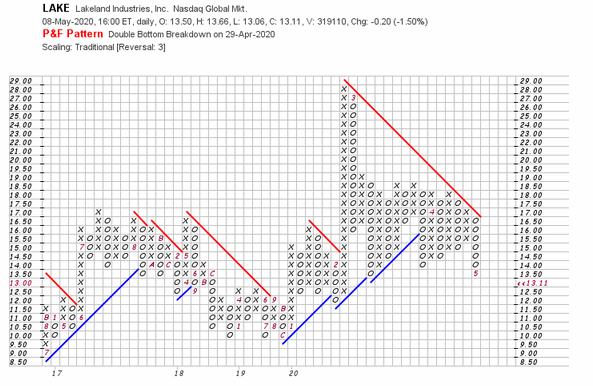
Point & Figure Chart |
Wall Street Analyzer |
Marketspace Chart |
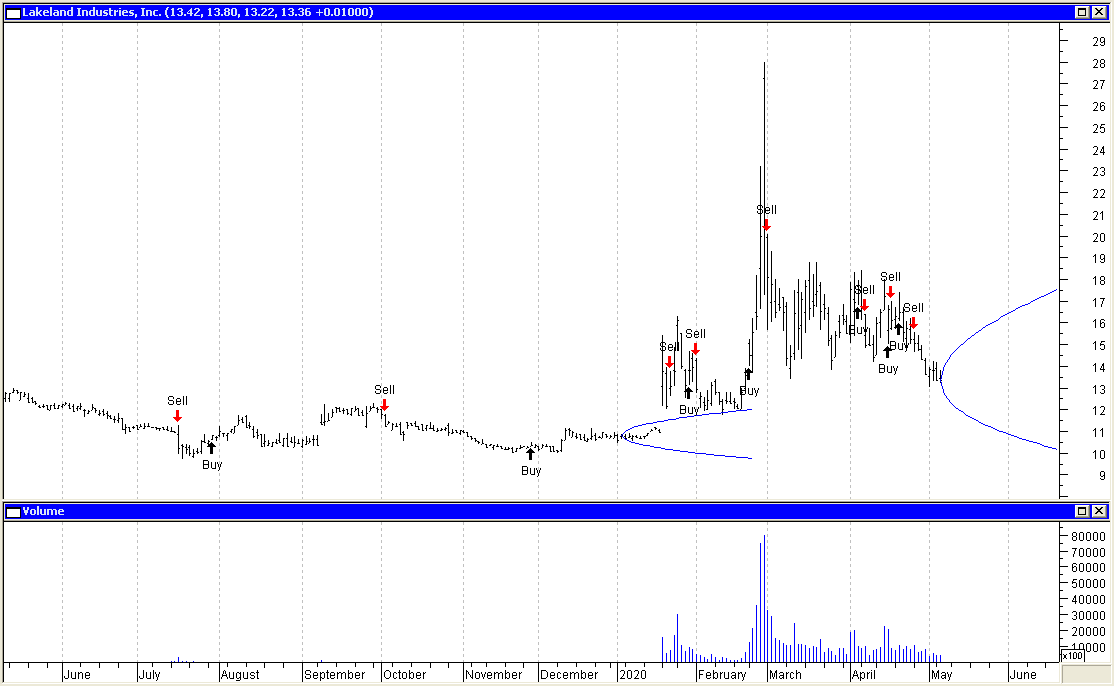
Time Series Forecast |
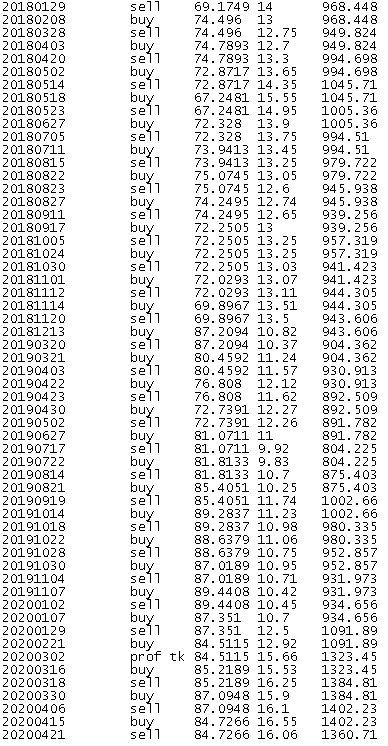
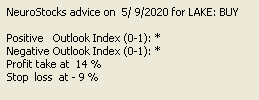
Neural Network Prediction |
"Neurostock" can only track long trades. Therefore its performance, as tracked by itself on stocks which are consistently falling, may not appear as good as it could if each "sell" signal were a "short sale."

![]()
Ultimate Trading Systems |
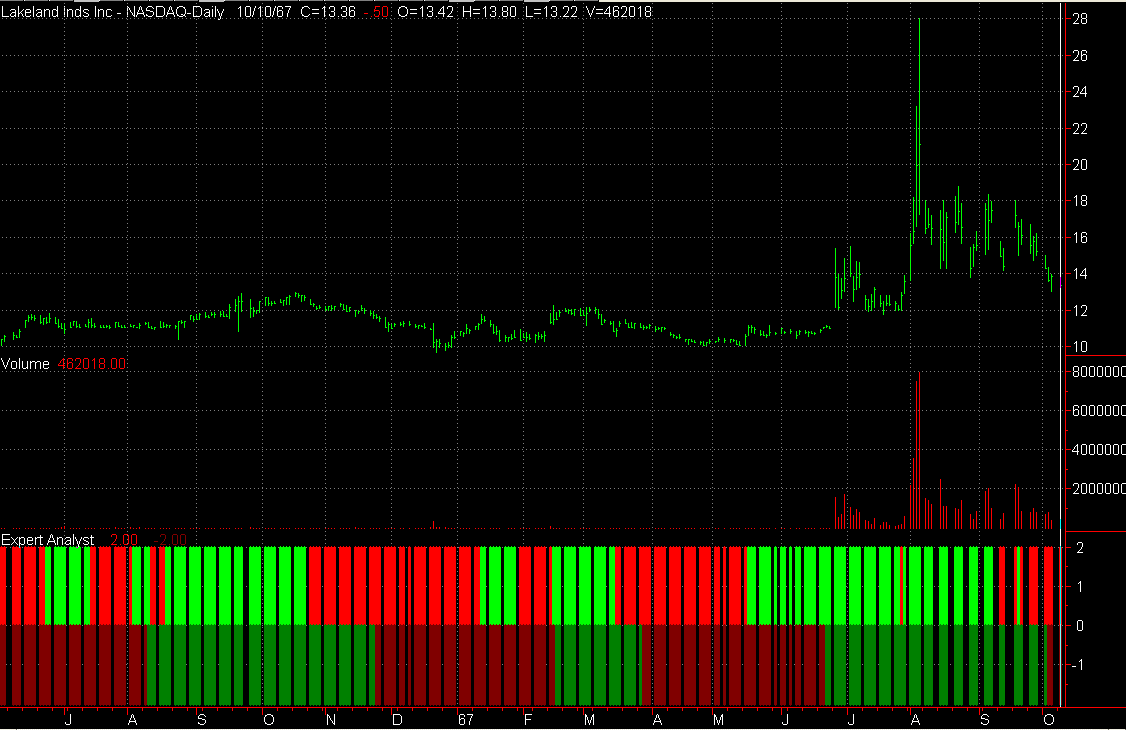
2 out of 3 of the ultimate systems favor a downmove.
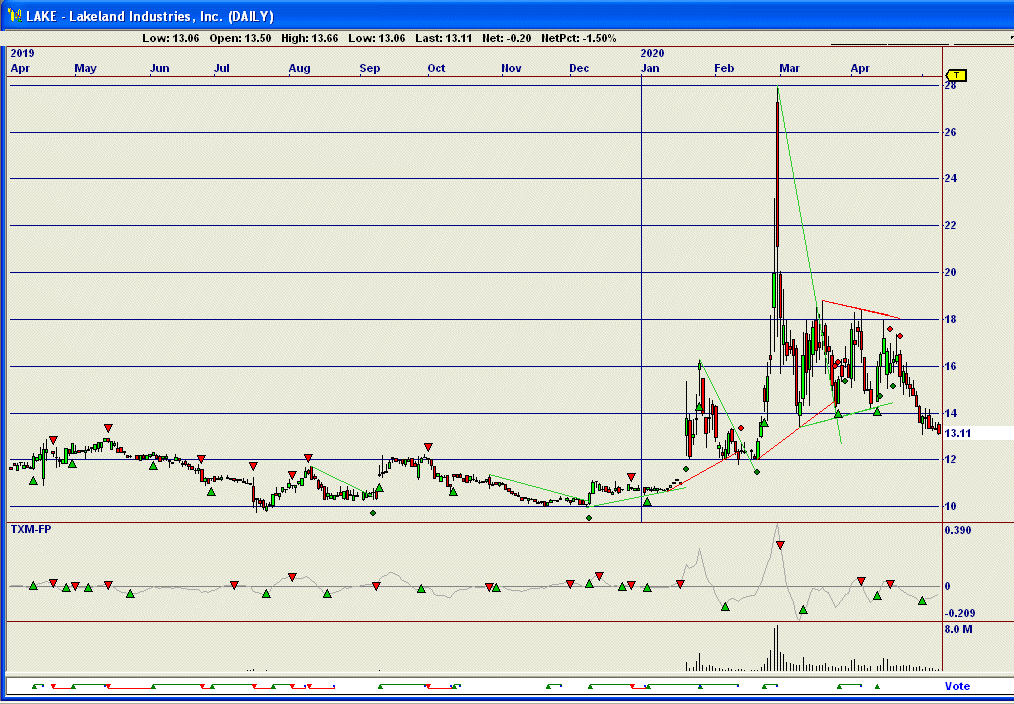
System Below:
Short term outlook: Positive: Bright Green, Negative: Bright Red
Long term outlook: Postive: Dark Green, Negative: Dark Red.

Recommendation |
| Factors | Weighted Points |
|---|---|
| News | + 1 |
| Comparison | - 1 |
| Industry | - 1 |
| Bond Issue | - 1 |
| Zenith Index | + 1 |
| Non-GAAP vs. GAAP Earnings | + 1 |
| Cash Flow | + 1 |
| Average to Current P/E | + 1 |
| Ratios | + 1 |
| Intrinsic Value DCF | - 1 |
| Fair Value Estimator | + 1 |
| Projected Earnings | + 1 |
| Research Reports | - 1 |
| Analysts | + 1 |
| Executive Perquisites | + 1 |
| Insider Activity | - 1 |
| Institutional Activity | - 1 |
| Management Reporting | + 1 |
| Short Interest | + 1 |
| Sentiment | - 1 |
| Standard & Poor's | - 1 |
| MACD Histogram Divergence | - 1 |
| Val Idea | - 1 |
| Stock Consultant | + 1 |
| Point & Figure | - 1 |
| Wall Street Analyzer | + 1 |
| Marketspace Chart | - 1 |
| Time Series Chart | + 1 |
| Neural Network | + 1 |
| Stock Options | + 1 |
| Ultimate Trading Systems | - 1 |
| Total | + 2 |
Place 2,160 shares of Lakeland Industries, Inc. (LAKE) on the Active List.