![]()
Corporate Webpages Invesco Limited
Back in the days when small traders were first introduced to the
end of fixed commissions on stocks, "no load mutual funds" were
a way with less leverage and total cost risk to trade markets
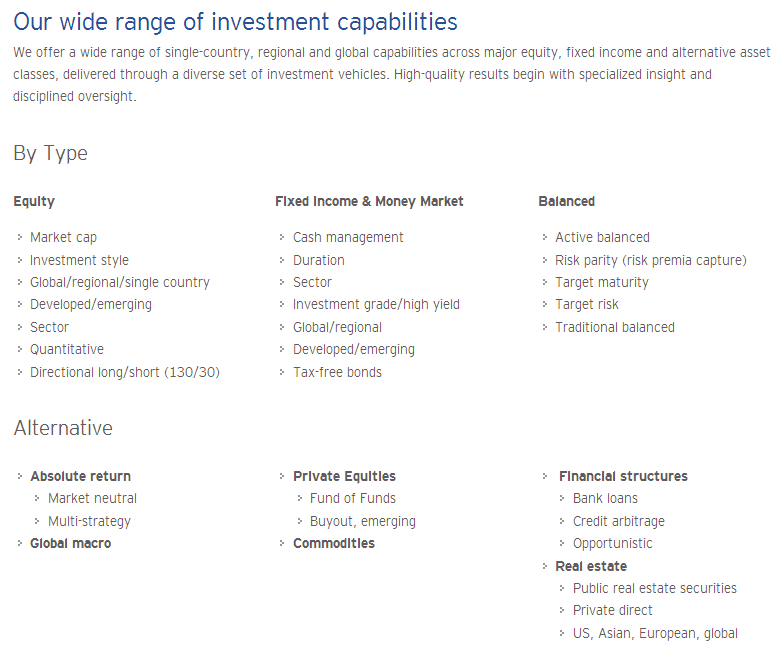
with a diversified list of stocks. Invesco Ltd. (IVZ) had
plenty of these. Today, exchange traded funds (ETF's) compete
with mutual funds and offer advantages such as ability to place
stop orders on them. Invesco has plenty of those, as well.
Index funds holding baskets of stocks that trade the entire
market or the S&P 500 Index still have fees called "expense
ratios." No load EFT's and funds don't charge commissions or
management or redemption penalties, but still have small
expenses, some as small as an annual 0.03%. Invesco's are
typically larger than that.
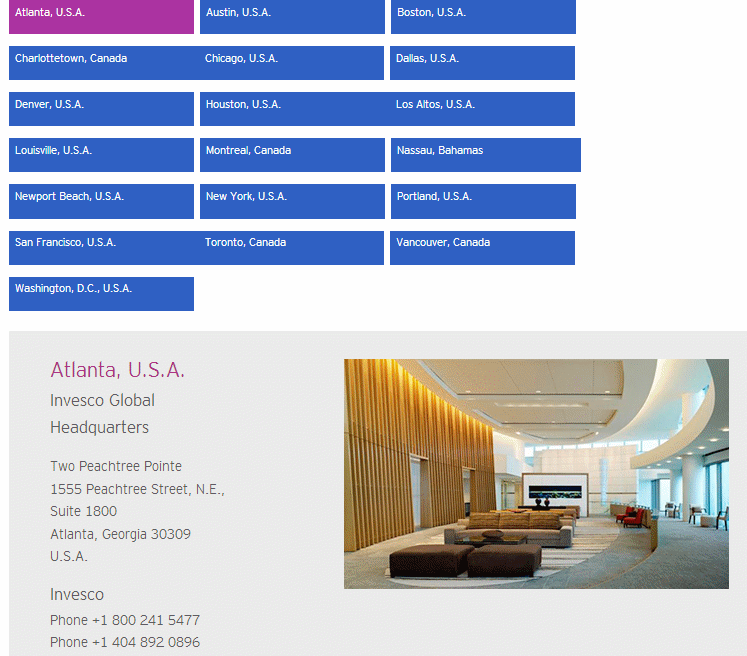
Invesco is Atlanta-based, but also does a lot of business in
Britain with another head office in the Cayman Islands. Trading
Invesco stock is nothing like trading Invesco ETF's, and does
not necessarily reflect the general market. Invesco has been
among the worst performers of all ETF's and funds, if not THE
worst, but this should not affect ability to trade the ETF's in
either direction, sort of like an index commodity.
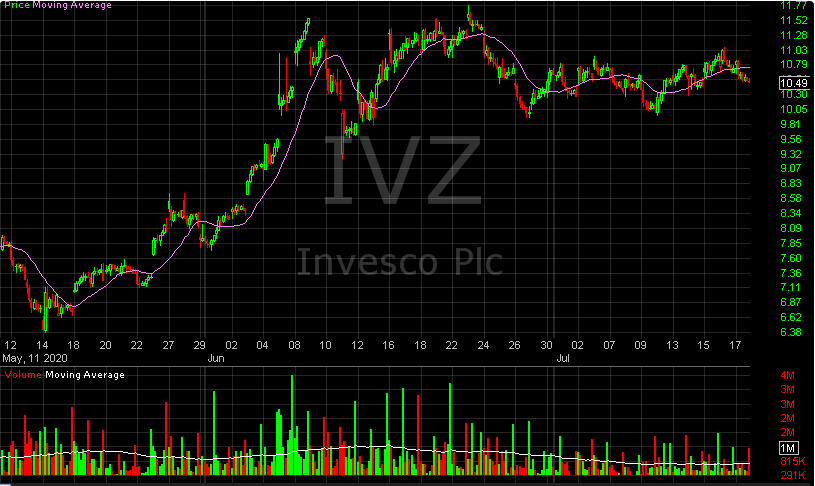
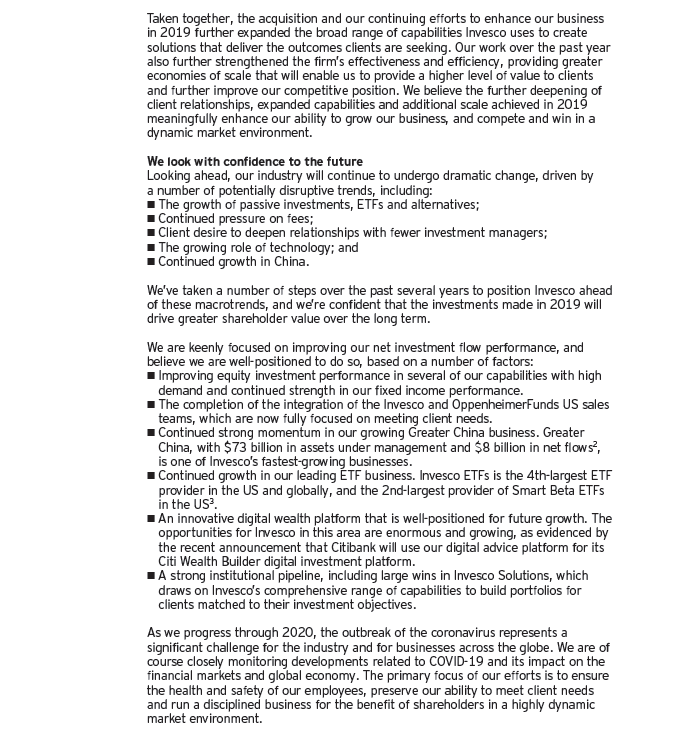
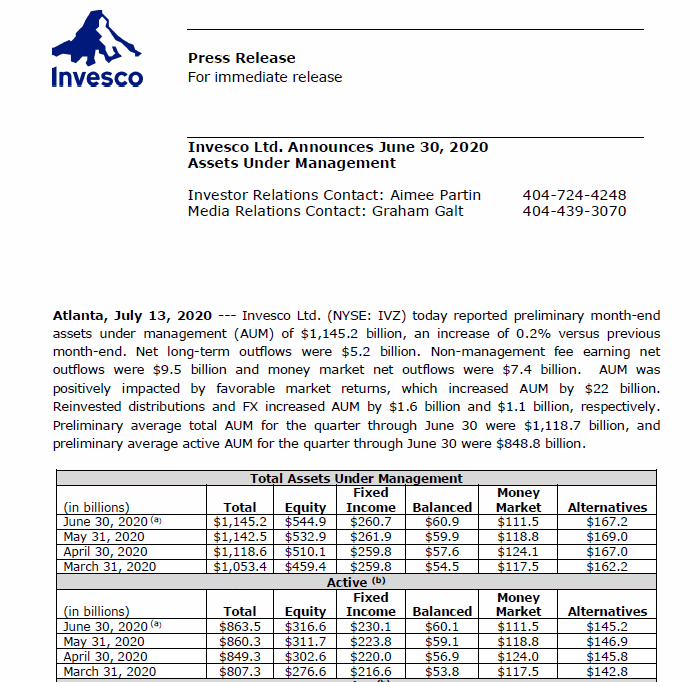
Like so many other stocks, IVZ was hit hard by the pandemic.
One reason for this was extreme market volatility causing many
investors to pull out and await stabler less risky times. We
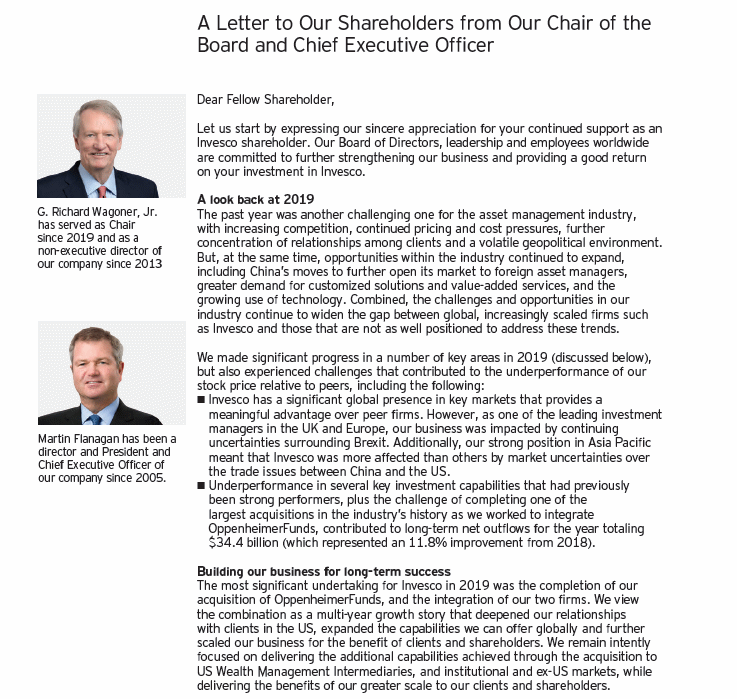
think its relation to Oppenheimer Funds both by acquisition and
hiring of former managers is another cause of problematic
competing with other managed funds, as in our opinion,
OPpenheimer has some of the worst of all possible funds and is
very poorly managed. It is the complete opposite to better
investments offered by organizations like Dimensional Fund
Advisors (DFA) which is more concerned with value stocks.
The stock has been paying what Cramer refers to as an "accidental
dividend" of nearly 6%, but this is not sustainable because the
payout exceeds income.
The stock has a very low p/e ratio because the share price was
dragged down so much by poor performance. This bodes well for
at least a partial recovery.
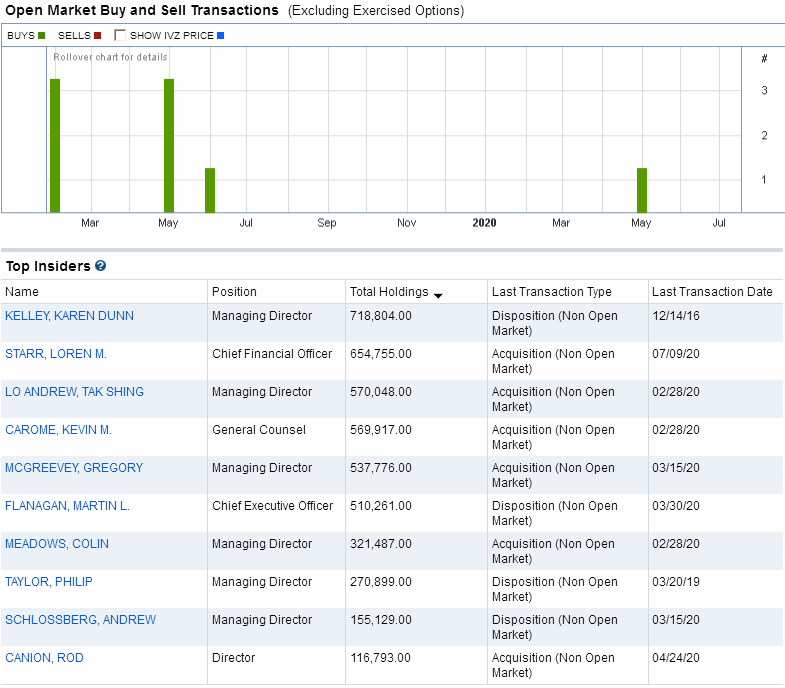
There is considerable positive insider buying in the stock.
All in all, we think there is a very good chance for this stock
to push higher, with less downside risk than other financial
management stocks because the stock has been hit so hard already.
(WAIT FOR PAGE TO LOAD COMPLETELY BEFORE LINKS WORK.)
Company Profile
Company History
News
Comparison with Peers
Bond Issue
Zenith Index
Financial Statements
Avg. P/E to Current P/E
Financial Ratios
Intrinsic Value (Disc. CashFlow)
Fair Value Estimator
Projected Earnings
Research Reports
Analysts' Opinions
Insider Activity
Institutional Activity
Sentiment
Short Interest
Standard & Poor's
Management's Discussion
Channel Potential
MACD Histogram
Intraday Chart
Val Idea
Stock Consultant
Point & Figure Chart
Wall Street Analyzer
Marketspace Chart
Time Series Forecast
Neural Network Prediction
Stock Options
Ultimate Trading Systems
Recommendation






Company Profile |

Company History |
News |
Comparison |
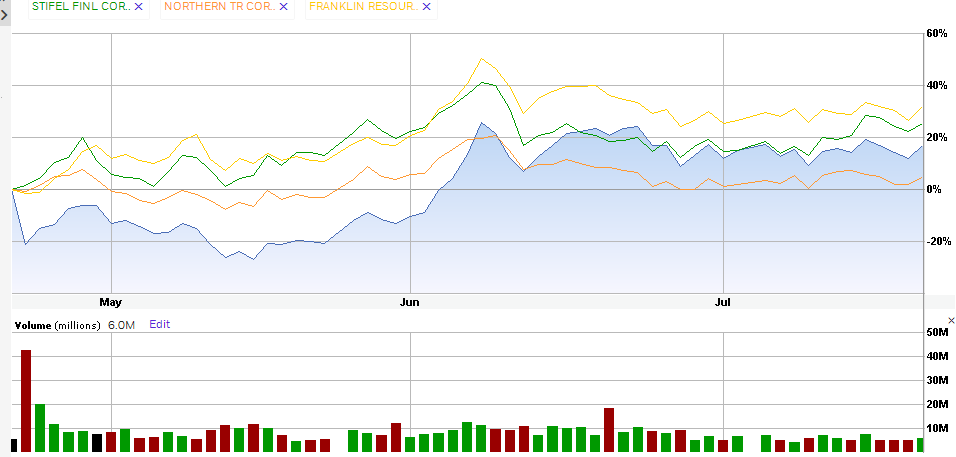
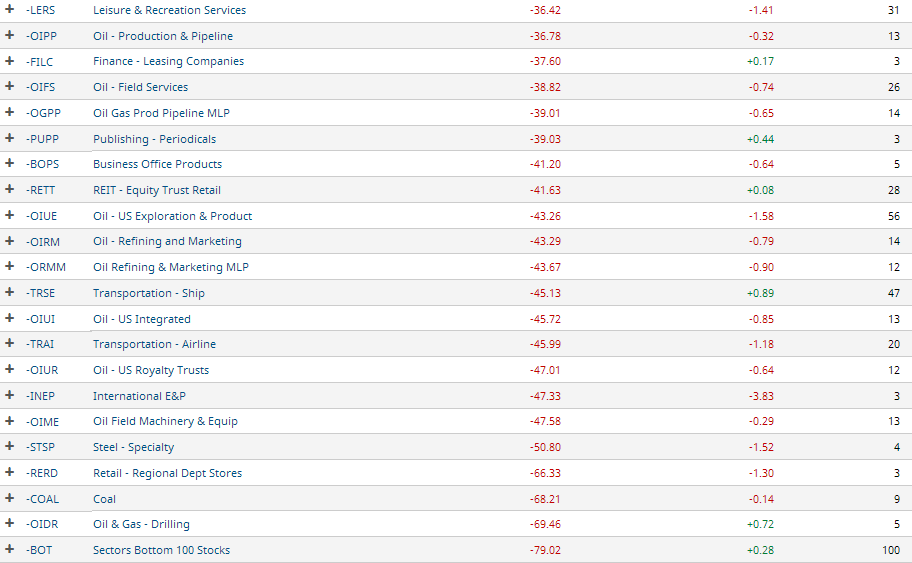
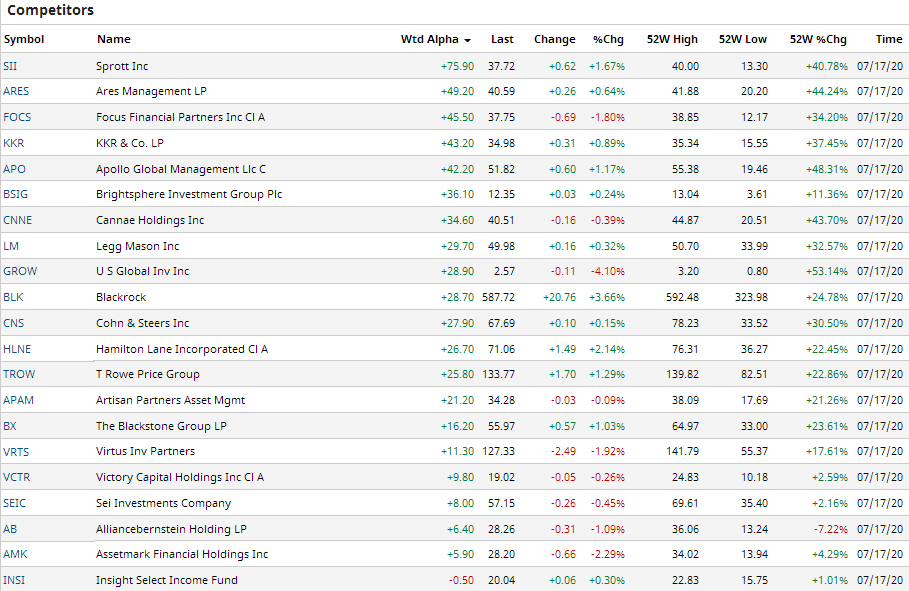
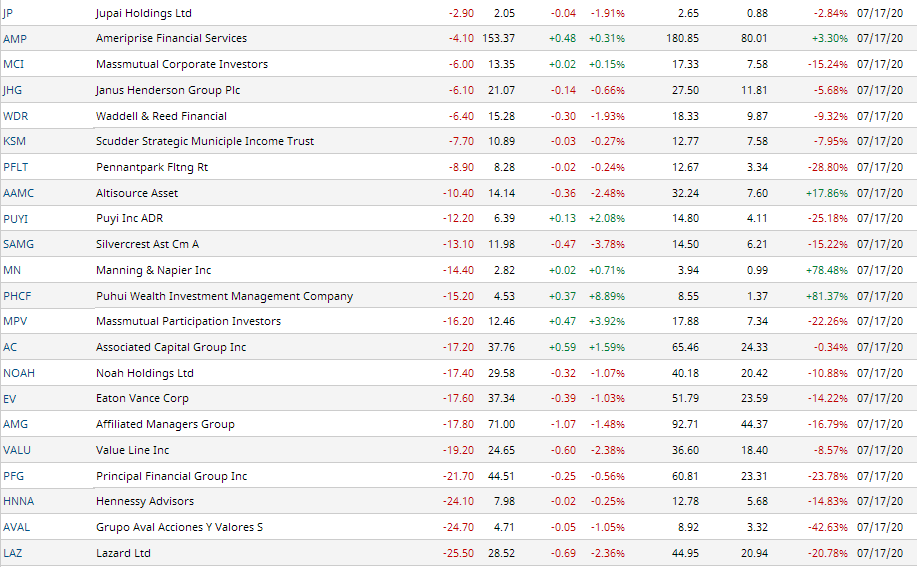
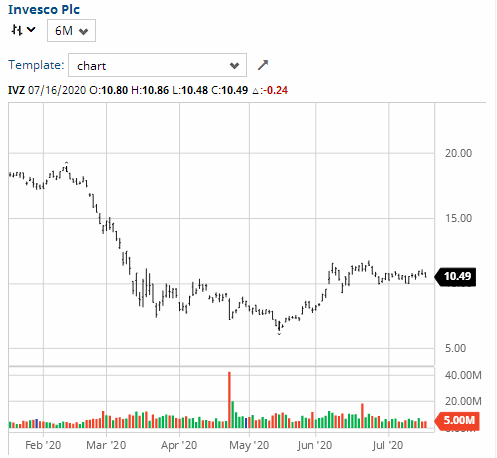
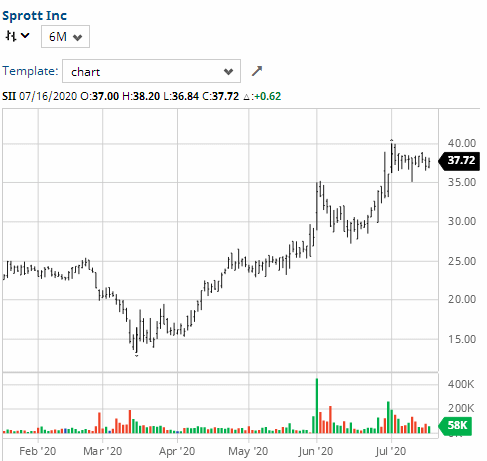
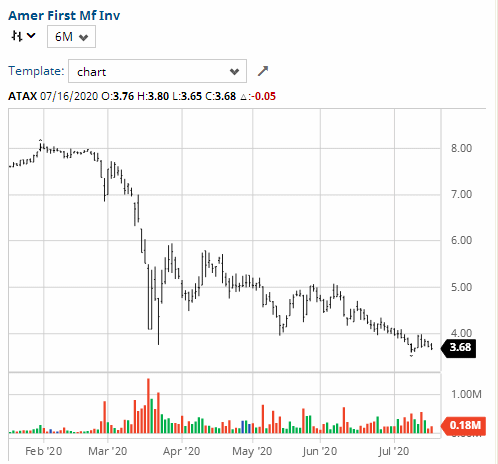
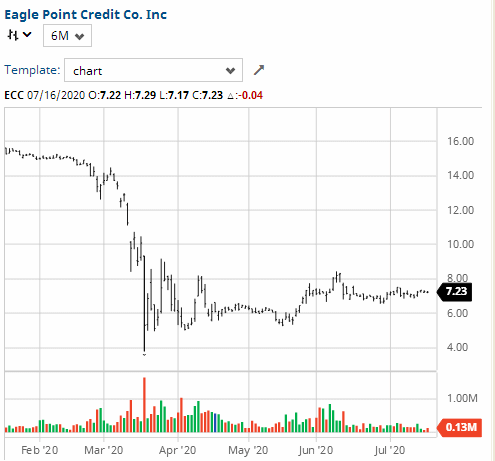
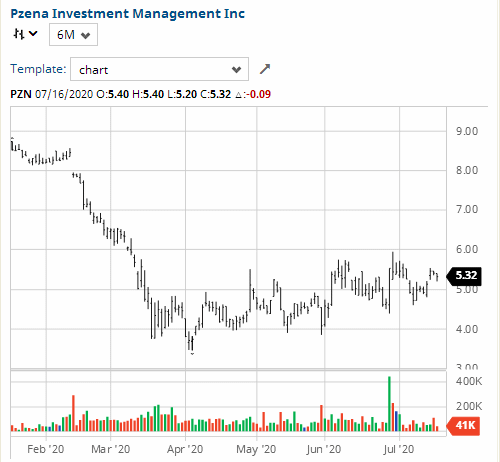
Similar Companies Performance:
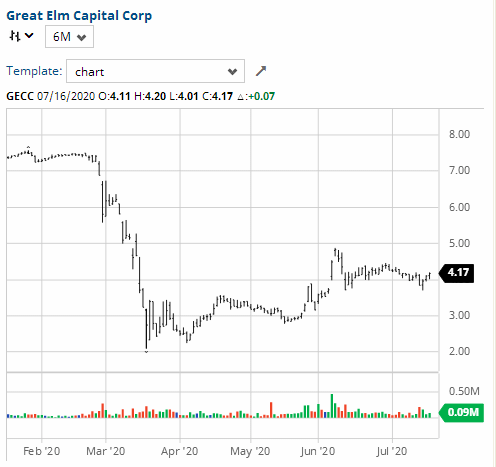
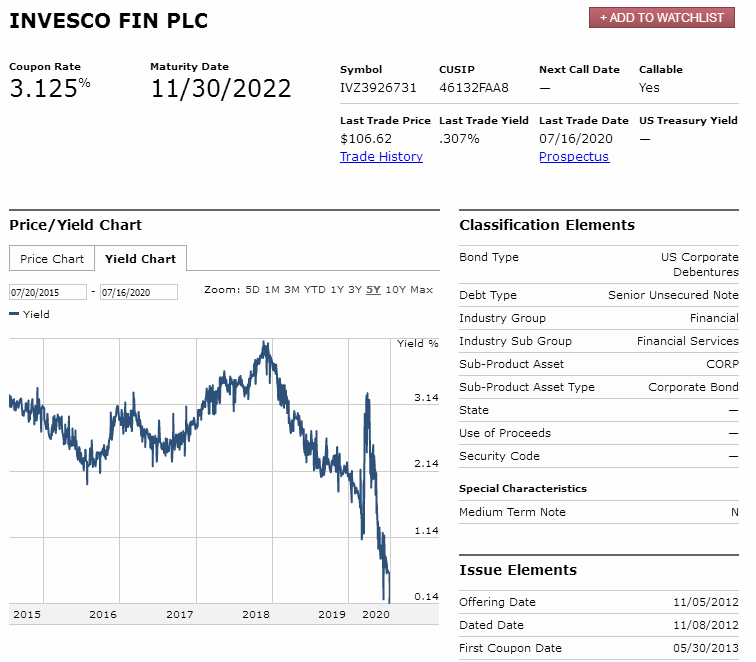
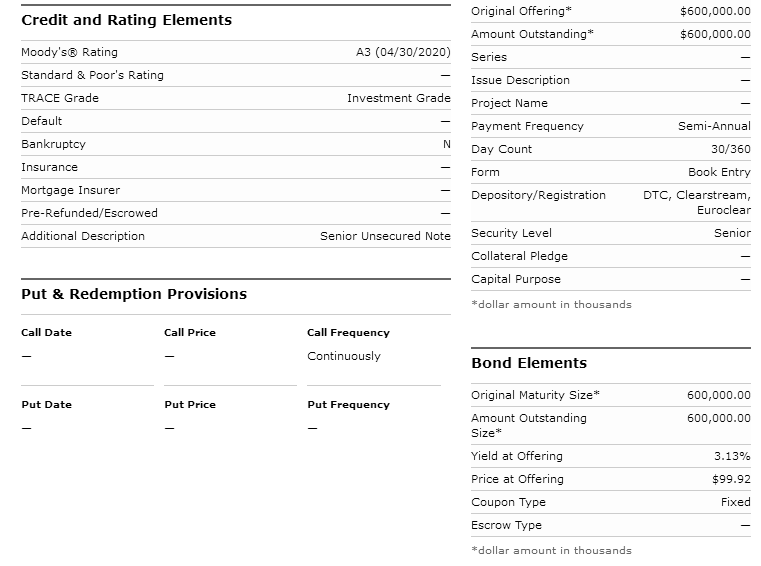
Bond Issue |
Zenith Index |
Under current market conditions, a Zenith Index Score of 1.20 or above is required for a positive rating on this factor. 1.21 -1.30 is considered acceptable, 1.30-1.40 is considered strong and
> 1.40 is considered exceptionally strong. Accounting statements in this section often contain mistakes, especially in earlier years' totals, but data is deemed sufficient for us to give a rating. More accurate financial statements follow in the next section.
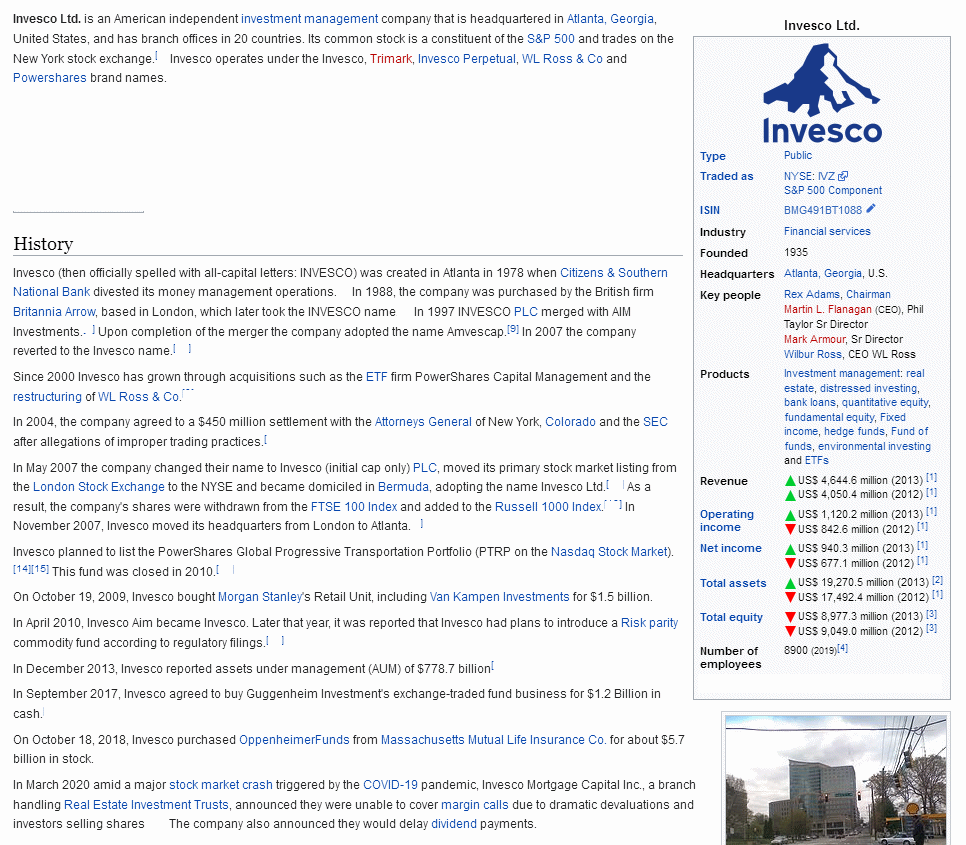
IVZ Invesco Ltd.
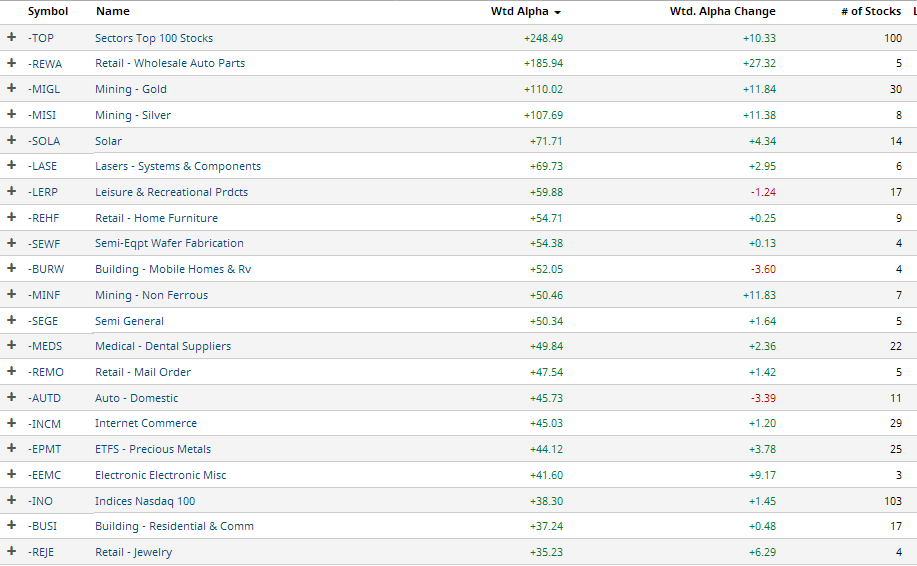
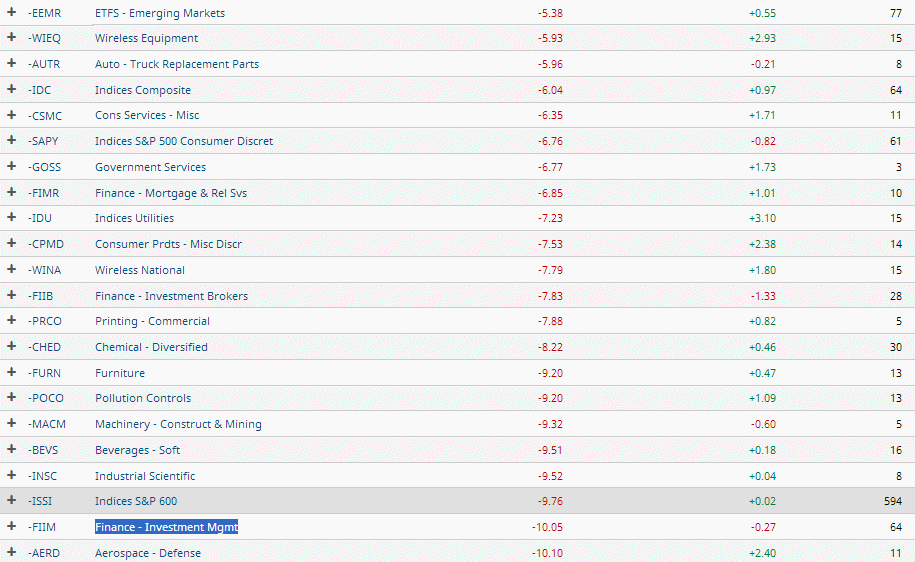
Exchange: NYSE Group: Investment Manage Industry: Financial
Rank of Industry: 7 Rank within Industry: 18 out of 251
Shares Out: 458.89 (mil.) Market Capitalization:$ 4,813.81 (mil.)
Sales (12 mo.): $ 6,117.00 (mil.) Sales Growth: 31.64%
Avg Broker Recommend (1=Strong Buy): 3.31 Consensus Target: 10.70
Dividend:$ 0.62 Yield: 5.91% Payout Ratio: 0.53 Payout Chg: 0.00%
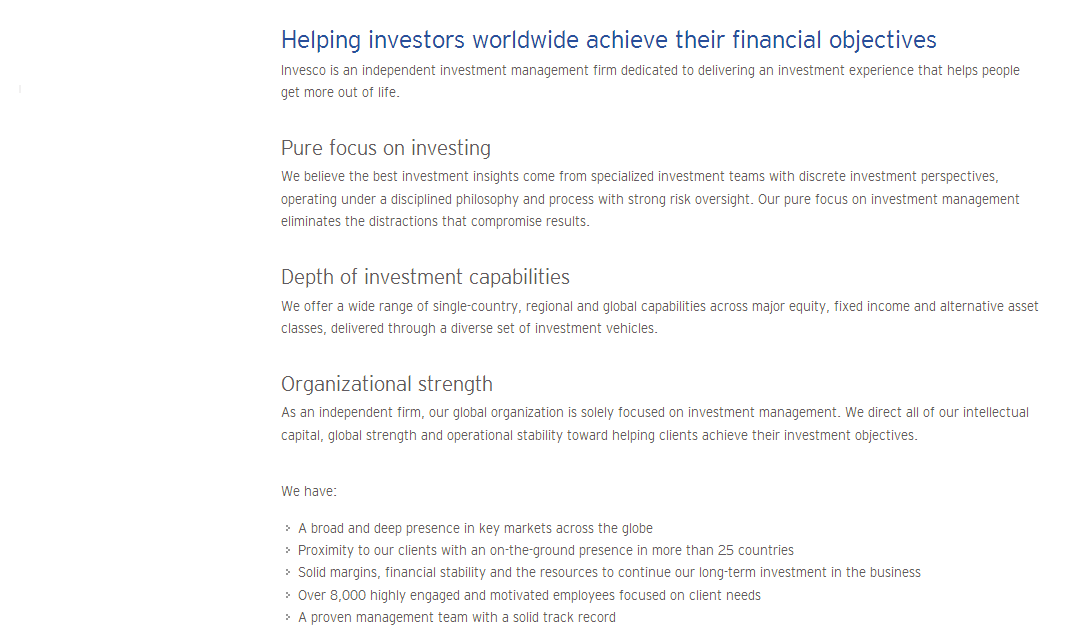
Headquartered in Atlanta, GA, Invesco Ltd., G�� formerly AMVESCAP PLC G��
operates as an independent investment manager and offers a wide range of
investment products and services. The company was incepted in 1935. As
of Mar 31, 2020, Invesco had offices in more than 20 countries and AUM
With the support of a global operating platform, Invesco distributes a
broad range of investment products and services. InvescoG��s asset classes
Recent Price: 10.49 52-Week High: 20.33 52-Week Low: 6.38
20-Day Avg. Daily Volume = 6,918,599 Beta: 1.48
Earnings per Share (EPS) Estimates:
This Next This Next
Quarter Quarter Year Year
06/2020 09/2020 12/2020 12/2021
Average Estimate 0.45 0.47 1.74 1.88
Number of Estimates 6 5 7 7
Low Estimate 0.32 0.36 1.36 1.45
High Estimate 0.47 0.47 1.74 1.88
Year Ago EPS 0.65 0.70 2.55 1.59
EPS Growth -35.38% -40.00% -37.65% 7.09%
P/E Ratio Related Data: EPS Sales
Current FY Estimate: 4.50 Growth Growth
Trailing 12 Months: 6.58 vs. Previous Quarter: -46.88% -8.26%
P/E Growth Ratio: 1.11 vs. Previous Year: -39.29% 31.64%
Price/Sales Ratio: 0.74 Price/Book Ratio: 0.48 Price/Cash Flow: 3.34
Other Fundamental Data:
06/30/20 03/31/20 12/31/19
Return on Investment 0.00 11.04 12.00
Return on Assets 0.00 2.92 3.21
Current Ratio 0.00 1.71 1.62
Quick Ratio 1.71 1.71 1.62
Operating Margin 0.00 17.19 19.40
Net Margin 0.00 8.12 10.20
Pre-Tax Margin 0.00 0.00 0.00
Book Value 0.00 0.00 0.00
Inventory Turnover 0.00 0.00 0.00
Debt-to-Equity Ratio 0.00 0.88 0.81
Debt-to-Capital Ratio 0.00 39.06 37.79
Reported and Estimated Quarterly Earnings:
Reported 03/2020 12/2019 09/2019 06/2019
0.34 0.64 0.70 0.65
Estimated 06/2020 09/2020 12/2020 12/2021
Consensus 7 Days Ago 0.42 0.42 1.60 1.72
Upward Revisions 1 0 1 1
Downward Revisions 0 1 1 1
Consensus 30 Days Ago 0.37 0.40 1.50 1.63
Upward Revisions 5 3 4 3
Downward Revisions 0 1 1 2
Annual Income Statements ($mil except EPS data):
12/31/19 12/31/18 12/31/17 12/31/16 12/31/15
Sales 6117.00 5314.00 5160.00 4734.00 5123.00
Cost of Goods 1893.00 1608.00 1487.00 1407.00 1580.00
Gross Profit 4224.00 3706.00 3674.00 3327.00 3543.00
Selling, Deprec, Amort Expense 3416.00 2501.00 2397.00 2151.00 2185.00
Income After Deprec + Amortization 808.00 1205.00 1277.00 1176.00 1358.00
Non-Operating Income 300.00 45.00 247.00 124.00 274.00
Interest Expense 136.00 112.00 95.00 93.00 271.00
Pretax Income 973.00 1138.00 1429.00 1207.00 1362.00
Income Taxes 235.00 255.00 268.00 338.00 398.00
Minority Interest 50.00 0.00 34.00 14.00 -4.00
Investment Gains/Losses 0.00 0.00 0.00 0.00 0.00
Other Income/Charges 0.00 0.00 0.00 0.00 0.00
Income from Continuing Operations 738.00 883.00 1161.00 868.00 964.00
Extras + Discontined Operations 0.00 0.00 0.00 0.00 0.00
Net Income 0.00 883.00 0.00 1.00 854.00
Income before Depr. + Amortization 986.00 1347.00 1394.00 1278.00 1452.00
Depreciation + Amort. (Cash Flow) 384.00 396.00 243.00 284.00 167.00
Average Shares 440.50 412.50 409.90 415.00 428.36
Diluted EPS bf Non-Recurring Items 2.55 2.43 2.70 2.23 2.44
Diluted Net EPS 1.28 2.14 2.75 2.06 2.26
Balance Sheets ($mil. except per share data):
12/31/19 12/31/18 12/31/17 12/31/16 12/31/15
Assets:
Cash + Equivalents 0.00 1.00 1.00 2.00 2.00
Receivables 1191.00 906.00 1548.00 1323.00 1268.00
Notes Receivable 8638.00 17598.00 6333.00 5911.00 7035.00
Inventories 0.00 0.00 0.00 0.00 0.00
Other Current Assets 10980.00 127.00 12569.00 8341.00 6492.00
Total Current Assets 22510.00 20437.00 22967.00 17646.00 17010.00
Property, Plant & Equipment 584.00 469.00 491.00 465.00 427.00
Investments + Advances 0.00 614.00 0.00 0.00 0.00
Other Non-Current Assets 0.00 0.00 0.00 0.00 0.00
Deferred Charges 0.00 0.00 0.00 0.00 0.00
Intangibles 15868.00 9333.00 8149.00 7529.00 7530.00
Deposits + Other Assets 460.00 126.00 62.00 95.00 107.00
Total Assets 0.00 39.00 30.00 31.00 25.00
12/31/19 12/31/18 12/31/17 12/31/16 12/31/15
Liabilities:
Notes Payable 0.00 0.00 0.00 0.00 0.00
Accounts Payable 12894.00 12651.00 14124.00 9696.00 7477.00
Current Portion Long-Term Debt 0.00 0.00 0.00 0.00 0.00
Current Portion Capital Leases 0.00 0.00 0.00 0.00 0.00
Accrued Expenses 1031.00 647.00 696.00 654.00 661.00
Income Taxes Payable 0.00 0.00 0.00 0.00 0.00
Other Current Liabilities 0.00 0.00 0.00 0.00 0.00
Total Current Liabilities 13925.00 13297.00 14820.00 10350.00 8138.00
Mortgages 0.00 0.00 0.00 0.00 0.00
Deferred Income Taxes 1530.00 326.00 276.00 310.00 289.00
Convertible Debt 0.00 0.00 0.00 0.00 0.00
Long-Term Debt 8315.00 7635.00 6876.00 6506.00 7510.00
Non-Current Capital Leases 0.00 0.00 0.00 0.00 0.00
Other Non-Current Liabilities 950.00 388.00 499.00 673.00 274.00
Minority Interest 0.00 0.00 0.00 0.00 0.00
Total Liabilities 0.00 25.00 22.00 22.00 18.00
12/31/19 12/31/18 12/31/17 12/31/16 12/31/15
Shareholder Equity:
Preferred Stock 4011.00 0.00 0.00 0.00 0.00
Common Sock 113.00 98.00 98.00 98.00 98.00
Capital Surplus 7861.00 6335.00 6282.00 6227.00 6198.00
Retained Earnings 5918.00 5885.00 5489.00 4833.00 4440.00
Other Equity -132.00 -378.00 -132.00 -701.00 364.00
Treasury Stock 3453.00 3004.00 2782.00 2846.00 2404.00
Total Shareholder Equity 10308.00 8936.00 8956.00 7612.00 8696.00
Total Liabilities+ Owners' Equity 39420.00 30978.00 31669.00 25734.00 25073.00
Total Common Equity 0.00 0.00 0.00 0.00 0.00
Shares Outstanding 453.30 397.10 407.10 408.50 417.50
Book Value per Share 0.00 0.00 0.00 0.00 0.00
Cash Flow Statement:
Operations, Investments, & Financial Activities
12/31/19 12/31/18 12/31/17 12/31/16 12/31/15
Net Income 0.00 737.80 883.10 1.00 868.30
Depreciation/Amortization + Deplet 177.60 142.10 116.80 101.20 93.60
Net Change in Assets/Liab. -28.00 -393.80 -95.00 -984.90 -18.40
Net Cash f Discontinued Operations 0.00 0.00 0.00 0.00 0.00
Other Operating Activities 229.20 197.40 187.90 144.70 14.20
Net Cash f Operating Activities 0.00 1.00 828.80 1.00 129.30
Property + Equipment -124.30 -102.50 -111.70 -147.70 -124.50
Acquisition/Disp. of Subsidiaries 290.50 -1469.30 -299.20 -121.90 0.00
Investments -1617.60 -1263.10 -550.20 -721.00 -540.30
Other Investing Activity 26.00 -63.80 0.00 0.00 0.00
Net Cash from Investing -1425.40 -2898.70 -961.10 -990.60 -664.80
Use of Funds
12/31/19 12/31/18 12/31/17 12/31/16 12/31/15
Issue (Repurchase) Capital Stock -469.80 -51.80 -63.80 -535.00 -545.10
Issuance (Repayment) of Debt 1529.20 1418.40 402.30 1156.40 1014.20
Increase/Decrease Short-Term Debt -330.80 330.80 -28.70 28.70 0.00
Dividends + Distributions 0.00 0.00 0.00 0.00 0.00
Other Financing Acitivies 125.40 333.20 330.80 280.40 8.70
Net Cash from Financing 201.30 1540.00 169.00 470.10 23.30
Effect of Exchange Rate Changes 3.30 -182.40 99.80 -132.20 -74.80
Net Change in Cash + Equivalents -104.20 -712.30 678.40 -523.40 337.20
Net Change in Cash & Equivalents
12/31/19 12/31/18 12/31/17 12/31/16 12/31/15
Cash at Beginning of Per. 1805.40 2517.70 1328.00 1851.40 1514.20
Cash at End of Period 1701.20 1805.40 2006.40 1328.00 1851.40
Net Change in Cash + Equivalents -104.20 -712.30 678.40 -523.40 337.20
Zenith Indices: [Indices near +3.0, or near zero,
or < zero bear special attention.]
P/E Ratio Tests:
Current P/E Ratio < 28? 3.0000 P/E Ratio > 5? 1.0000
P/E Ratio Vs Growth Rate: -3.0000 Forward P/E Ratio < 28? 3.0000
Sales Tests:
Sales < $500 mil.? 0.0941 Sales incr. 25% Yearly? 1.2656
Sales > $340 million? 3.0000 Inventory/Sales < 5%? 1.0000
Balance Sheet Tests:
Debt/Equity Ratio < 0.40? 0.4545 LTD/Net Assets: 0.0051
Debt Reduction: 0.8521 Intangibles/Assets < 10%? 0.0004
Current Ratio > 2? 1.7100 Return on Equity > 9.8%? 1.1265
Earnings Tests:
EPS 5-Yr. Growth > 18%? 0.2950 Operating Margin > 5%? 0.2909
EPS Annual Growth > 0%? -3.0000 Dividend Rate cp 2.7%: 2.1889
Earnings Consistent? 1.0000 Payout Ratio Decreasing? 0.0883
Net Income Increasing 25%? 0.0000 Price<15% below 52-wk Hi? 0.5934
Positive Cash Flow? 0.8998 Price/Book X PE < 22? 3.0000
Profit Margin > 7.5%? 1.0827 Price/Book < 1.6? 3.0000
Profit Margin Increasing? 0.7961 Stock Compared to S+P 500: 3.0000
Price & Float Tests:
Return on Investment>12%? 0.6494 Shares Out > 50 mil.? 3.0000
Return on Assets > 10%? 0.2675 Beta > 1.25?: 1.4800
Price/Sales Ratio < 2.3? 1.2000 Liquidity > 2%? 3.0000
Ownership Tests:
Analyst Following > 2.0? 0.9063 Market Capital'n > 300M? 3.0000
Owner's Equity Increasing? 1.0276 Shares Out Decreasing? 1.0514
IVZ Overall Zenith Index: 1.2439
Financial Statements |
INVESCO LTD (IVZ) INCOME STATEMENT Fiscal year ends in December. USD in thousand 2015-12 2016-12 2017-12 2018-12 2019-12 TTM Revenue 5,122,900 4,734,400 5,160,300 5,314,100 6,117,400 6,501,700 Cost of revenue 1,395,500 1,378,800 1,537,400 1,494,400 1,709,300 1,749,900 Gross profit 3,727,400 3,355,600 3,622,900 3,819,700 4,408,100 4,751,800 Operating expenses Sales, General and administrative 2,369,000 2,179,200 2,345,800 2,477,900 2,926,900 3,124,400 Restructuring, merger and acquisition 0 0 0 136,000 680,800 710,200 Other operating expenses 0 0 0 -136,000 -680,800 -710,200 Total operating expenses 2,369,000 2,179,200 2,345,800 2,477,900 2,926,900 3,124,400 Operating income 1,358,400 1,176,400 1,277,100 1,341,800 1,481,200 1,627,400 Interest Expense 270,600 93,400 94,800 111,500 135,700 138,900 Other income (expense) 274,300 123,600 246,900 -92,200 -372,600 -595,000 Income before taxes 1,362,100 1,206,600 1,429,200 1,138,100 972,900 893,500 Provision for income taxes 398,000 338,300 268,200 255,000 235,100 226,300 Net income from continuing operations 964,100 868,300 1,161,000 883,100 737,800 667,200 Other 4,000 -14,100 -33,700 -300 -49,500 -15,900 Net income 968,100 854,200 1,127,300 882,800 688,300 651,300 Preferred dividend 24,600 24,800 33,700 26,900 123,600 182,800 Net income available to common shareholders 943,500 829,400 1,093,600 855,900 564,700 468,500 Earnings per share Basic 2.26 2.06 2.75 2.14 1.29 1.03 Diluted 2.26 2.06 2.75 2.14 1.28 1.02 Weighted average shares outstanding Basic 418,000 402,600 397,200 399,800 437,800 451,325 Diluted 418,400 402,900 397,700 399,900 440,500 454,750 ____________________________________________________________________________________________________________________________________________ INVESCO LTD (IVZ) BALANCE SHEET Fiscal year ends in December. USD in thousand 2015-12 2016-12 2017-12 2018-12 2019-12 Assets Current assets Cash Short-term investments 319,100 0 0 0 0 Total cash 2,533,800 2,070,200 2,517,700 1,805,400 1,701,200 Receivables 701,600 650,400 754,000 714,800 1,028,500 Prepaid expenses 6,172,700 8,341,100 12,568,900 11,511,900 144,000 Other current assets 566,300 672,900 793,800 191,300 162,700 Total current assets 9,974,400 11,734,600 16,634,400 14,223,400 3,036,400 Non-current assets Property, plant and equipment Gross property, plant and equipment 1,030,000 1,105,800 1,219,600 1,273,500 1,502,700 Accumulated Depreciation -603,100 -641,100 -728,900 -804,800 -919,200 Net property, plant and equipment 426,900 464,700 490,700 468,700 583,500 Equity and other investments 7,035,200 5,911,400 6,332,600 6,827,000 8,637,500 Goodwill 6,175,700 6,129,200 6,590,700 7,157,100 8,509,400 Intangible assets 1,354,100 1,399,400 1,558,700 2,176,100 7,358,300 Other long-term assets 106,900 95,000 61,700 126,100 11,295,200 Total non-current assets 15,098,800 13,999,700 15,034,400 16,755,000 36,383,900 Total assets 25,073,200 25,734,300 31,668,800 30,978,400 39,420,300 Liabilities and stockholders' equity Liabilities Current liabilities Accounts payable 302,600 274,300 320,100 284,300 414,600 Taxes payable 78,800 91,600 155,500 43,200 118,200 Accrued liabilities 328,600 280,600 302,300 360,400 403,900 Other current liabilities 7,343,900 9,625,500 13,984,800 12,568,400 12,562,800 Total current liabilities 8,053,900 10,272,000 14,762,700 13,256,300 13,499,500 Non-current liabilities Long-term debt 7,509,800 6,505,500 6,875,600 7,634,800 8,314,900 Capital leases 0 0 0 0 364,800 Deferred taxes liabilities 288,900 309,700 275,500 326,400 1,529,500 Minority interest 810,400 108,000 259,500 357,400 455,800 Other long-term liabilities 524,900 1,035,300 799,400 824,700 1,393,300 Total non-current liabilities 9,134,000 7,958,500 8,210,000 9,143,300 12,058,300 Total liabilities 17,187,900 18,230,500 22,972,700 22,399,600 25,557,800 Stockholders' equity Preferred stock 0 0 0 0 4,010,500 Common stock 98,100 98,100 98,100 98,100 113,200 Additional paid-in capital 6,197,700 6,227,400 6,282,000 6,334,800 7,860,800 Retained earnings 4,439,600 4,833,400 5,489,100 5,884,500 5,917,800 Treasury stock -2,404,100 -2,845,800 -2,781,900 -3,003,600 -3,452,500 Accumulated other comprehensive income -446,000 -809,300 -391,200 -735,000 -587,300 Total stockholders' equity 7,885,300 7,503,800 8,696,100 8,578,800 13,862,500 Total liabilities and stockholders' equity 25,073,200 25,734,300 31,668,800 30,978,400 39,420,300 ____________________________________________________________________________________________________________________________________________ INVESCO LTD (IVZ) Statement of CASH FLOW Fiscal year ends in December. USD in thousand 2015-12 2016-12 2017-12 2018-12 2019-12 TTM Cash Flows From Operating Activities Net income 964,100 868,300 1,161,000 883,100 737,800 667,200 Depreciation & amortization 93,600 101,200 116,800 142,100 177,600 189,700 Stock based compensation 150,300 159,700 175,300 172,400 207,500 205,100 Change in working capital -177,400 -490,700 422,400 -53,100 185,400 -19,400 Other working capital -177,400 -490,700 422,400 -53,100 185,400 -19,400 Other non-cash items 22,900 -509,200 -504,800 -315,700 -191,700 117,400 Net cash provided by operating activities 1,053,500 129,300 1,370,700 828,800 1,116,600 1,160,000 Cash Flows From Investing Activities Investments in property, plant, and equipmen -124,500 -147,700 -111,700 -102,500 -124,300 -122,400 Acquisitions, net 0 -121,900 -299,200 -1,469,300 290,500 0 Purchases of investments -4,820,900 -3,864,900 -5,886,800 -4,641,800 -5,473,900 -6,280,600 Sales/Maturities of investments 4,230,100 3,105,300 5,203,800 3,333,200 3,778,200 4,593,200 Other investing activities 50,500 38,600 132,800 -18,300 104,100 265,800 Net cash used for investing activities -664,800 -990,600 -961,100 -2,898,700 -1,425,400 -1,544,000 Cash Flows From Financing Activities Debt issued 2,587,300 1,327,900 2,812,400 2,463,800 3,348,800 4,321,400 Debt repayment -1,573,100 -142,800 -2,438,800 -714,600 -2,150,400 -2,608,100 Common stock repurchased -548,800 -535,000 -63,800 -51,800 -469,800 -422,700 Dividend paid -454,500 -460,400 -471,600 -490,600 -652,700 -732,700 Other financing activities 12,400 280,400 330,800 333,200 125,400 -173,300 Net cash provided by (used for) financing 23,300 470,100 169,000 1,540,000 201,300 384,600 Effect of exchange rate changes -74,800 -132,200 99,800 -44,800 10,700 -31,600 Net change in cash 337,200 -523,400 678,400 -574,700 -96,800 -31,000 Cash at beginning of period 1,514,200 1,851,400 1,328,000 2,517,700 1,805,400 1,268,300 Cash at end of period 1,851,400 1,328,000 2,006,400 1,943,000 1,708,600 1,237,300 Free Cash Flow Operating cash flow 1,053,500 129,300 1,370,700 828,800 1,116,600 1,160,000 Capital expenditure -124,500 -147,700 -111,700 -102,500 -124,300 -122,400 Free cash flow 929,000 -18,400 1,259,000 726,300 992,300 1,037,600 ____________________________________________________________________________________________________________________________________________
Average to Current P/E Ratios |
              (IVZ)     INVESCO Ltd.

                               2015    2016    2017    2018    2019

          Annual Earnings:     2.26    2.06    2.75    2.14    1.28
Average Price During Year:    37.23   30.13   33.08   28.12   18.47

                P/E Ratio:    16.47   14.63   12.03   13.14   14.43

 Average 5-Year P/E Ratio  =  14.14
             Current Price =  10.74

Previous 5 Quarter Earnings:   0.44    0.09    0.36    0.39    0.18

          Current Annualized (Last Four Quarters) Earnings =   0.93
                                                           ________
                                 Average PE / Current PE =     1.22
                                                           --------

                                      ...a number above 1.00 is good
                                                1.00 or below is bad
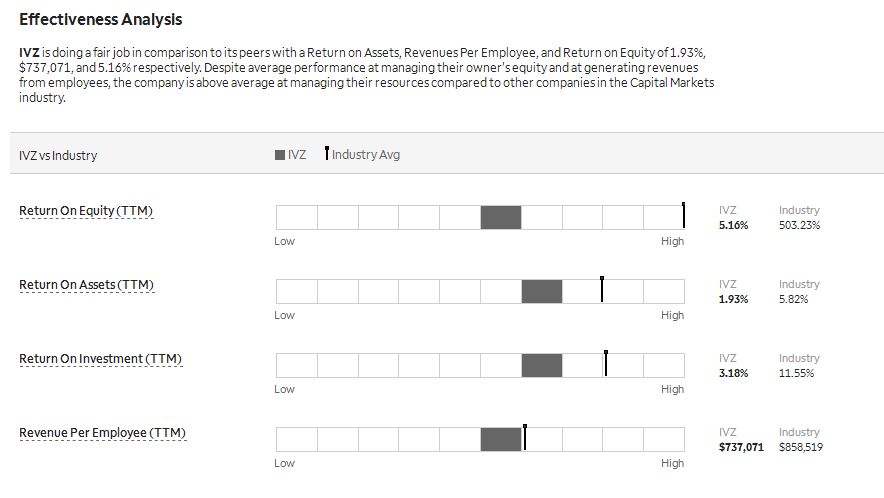
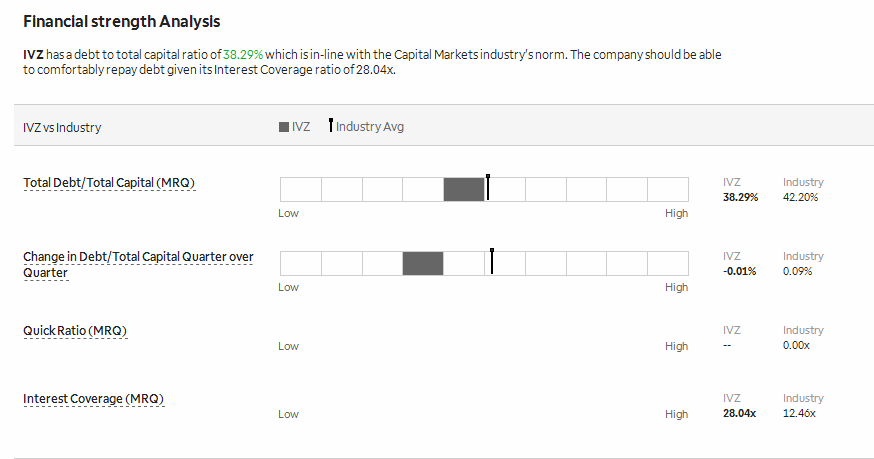
Financial Ratios |
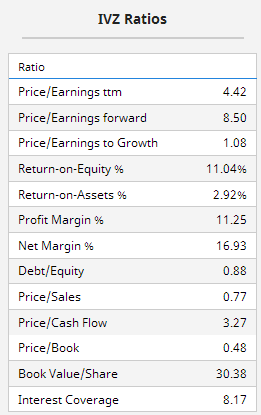
. . . . . . . . . . . . Lowest to Highest, Compared to Industry
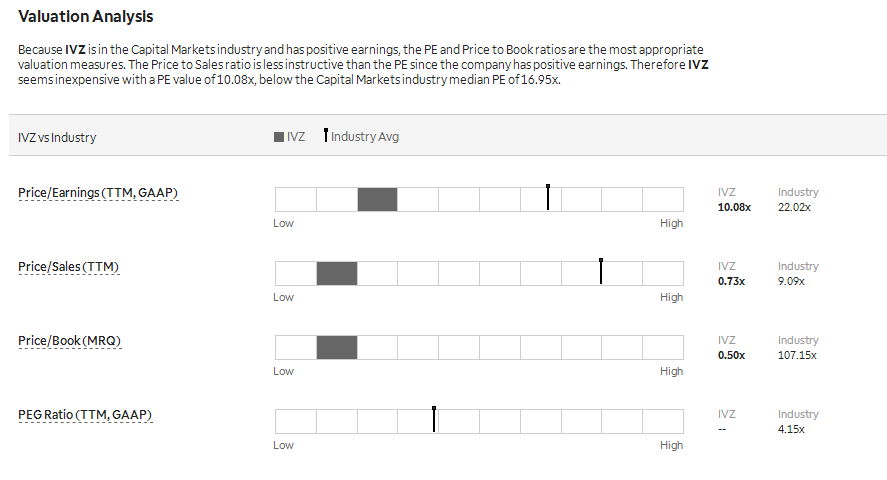
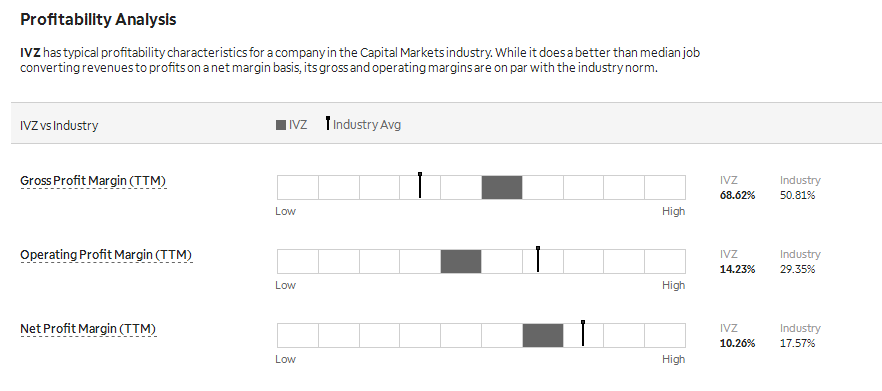
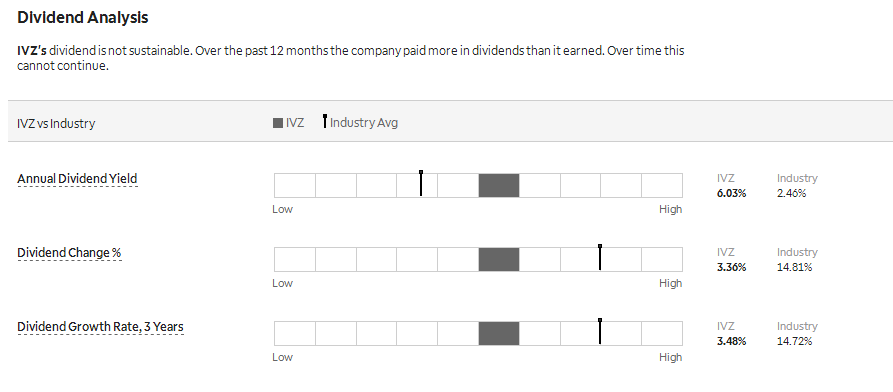
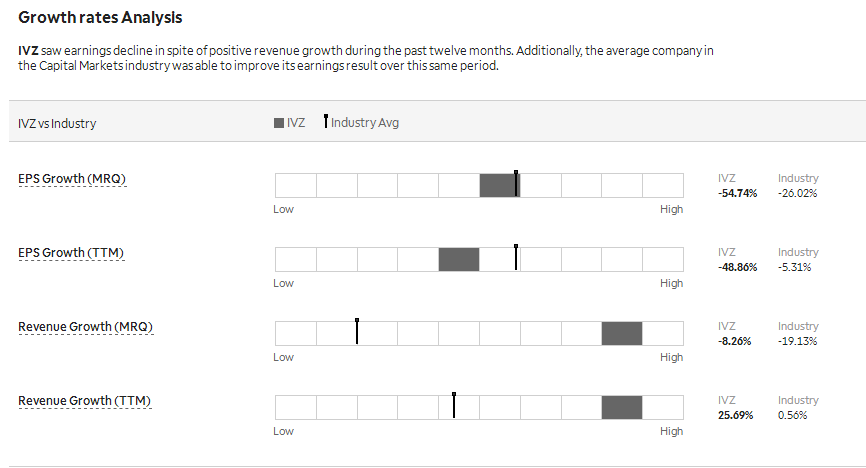
Intrinsic Value (DCF) |
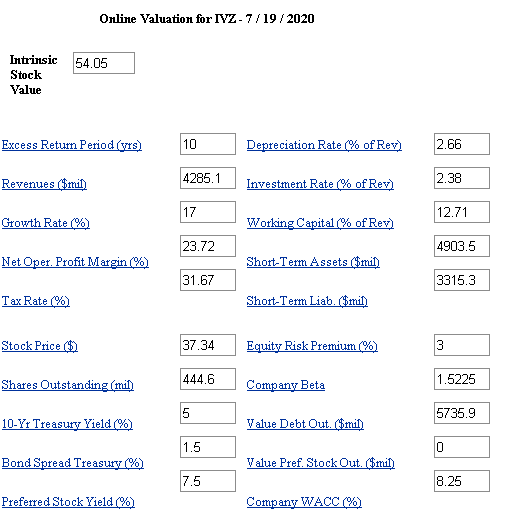
Intrinsic Value by Discounted Cash Flow Method:
Fair Value Estimator |
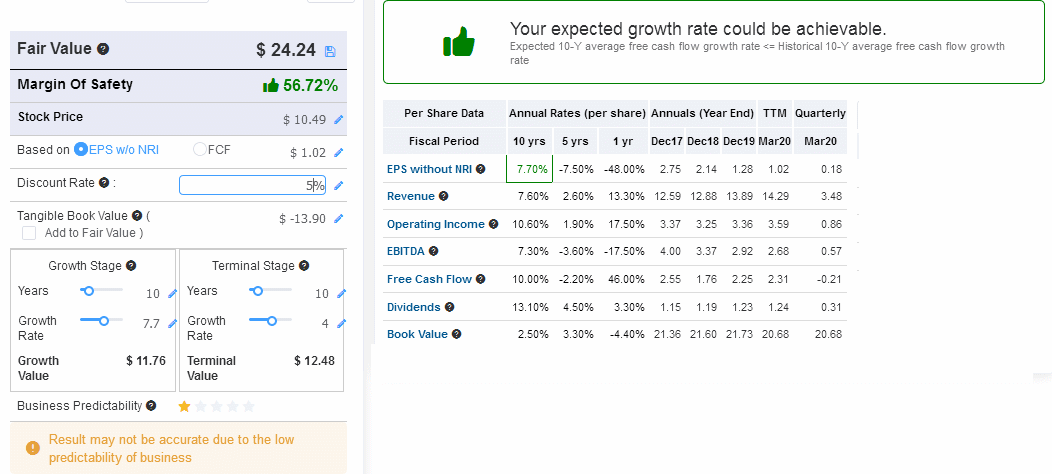
Fair Value Estimate:
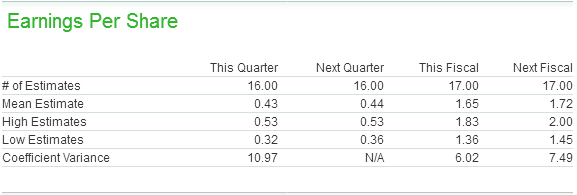
Projected Earnings |
Research Reports |
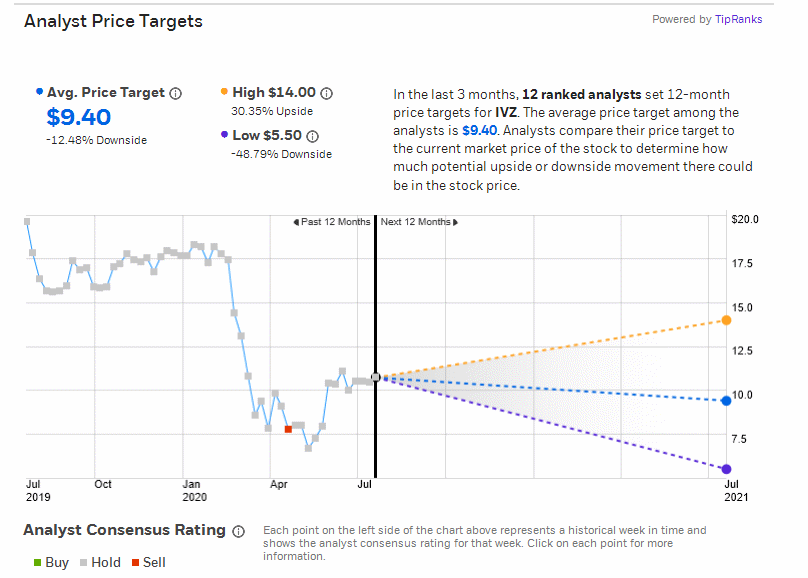
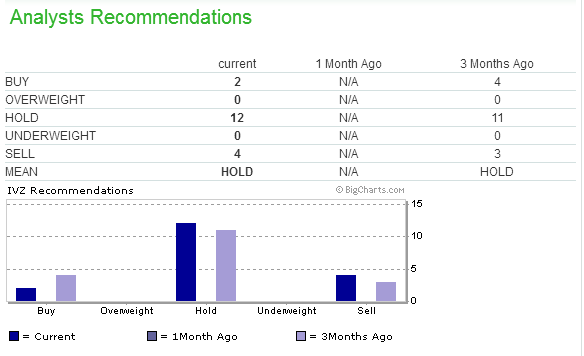
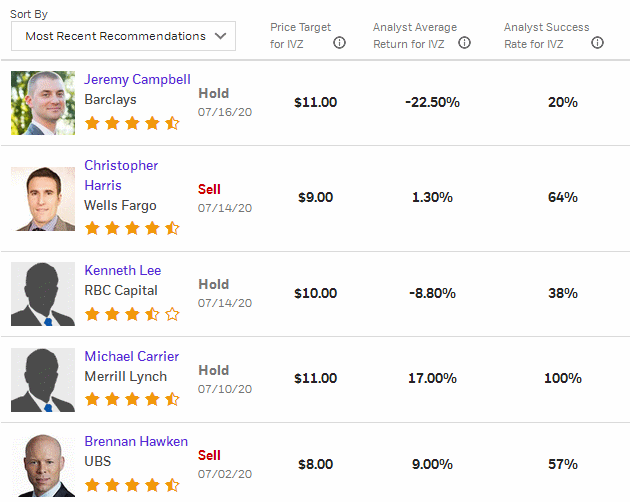
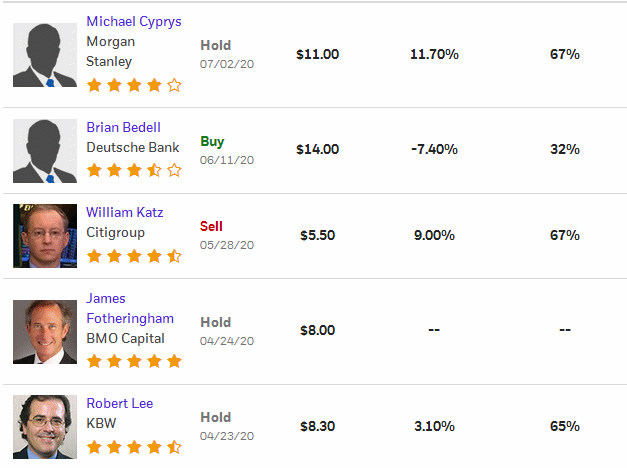
Analysts' Opinions |

Insider Activity |


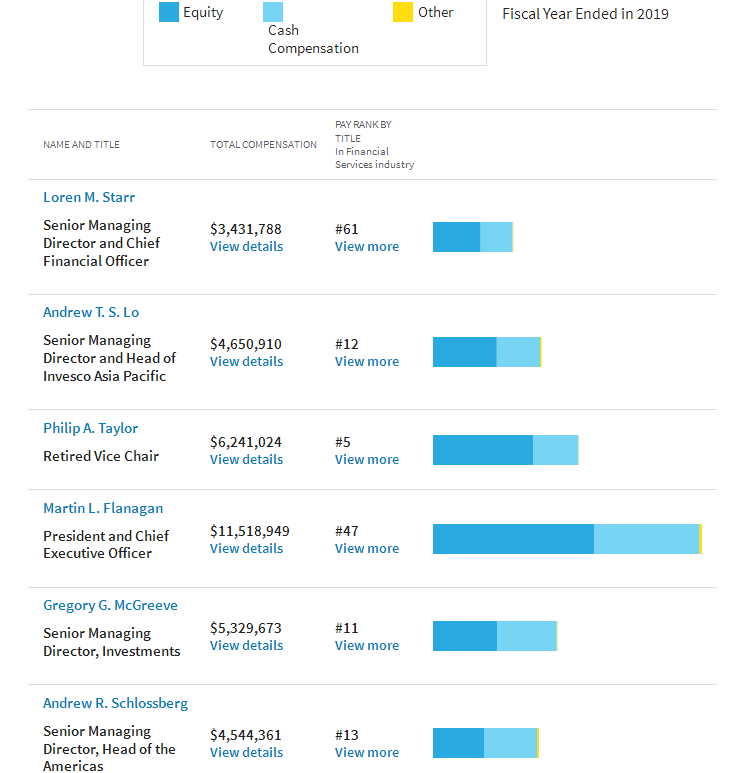
Institutional Activity |
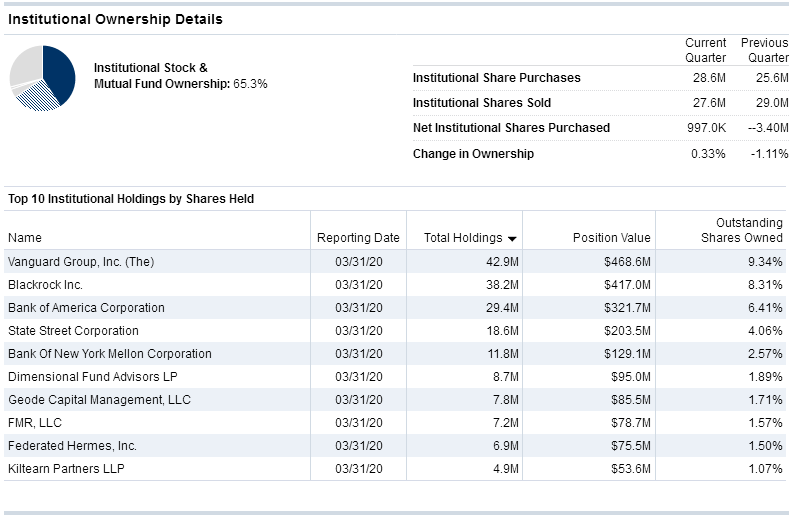
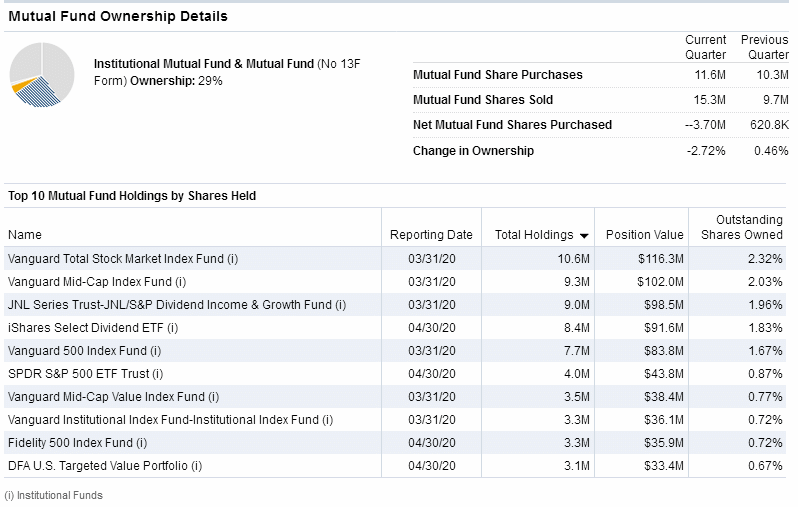
Institutional Ownership:
Sentiment |
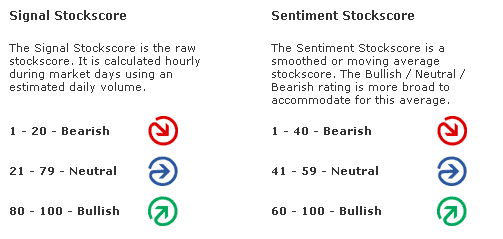
Zenith uses the "sentiment" score above or below 50 to award a positive or negative point in the Decision Matrix.


Short Interest Ratio |
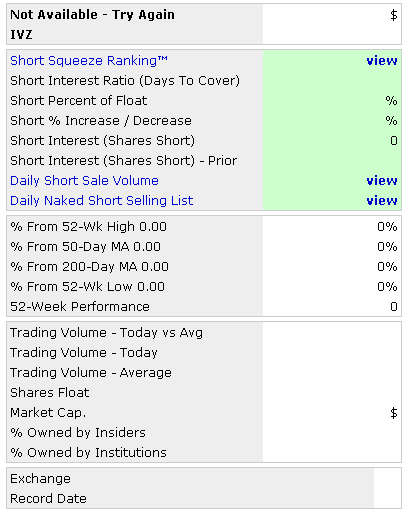
As the short interest rises as a percentage of average daily share volume (Days to Cover), this is considered a measure of negative sentiment. Similarly, a decrease in that percentage is considered positive sentiment.

Standard & Poor's |
Management's Discussion of Results of Operations Excerpts |
Channeling Potential |
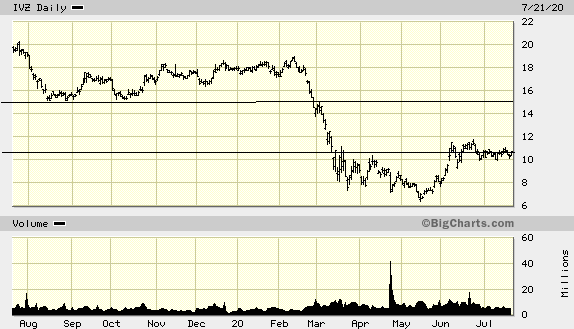
The summary below includes a value for `Degree,' which refers on a
scale of 1 to 10 the range of a channel in the period under consi-
deration compared to the total range of price movement. It also looks
for the last closing price to be within the channel, otherwise zeroed.
The `Index' is the `Degree' weighted for volatility.  Generally, the
the higher the index, the more suitable is the stock for trading as
a `rolling stock' between channel high and low points.

Results for INVESCO LTD.:
Symbol? IVZ
Total Months Available:  25
       Months in Cycle?   4

Months Covered by Periods:  12

Period 1           Period 2          Period 3
   H1      L1        H2      L2        H3      L3
  20.33   15.15     19.01    8.17     11.77    6.38

RANGE   =  20.33  TO    6.38            Close =  10.29
CHANNEL =  15.15  TO   11.77           Degree =   2
Volatility =  32.85%                    Index =   6
MACD Histogram Divergence |
The theory is that connecting the two most recent peaks or valleys of the MACD histogram will signal the direction of the next major move.
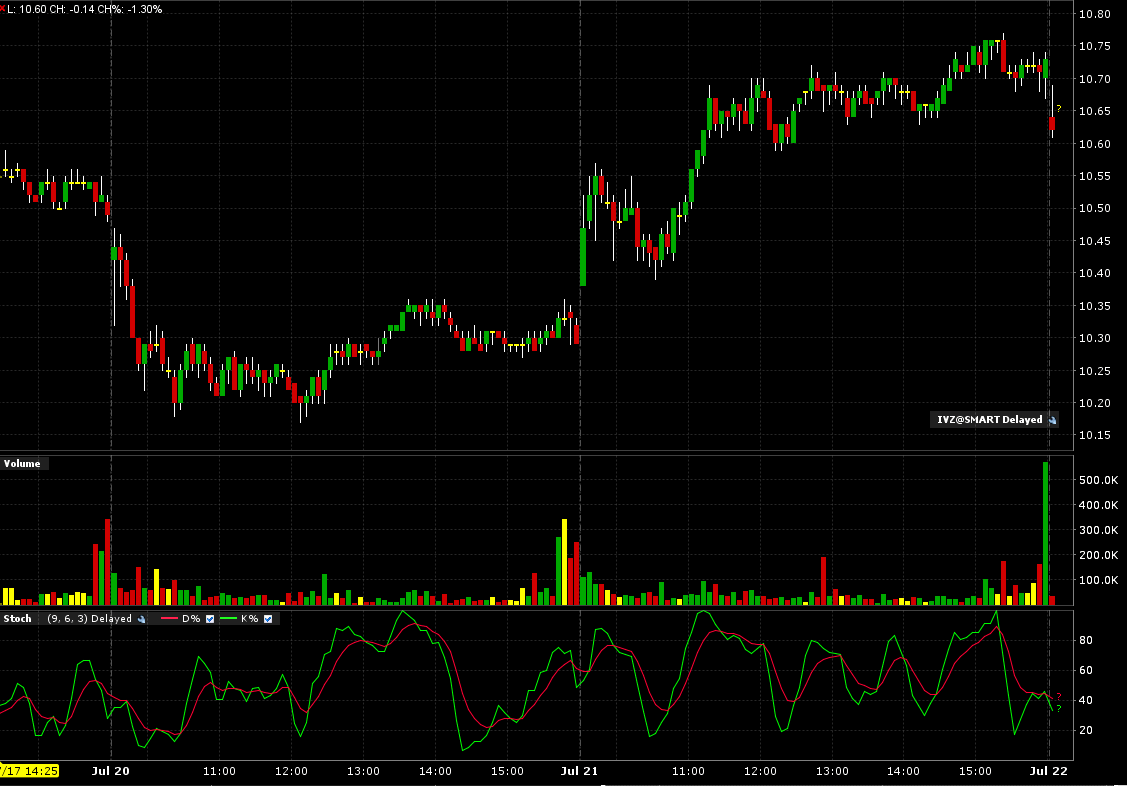
Intraday Chart |
2 Days:
Val Idea |
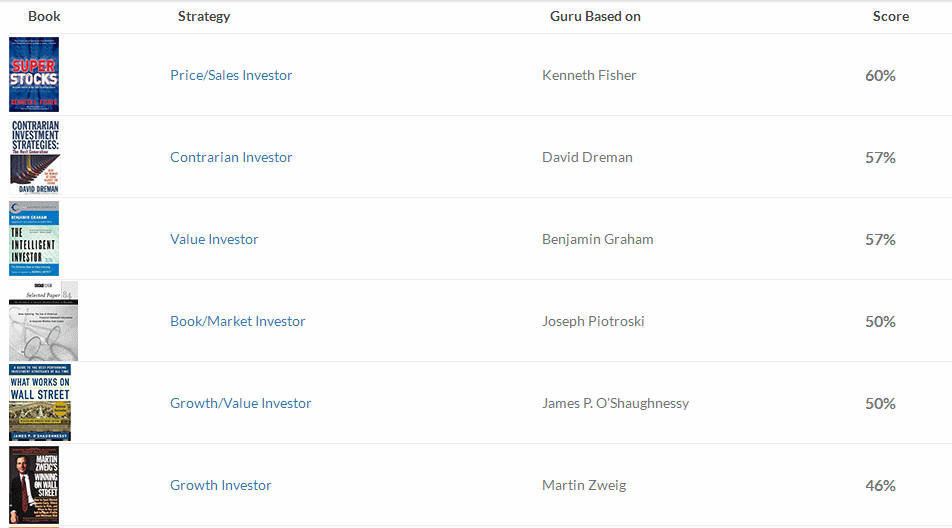
5 out of 9 favorable, (positive opinion.)

Stock Consultant |
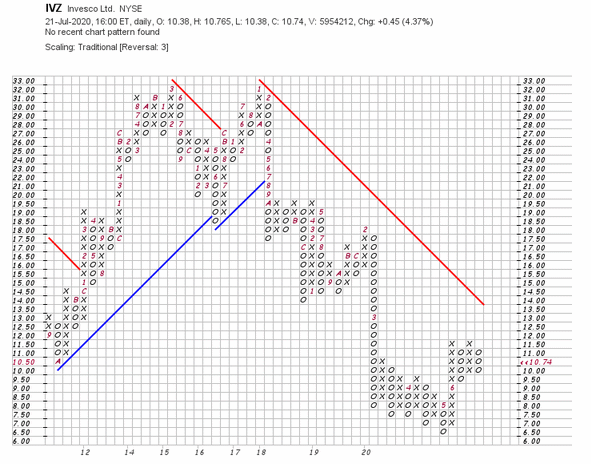
Point & Figure Chart |
Wall Street Analyzer |
Marketspace Chart |
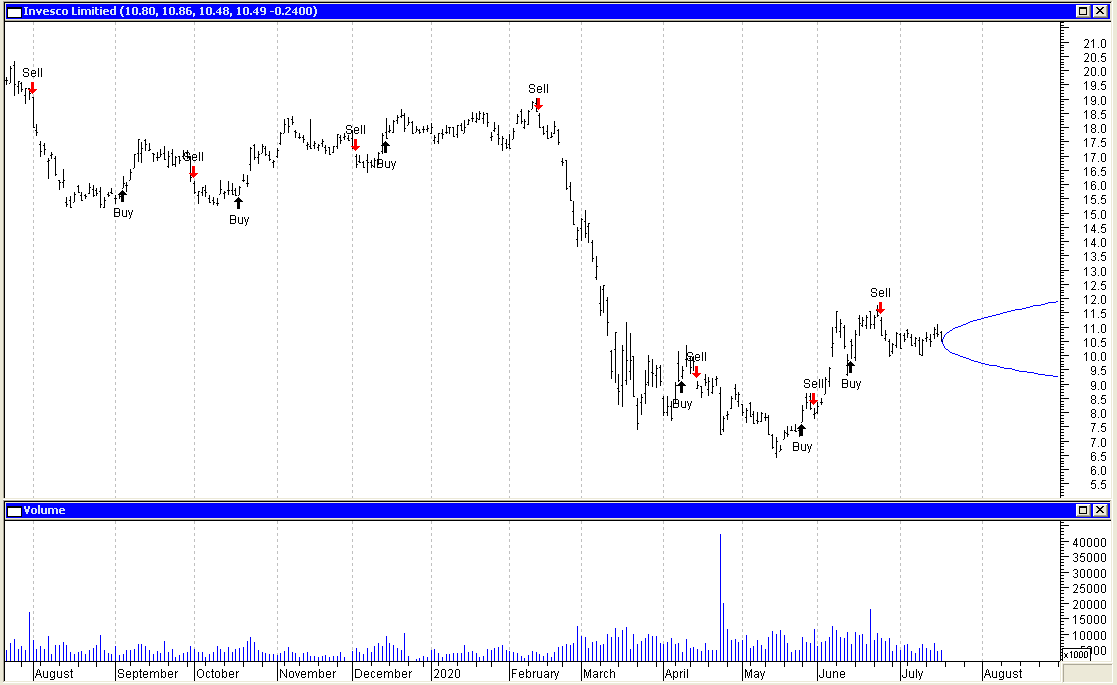
Time Series Forecast |
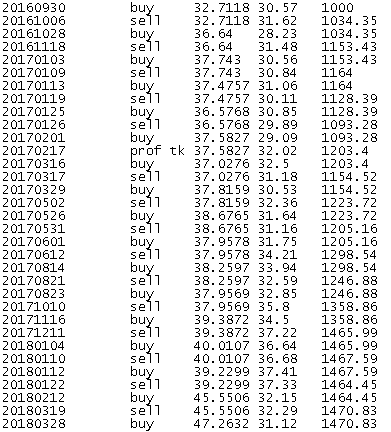
Neural Network Prediction |
"Neurostock" can only track long trades. Therefore its performance, as tracked by itself on stocks which are consistently falling, may not appear as good as it could if each "sell" signal were a "short sale."

![]()

Ultimate Trading Systems |
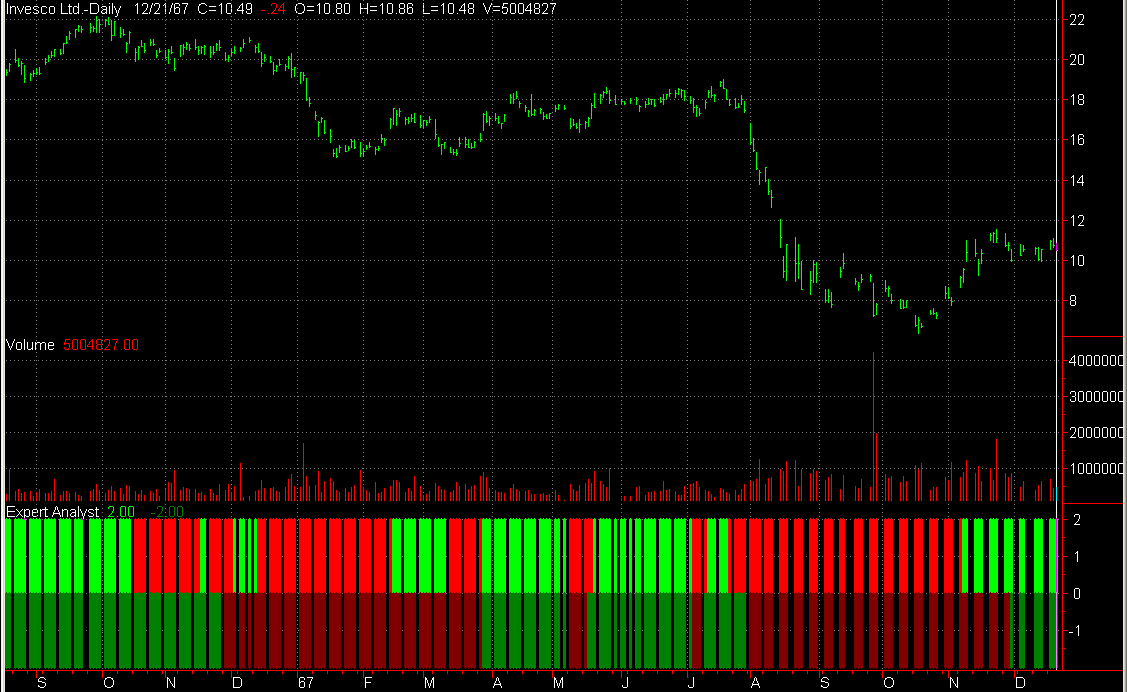
3 out of 3 of the ultimate systems favor an upmove.
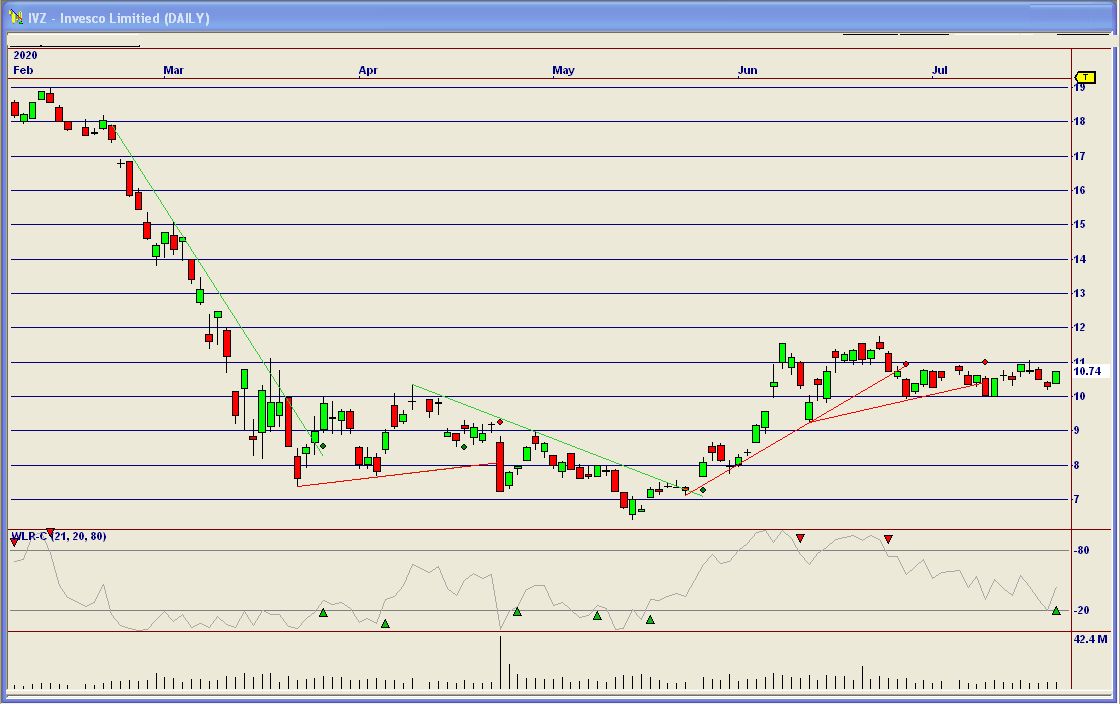
System Below:
Short term outlook: Positive: Bright Green, Negative: Bright Red
Long term outlook: Postive: Dark Green, Negative: Dark Red.

Recommendation |
| Factors | Weighted Points |
|---|---|
| News | - 1 |
| Comparison | + 1 |
| Industry | - 1 |
| Bond Issue | + 1 |
| Zenith Index | + 1 |
| Non-GAAP vs. GAAP Earnings | - 1 |
| Cash Flow | - 1 |
| Average to Current P/E | + 1 |
| Ratios | + 1 |
| Intrinsic Value DCF | + 1 |
| Fair Value Estimator | + 1 |
| Projected Earnings | + 1 |
| Research Reports | - 1 |
| Analysts | - 1 |
| Executive Perquisites | - 1 |
| Insider Activity | + 1 |
| Institutional Activity | + 1 |
| Management Reporting | + 1 |
| Short Interest | - 1 |
| Sentiment | + 1 |
| Standard & Poor's | - 1 |
| MACD Histogram Divergence | + 1 |
| Val Idea | + 1 |
| Stock Consultant | + 1 |
| Point & Figure | + 1 |
| Wall Street Analyzer | + 1 |
| Marketspace Chart | - 1 |
| Time Series Chart | + 1 |
| Neural Network | + 1 |
| Stock Options | + 1 |
| Ultimate Trading Systems | + 1 |
| Total | + 11 |
Place 2,790 shares of Invesco Ltd. (IVZ) on the Active List.