![]()
Corporate Webpages First Solar, Inc.
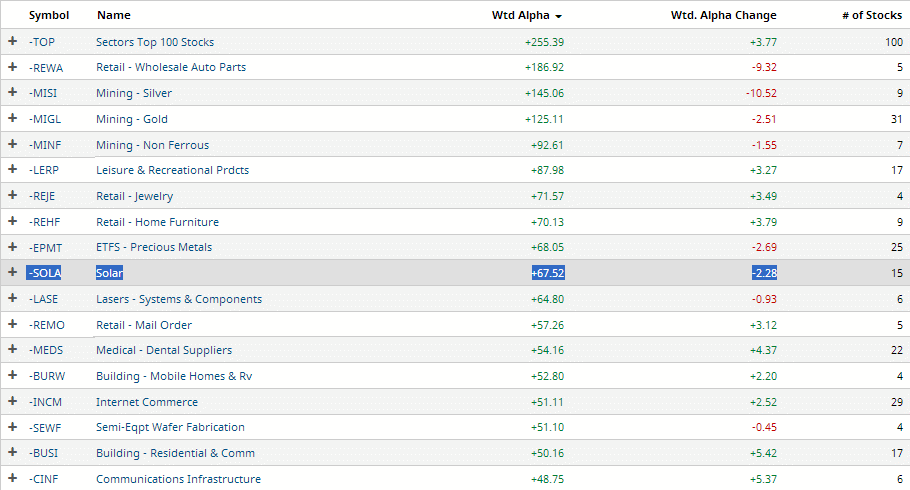
There is a group of semiconductor-like manufacturers that have
their own sector, "solar". Several months back, "solar"
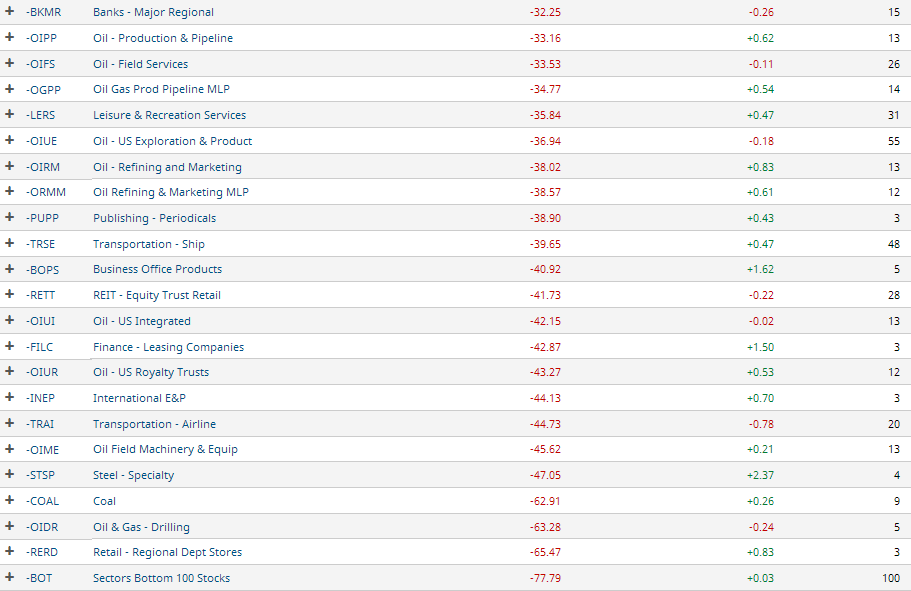
companies were at the bottom of the heap in terms of stock
performance. Capital spending on energy saving projects was
being reduced and solar manufacturer stocks were being
downgraded on extremely high competition, especially from
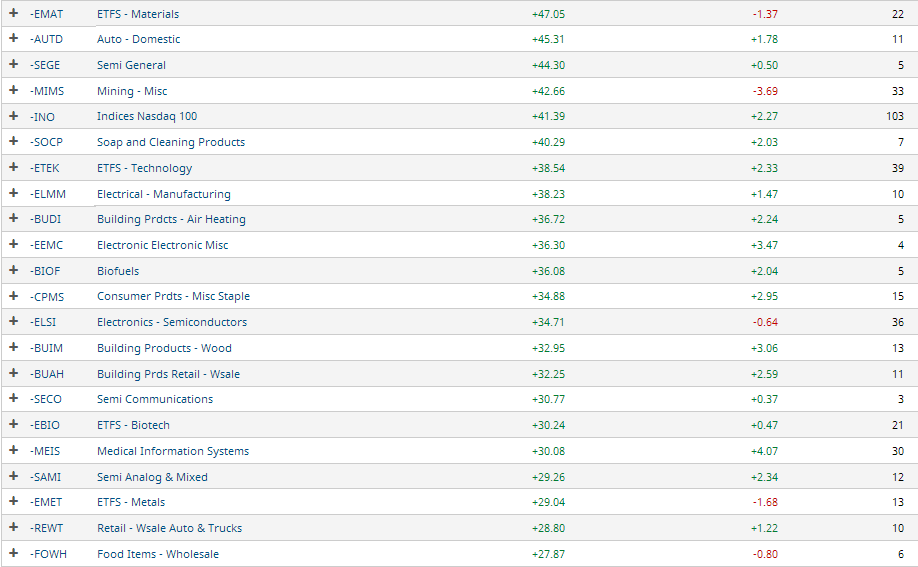
foreign manufactuers. Today, "solar" is near the top of the
heap in terms of company stock performance. One of the biggest
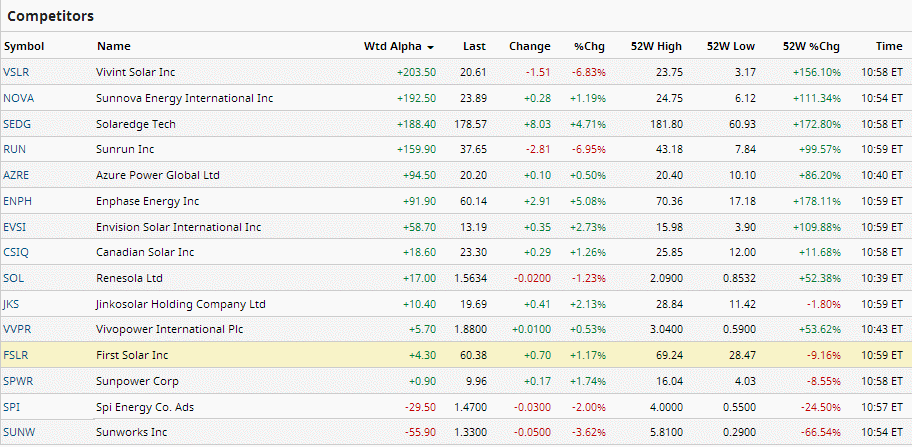
manufacturers and installers is First Solar, Inc. (FSLR), a San
Francisco-based company. Its stock performance has been lagging most
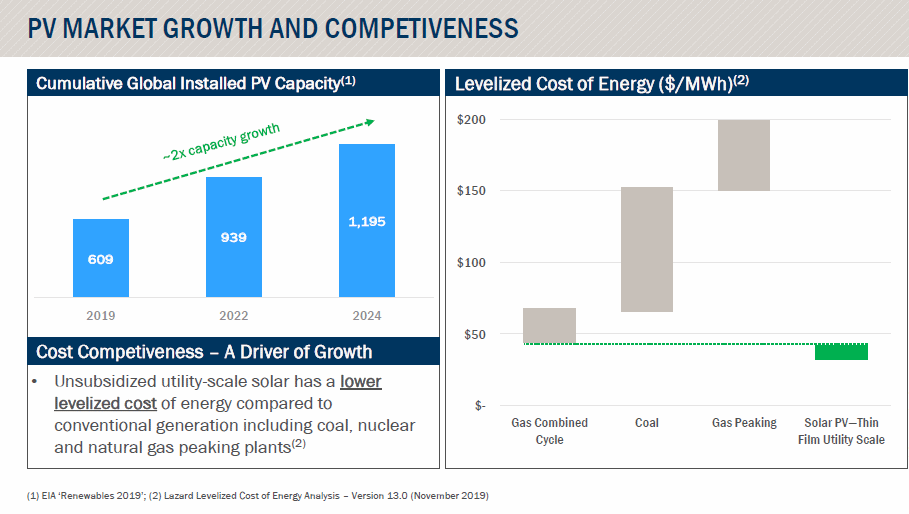
other competitors. Sentiment changed because of an anticipated
huge increase in capital spending on solar and wind power projects.
But the fundamentals of many of the solar panel companies
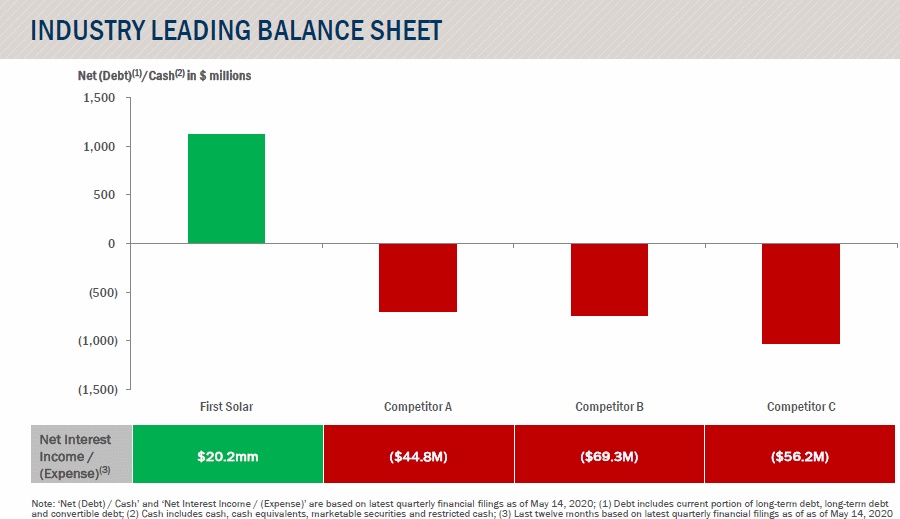
remains unchanged. FSLR seems bigger and better able to
withstand difficult economic periods than some of the more
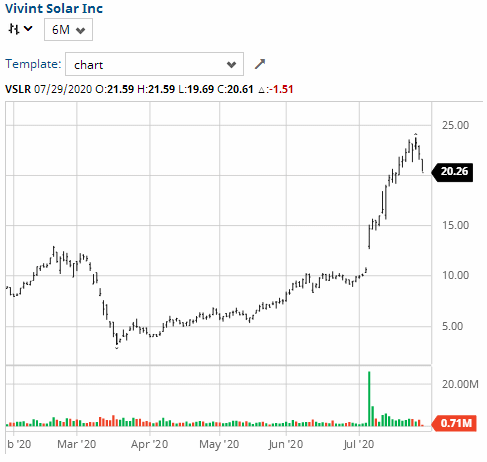
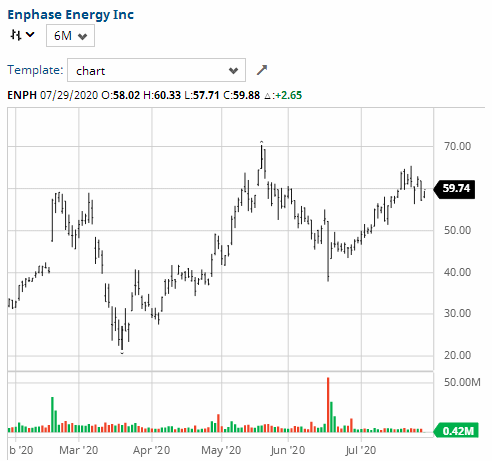
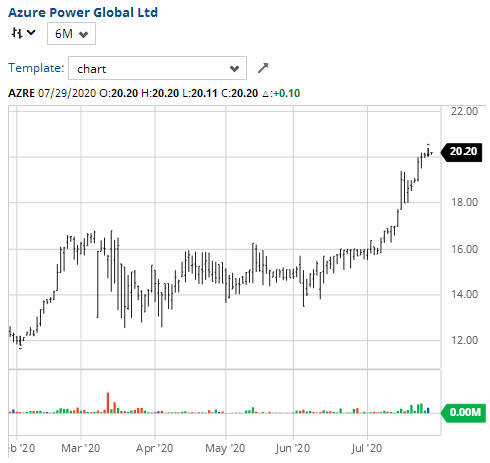
speculative companies whose stocks are soaring high-flyers but
moving sharply both up and down "with the winds" so-to-speak.
This company has a good website and CEO Letter and shows
shareholder concern. Management is somewhat overcompensated in
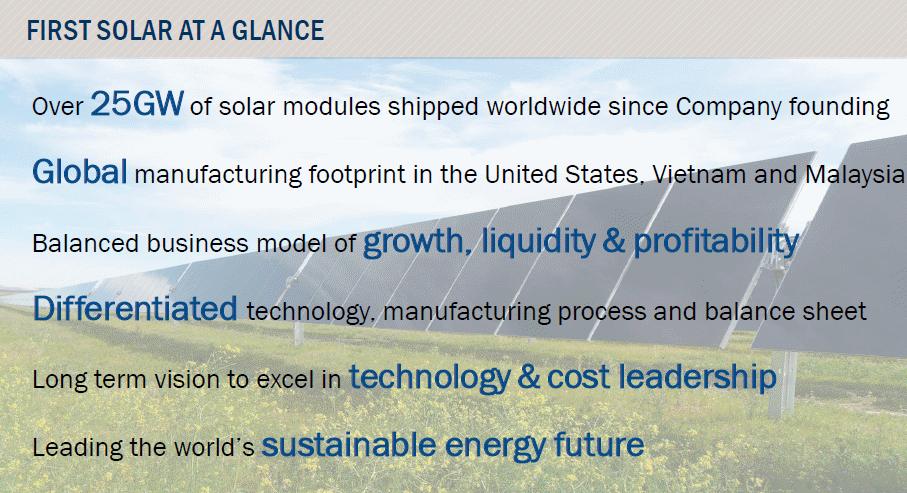
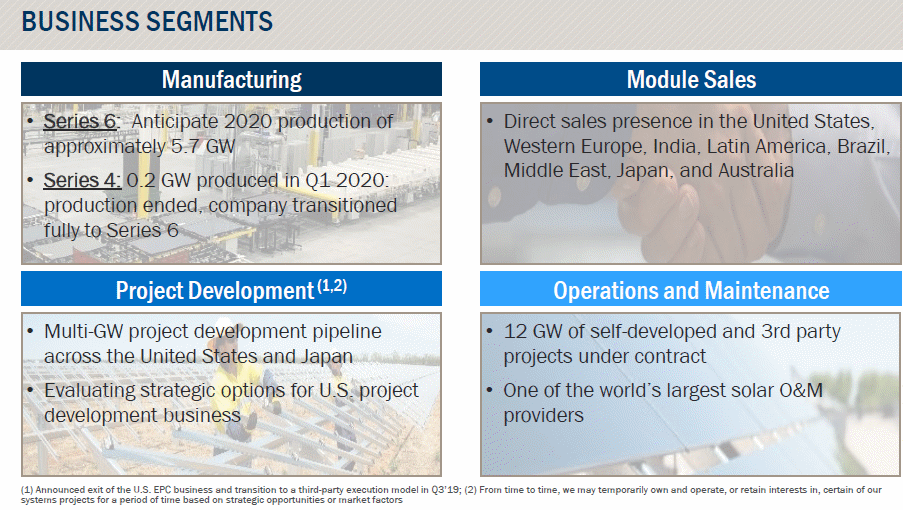
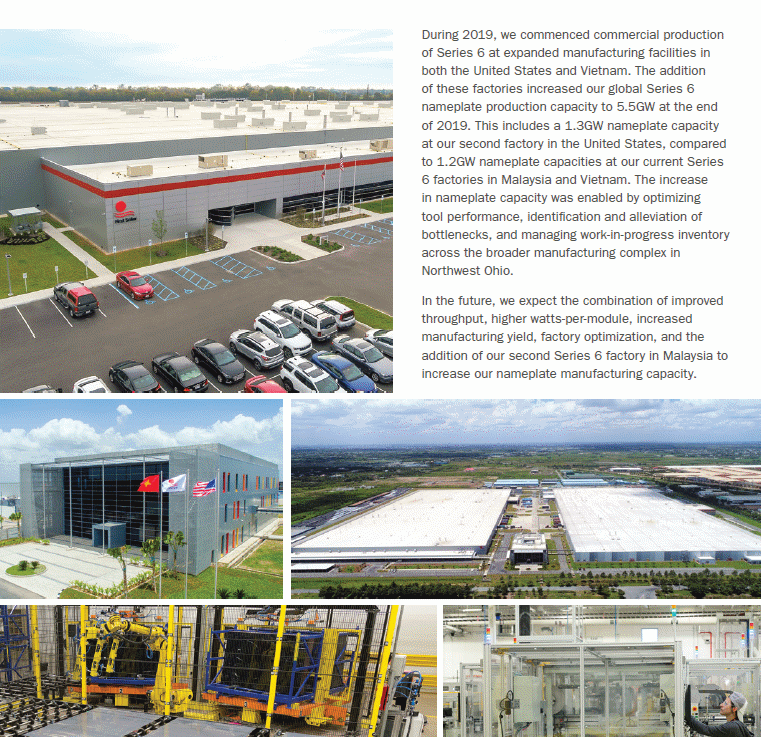
our opinion. The company has manufacturing facilities in
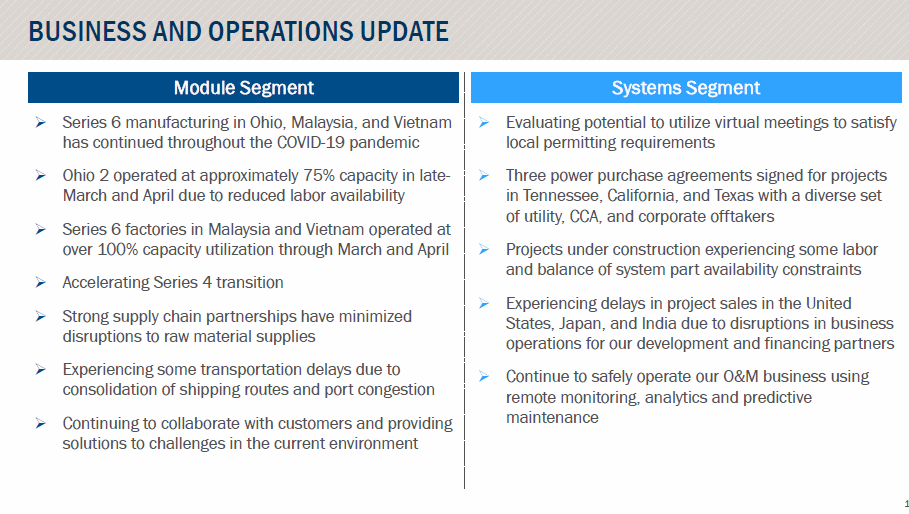
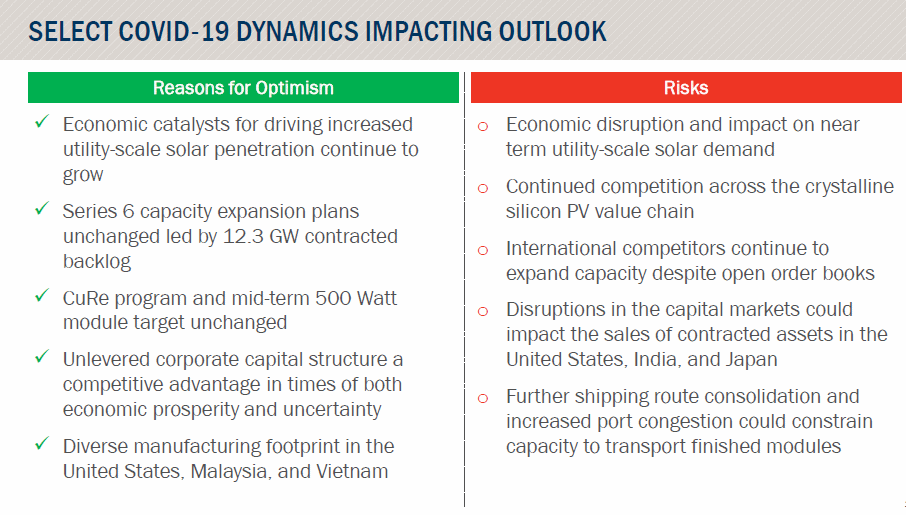
Vietnam, and a global presence. It has suffered somewhat from
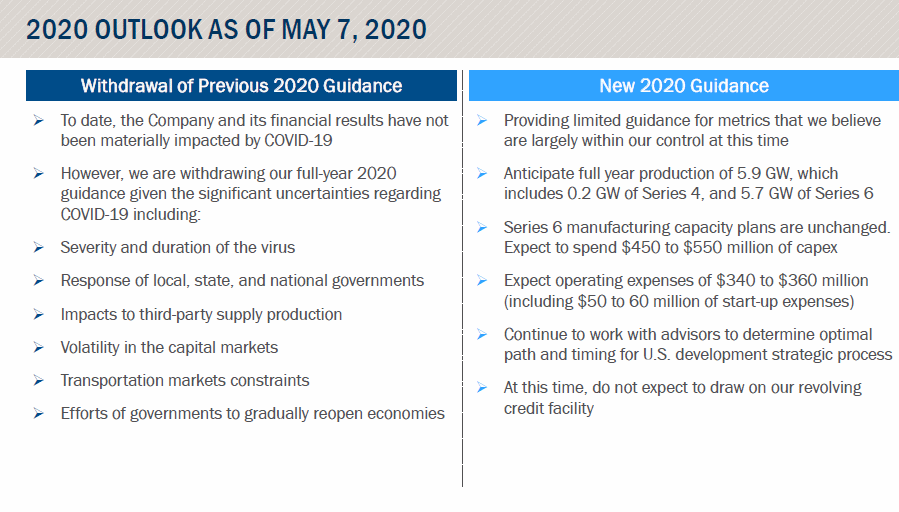
the pandemic effects as have most companies, but continues
output from manufacturing facilities undere safer conditions.
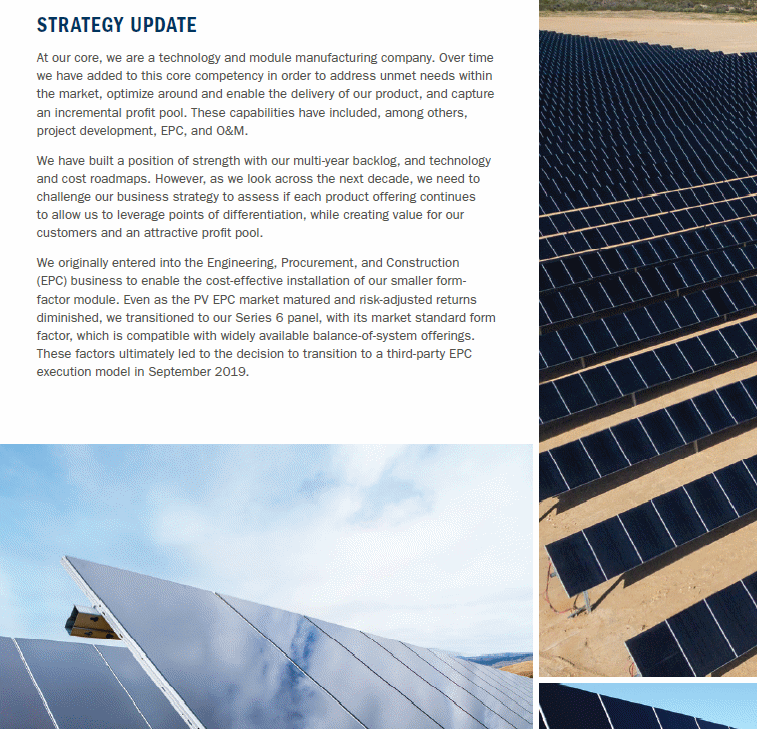
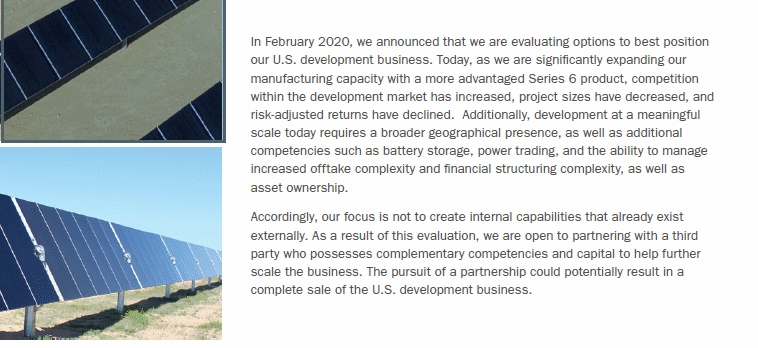
News consists of an abundance of research efforts and new
patents on solar panel manufacturing processes, and the company
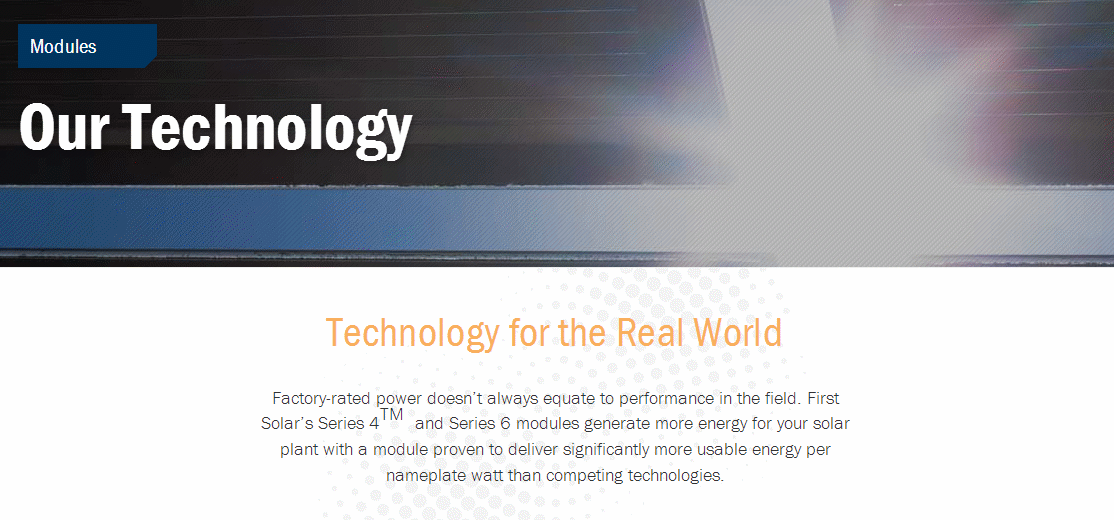
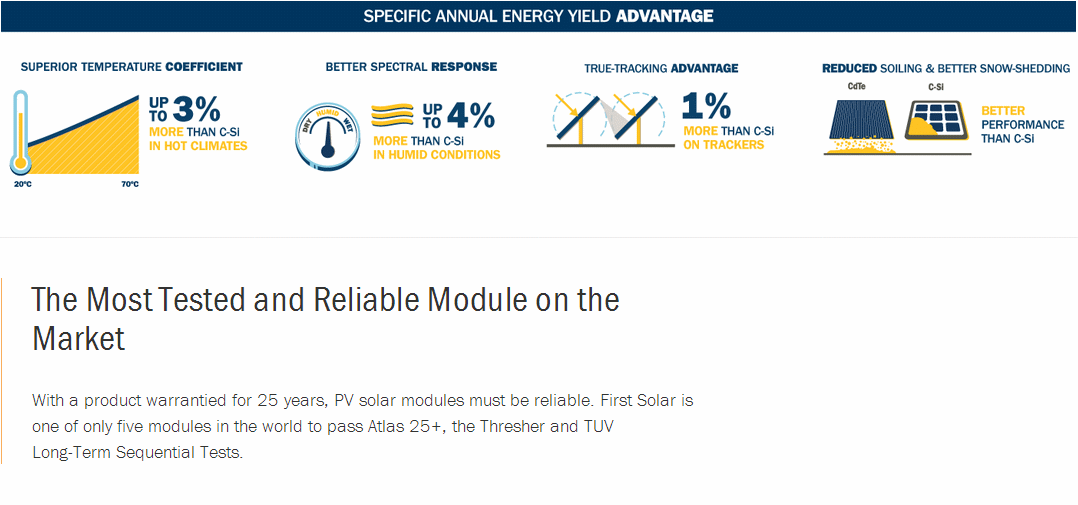
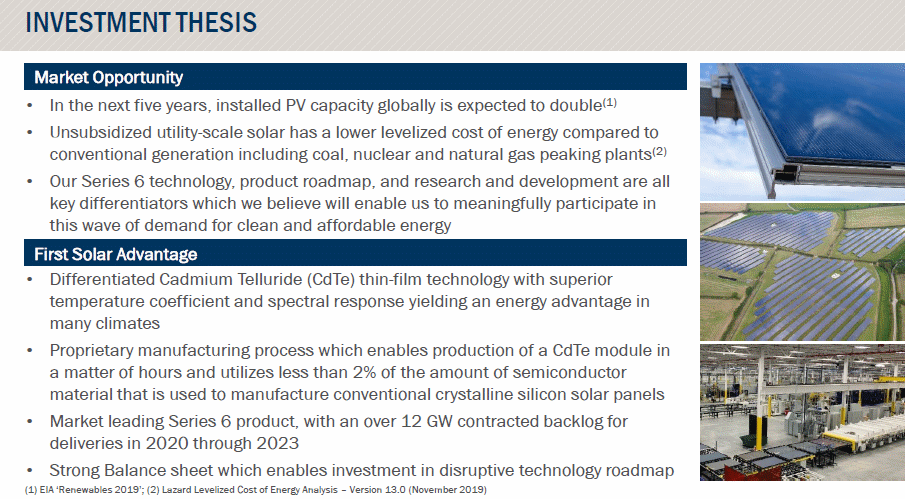
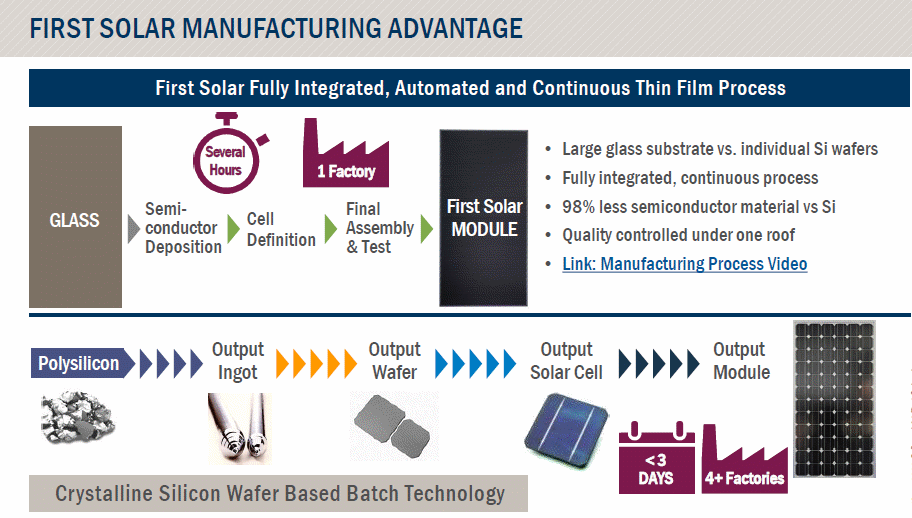
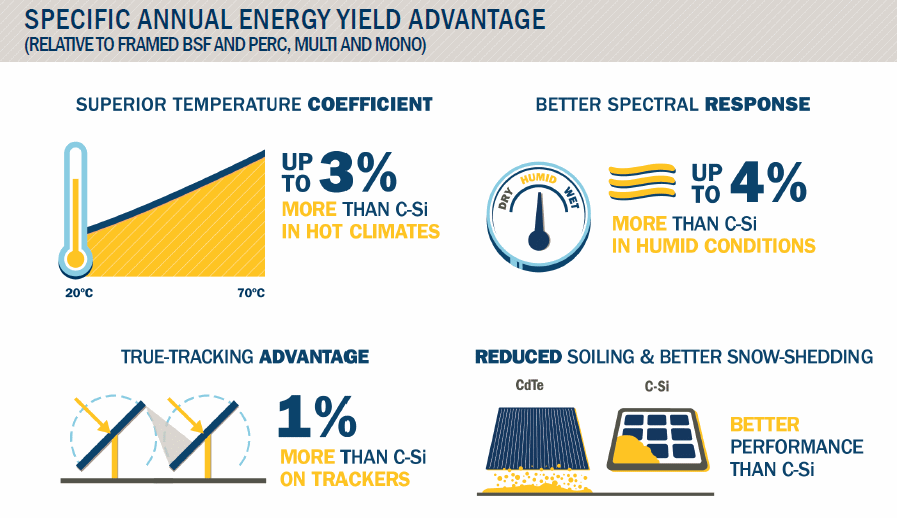
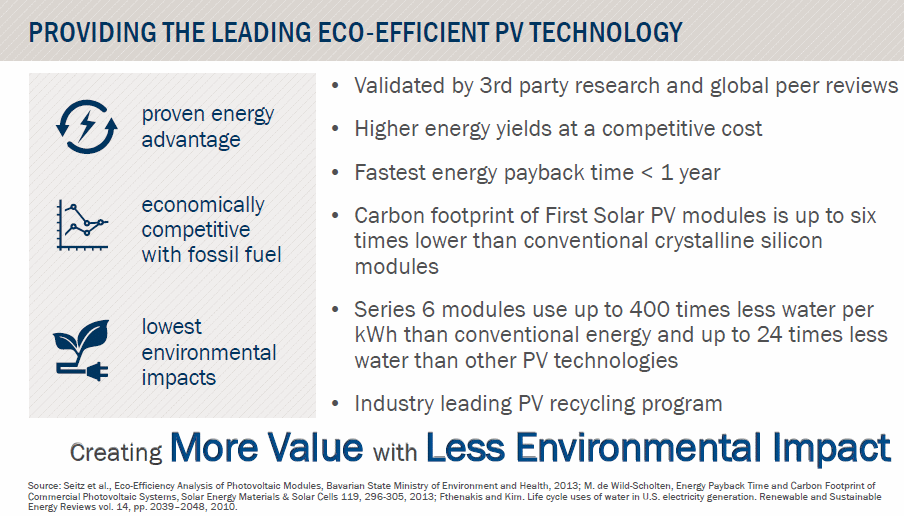
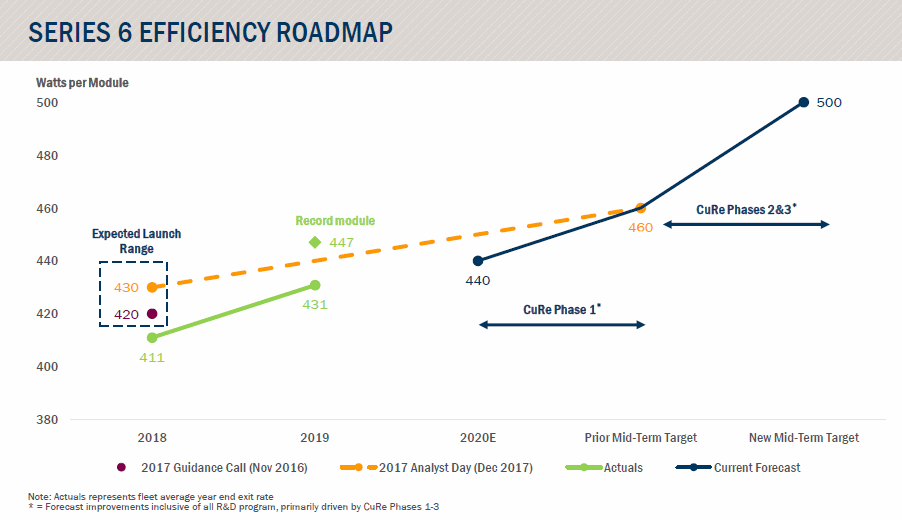
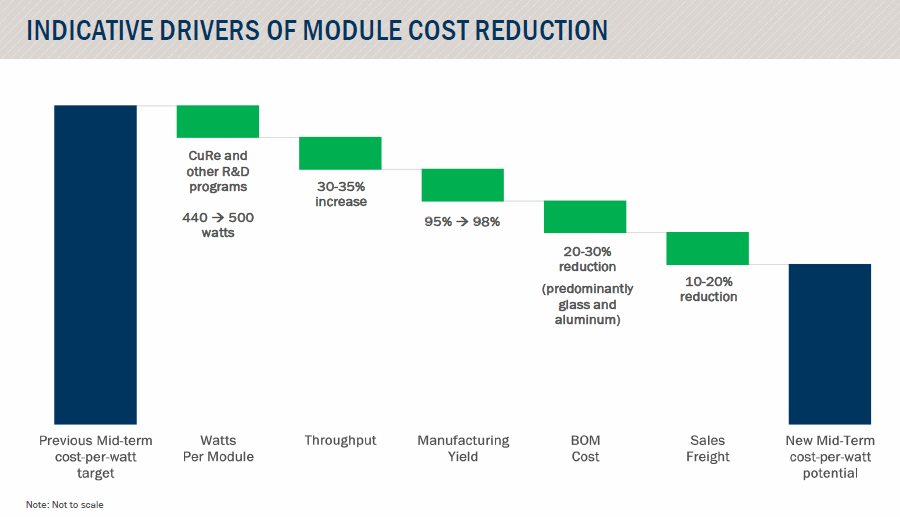
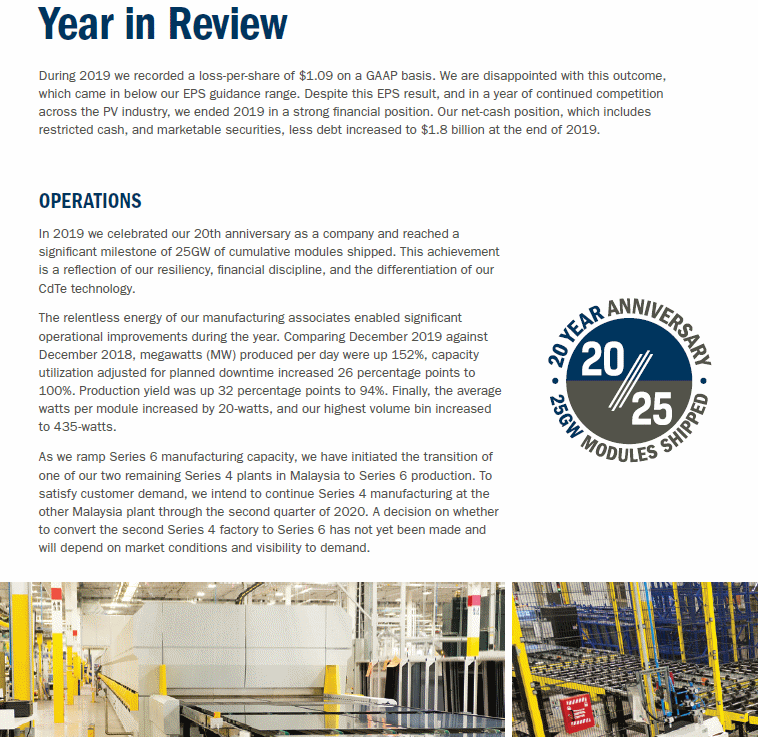
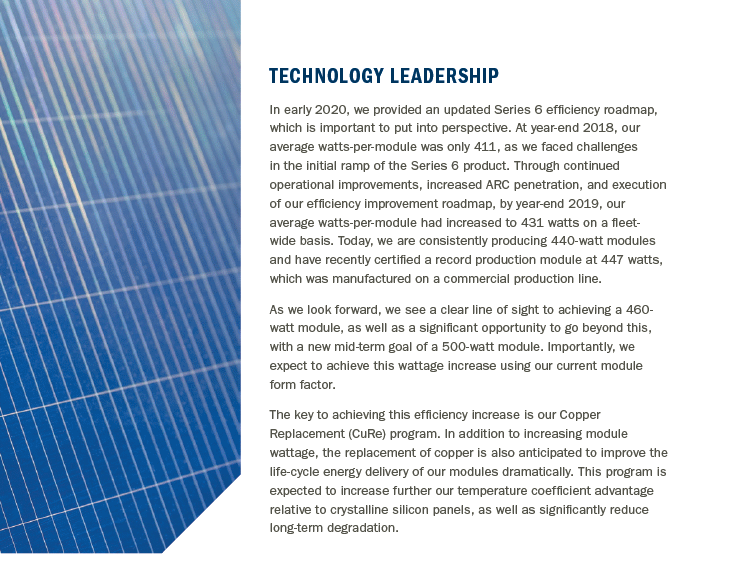
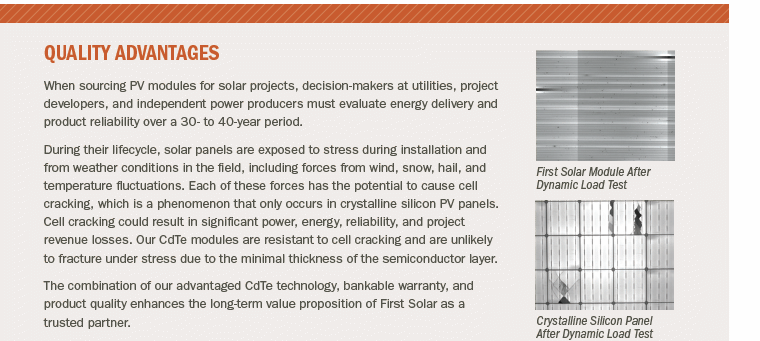
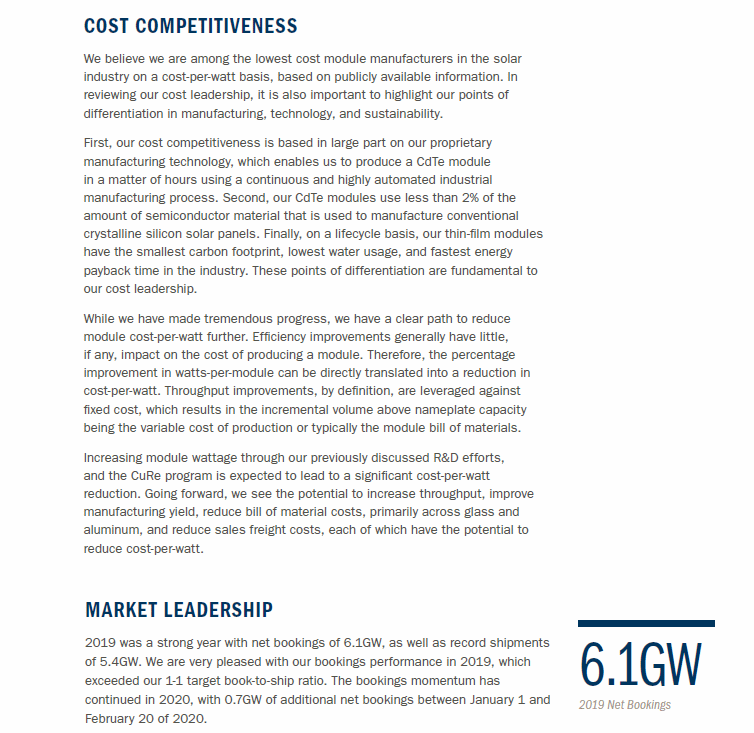
touts its new "Series 6" line as extremely efficient and cost
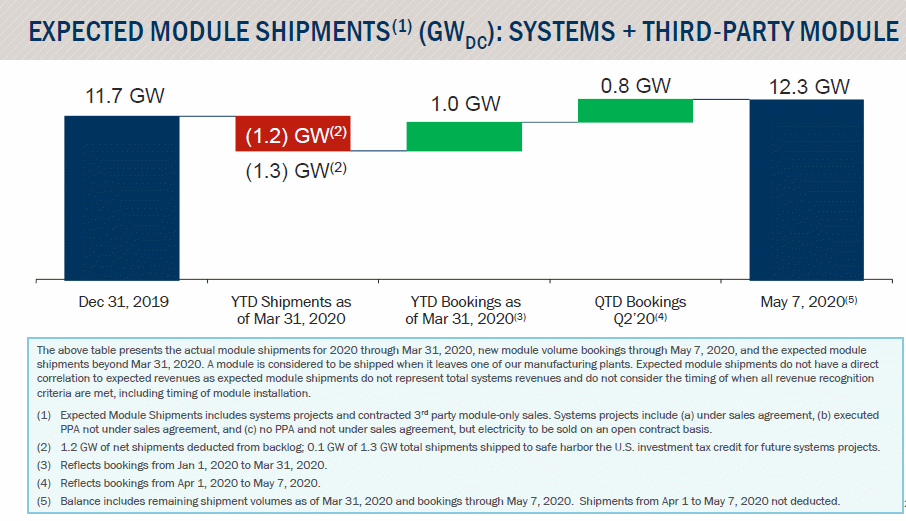
effective compared to competitors. It has an abundance of projects
underway and a backlog.
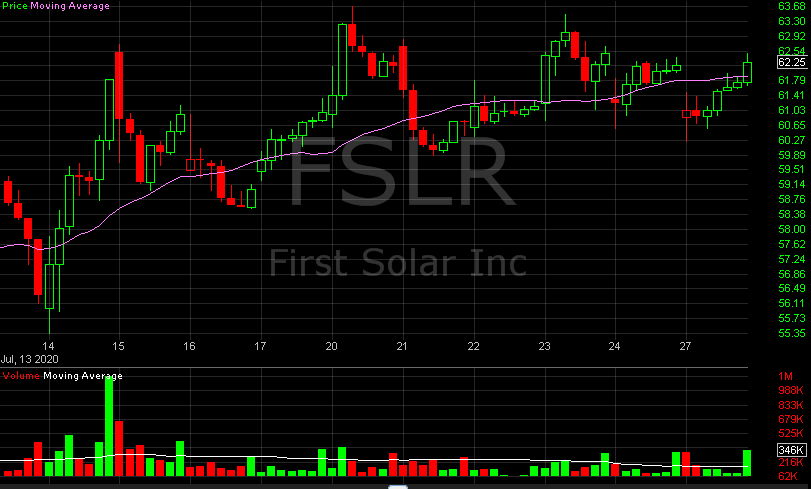
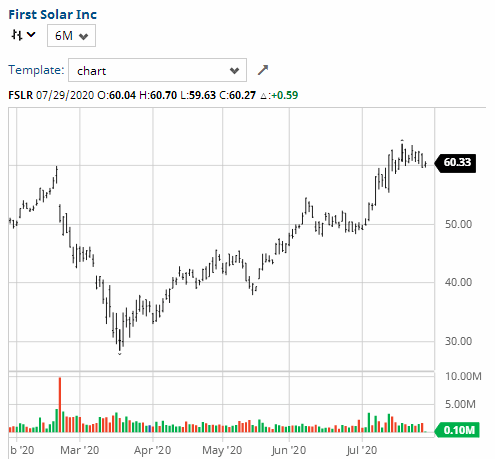
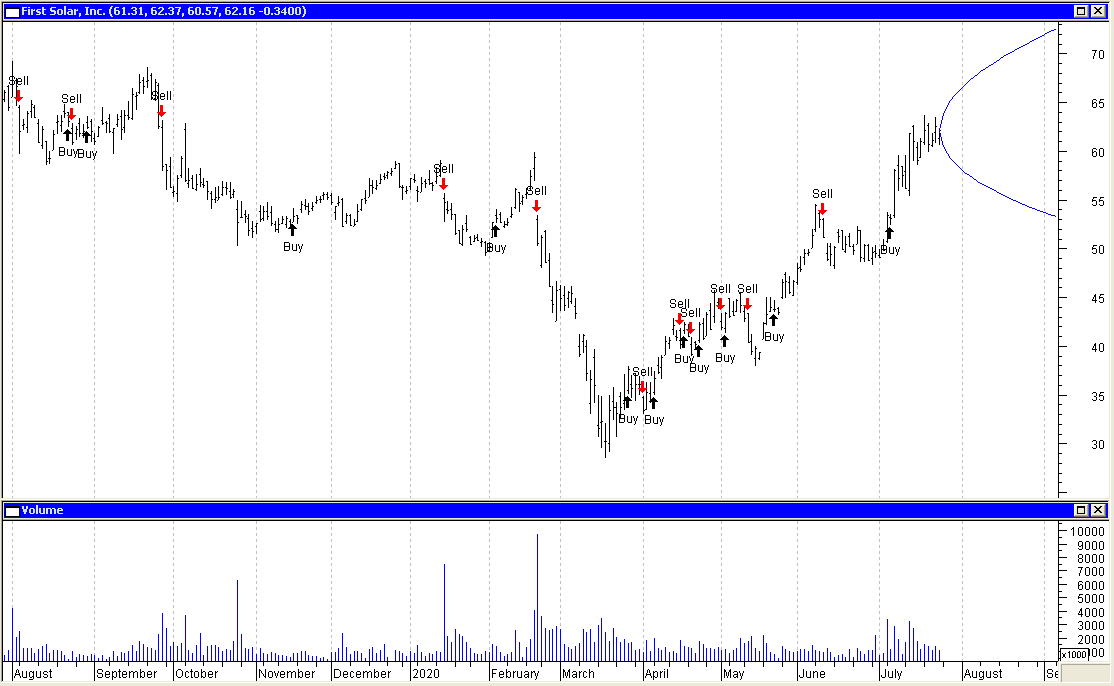
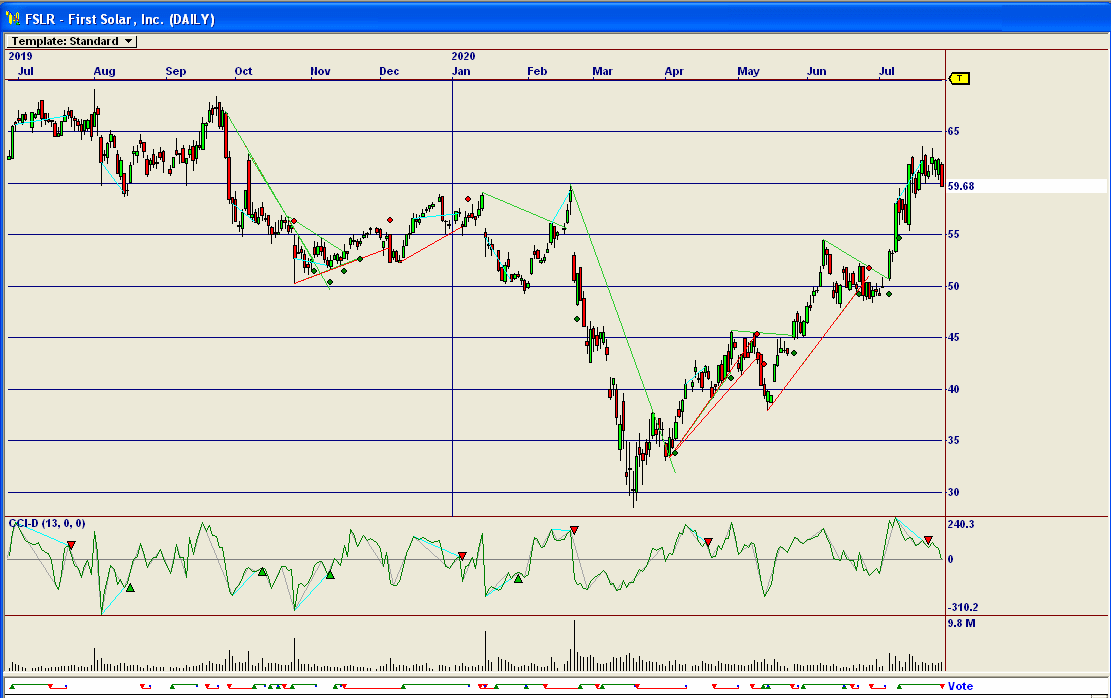
The stock chart looks very "toppy" as the share price has nearly
doubled in six months. But this simply places it back where it
was before the pandemic.
The company has a poor Zenith Index indicating poor
fundamentals. It performed well in 2015, but has been losing money
every year since then except 2018. This is not unusual for the
industry (in our opinion) but stock share price is based upon
sentiment with the idea of enormous growth potential. This is not
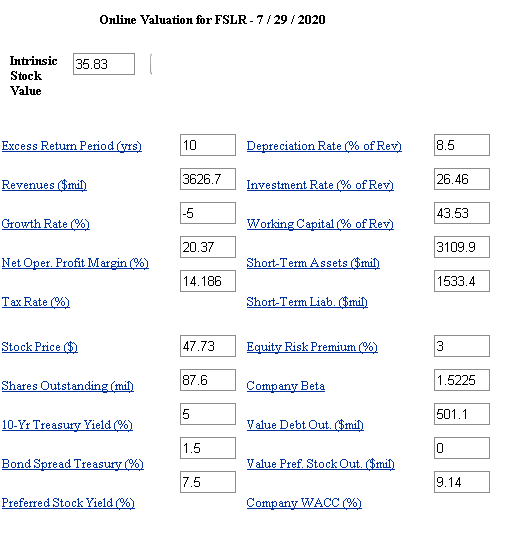
indicated so far in intrinsic values. One analyst described the
company as "the perfect short." Earnings
growth patterns are the main problem in unpredictable risky
history, but ratios look better as the company is "on the mend"
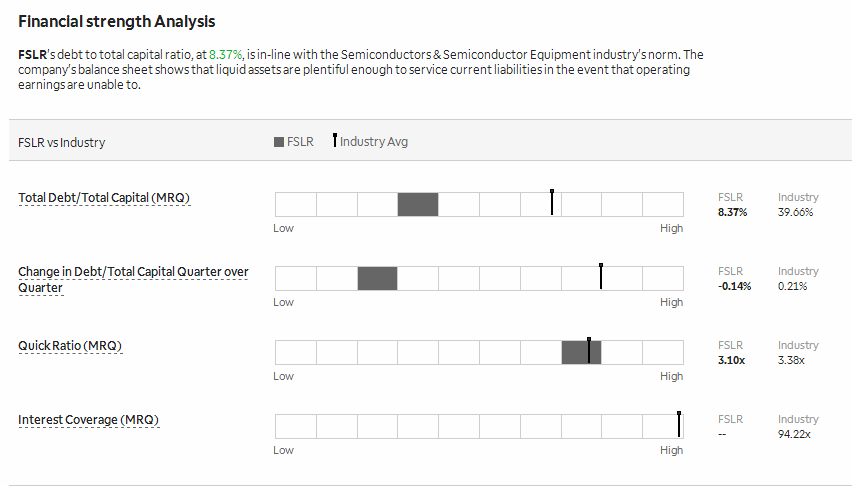
with low debt and higher projected earnings.
News includes the fact that the company has sold off some of its
contracts to competitors.
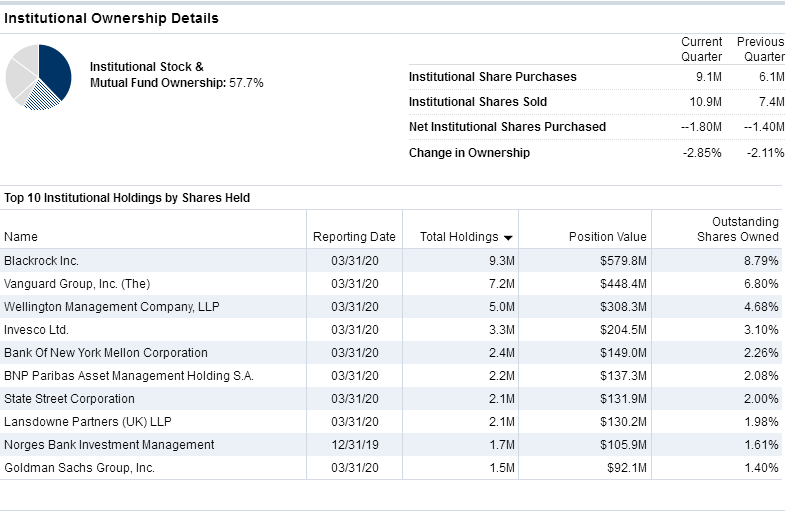
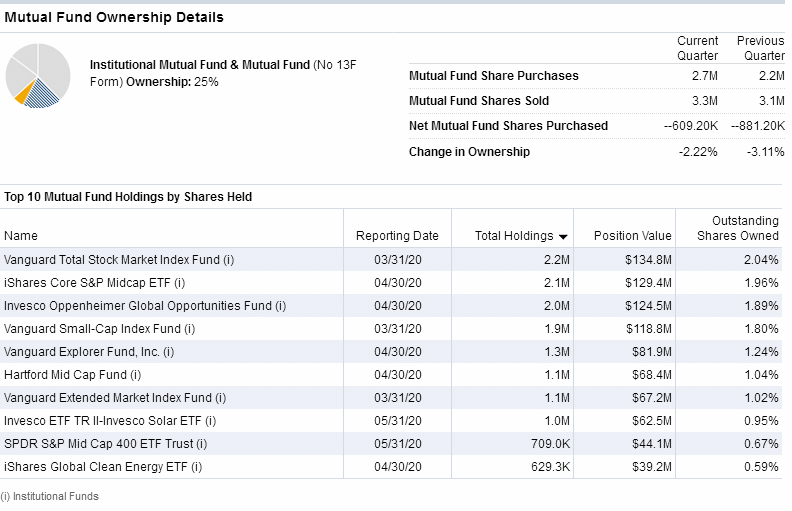
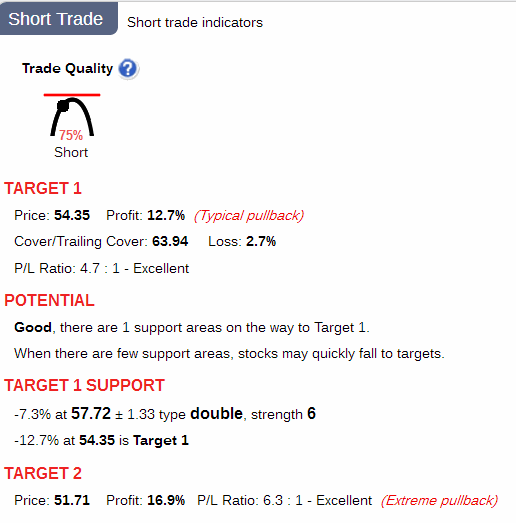
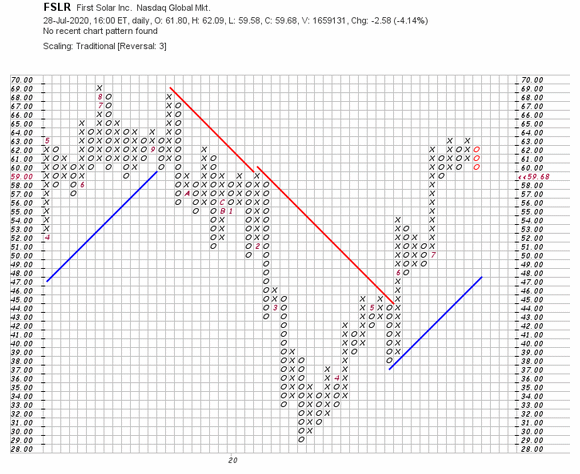
Institutions are net sellers. Chart patterns seem to favor a
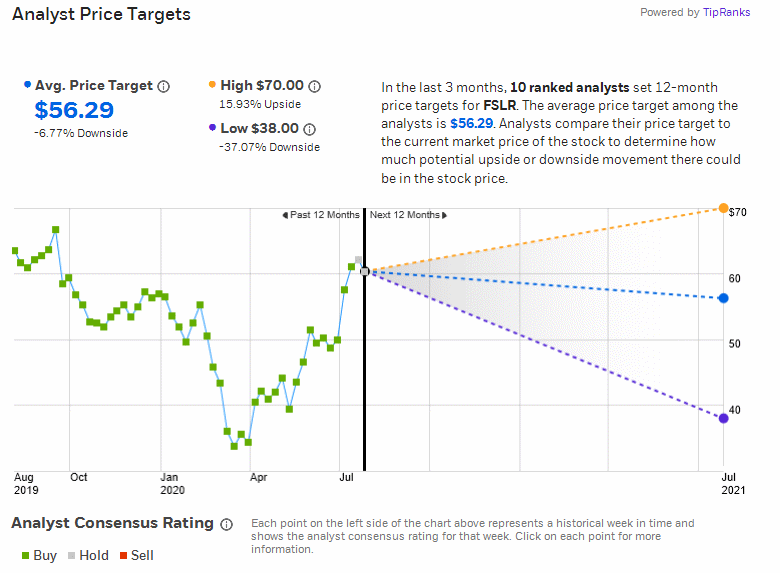
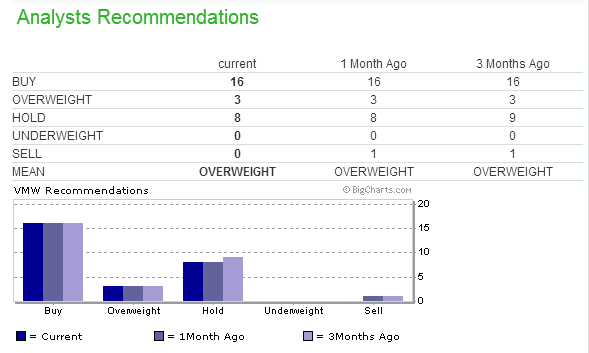
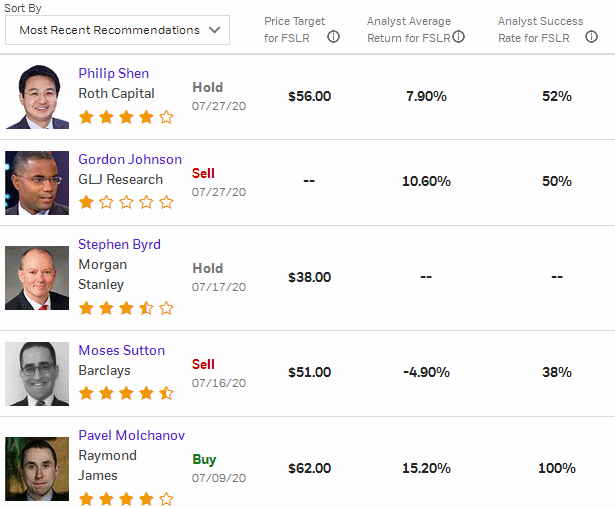
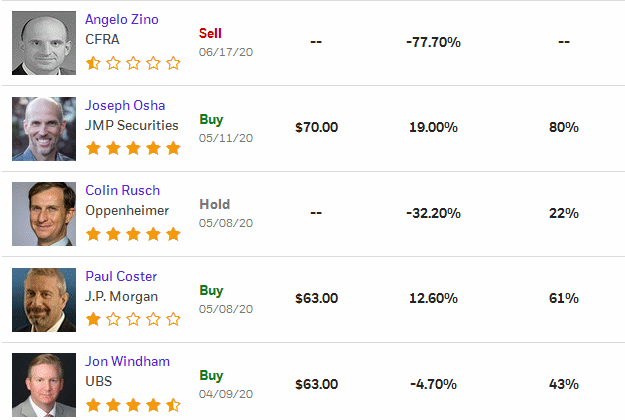
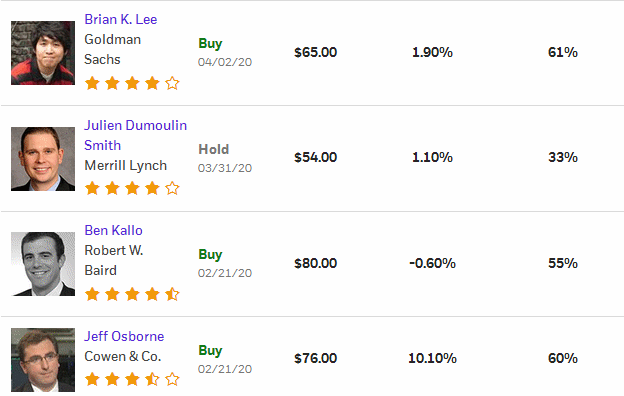
downmove in the offing. Analysts tend to like the stock but
researchers are overwhelmingly negative, including Standard & Poor's.
Solar stocks are quite volatile, usually more so than this one, and so
this stock's movement may depend upon prospects and sentiment
for the group as a whole, which can shift rapidly.
(WAIT FOR PAGE TO LOAD COMPLETELY BEFORE LINKS WORK.)
Company Profile
Company History
News
Comparison with Peers
Bond Issue
Zenith Index
Financial Statements
Avg. P/E to Current P/E
Financial Ratios
Intrinsic Value (Disc. CashFlow)
Fair Value Estimator
Projected Earnings
Research Reports
Analysts' Opinions
Insider Activity
Institutional Activity
Sentiment
Short Interest
Standard & Poor's
Management's Discussion
Channel Potential
MACD Histogram
Intraday Chart
Val Idea
Stock Consultant
Point & Figure Chart
Wall Street Analyzer
Marketspace Chart
Time Series Forecast
Neural Network Prediction
Stock Options
Ultimate Trading Systems
Recommendation



Company Profile |

Company History |
News |
Comparison |
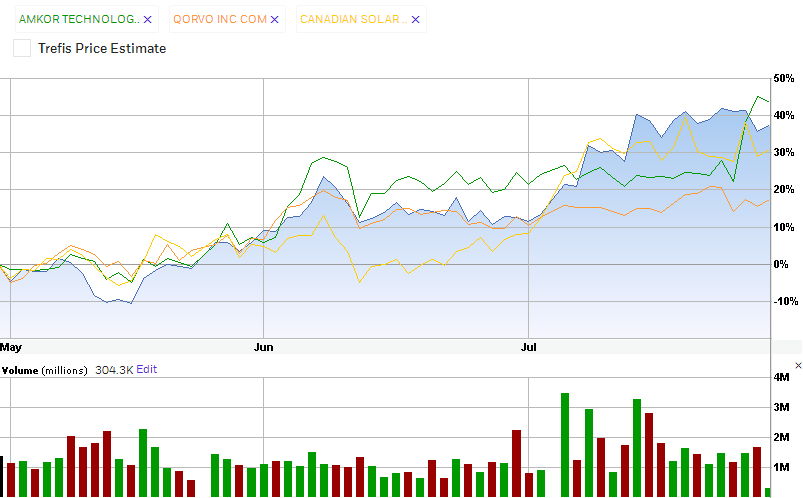
Similar Companies Performance:
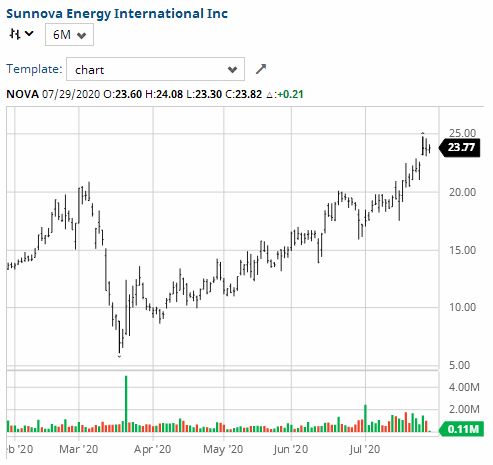
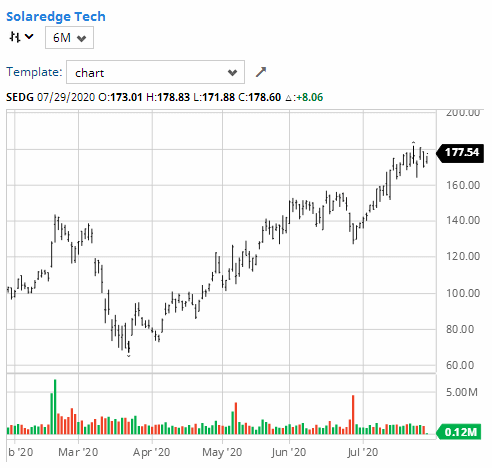
Bond Issue |

Zenith Index |
Under current market conditions, a Zenith Index Score of 1.20 or above is required for a positive rating on this factor. 1.21 -1.30 is considered acceptable, 1.30-1.40 is considered strong and
> 1.40 is considered exceptionally strong. Accounting statements in this section often contain mistakes, especially in earlier years' totals, but data is deemed sufficient for us to give a rating. More accurate financial statements follow in the next section.
FSLR  First Solar, Inc.
   Exchange: NASDAQ     Group: oils/energy         Industry: solar
   Rank of Industry:  46            Rank within Industry: 115 out of 252

      Shares Out:  105.91 (mil.)   Market Capitalization:$  6,583.18 (mil.)
      Sales (12 mo.): $  3,063.00 (mil.)              Sales Growth:   0.03%
      Avg Broker Recommend (1=Strong Buy): 2.00   Consensus Target:  59.70
      Dividend:$ 0.00  Yield: 0.00%  Payout Ratio: 0.00  Payout Chg:  0.00%

      Headquartered in Tempe, AZ *First Solar, Inc.* is a leading global
      provider of comprehensive PV solar energy solutions and specializes in
      designing, manufacturing, and selling solar electric power modules using
      a proprietary thin-film semiconductor technology. The company's solar
      modules employ a thin layer of cadmium telluride semiconductor material
      to convert sunlight into electricity. It sells its products to project
      developers, system integrators and renewable energy project operators
      primarily in Europe and Germany in particular. First Solar also engages
      Headquartered in Tempe, AZ *First Solar, Inc.* is a leading global
      provider of comprehensive PV solar energy solutions and specializes in
      designing, manufacturing, and selling solar electric power modules using
      a proprietary thin-film semiconductor technology. The company's solar

   Recent Price:  62.16     52-Week High:  69.24     52-Week Low:  28.47

   20-Day Avg. Daily Volume =  1,655,219                    Beta:   1.26

Earnings per Share (EPS) Estimates:

                        This        Next        This        Next
                       Quarter     Quarter      Year        Year
                      06/2020     09/2020     12/2020     12/2021

    Average Estimate      0.05        0.71        3.53        3.75
 Number of Estimates        10          10          10          10
        Low Estimate     -0.11        0.09        1.77        2.09
       High Estimate      0.65        1.16        3.63        4.28
        Year Ago EPS     -0.18        0.29        1.48        2.84
          EPS Growth    233.33%     131.03%      91.89%      19.19%

P/E Ratio Related Data:                                    EPS       Sales
  Current FY Estimate:  20.86                              Growth    Growth
   Trailing 12 Months:   0.00       vs. Previous Quarter:  -57.92%   -61.97%
     P/E Growth Ratio:   1.98          vs. Previous Year:  232.81%     0.03%

Price/Sales Ratio:  2.15    Price/Book Ratio:  1.27    Price/Cash Flow: 18.07

Other Fundamental Data:
                                NA          03/31/20      12/31/19
Return on Investment         0.00         6.13          3.06
Return on Assets             0.00         4.40          2.17
Current Ratio                0.00         3.75          2.73
Quick Ratio                  3.10         3.10          2.39
Operating Margin             0.00        10.30          5.13
Net Margin                   0.00         1.42         -3.75
Pre-Tax Margin               0.00         0.00          0.00
Book Value                  48.36        49.74         48.84
Inventory Turnover           0.00         4.65          4.87
Debt-to-Equity Ratio         0.00         0.08          0.09
Debt-to-Capital Ratio        0.00         7.03          8.18

Reported and Estimated Quarterly Earnings:
Reported                                03/2020   12/2019   09/2019   06/2019
                                           0.85      2.02      0.29     -0.18
Estimated                              06/2020   09/2020   12/2020   12/2021
  Consensus 7 Days Ago                     0.24      0.67      2.84      3.38
  Upward Revisions                            0         0         0         0
  Downward Revisions                          0         0         0         0
  Consensus 30 Days Ago                    0.30      0.68      2.86      3.44
  Upward Revisions                            0         1         0         1
  Downward Revisions                          2         1         1         1


Annual Income Statements ($mil except EPS data):

                                   12/31/19 12/31/18 12/31/17 12/31/16 12/31/15

Sales                               3063.00  2244.00  2941.00  2951.00  3579.00
Cost of Goods                       2514.00  1852.00  2392.00  2247.00  2660.00
Gross Profit                         549.00   392.00   549.00   704.00   919.00
Selling, Deprec, Amort Expense       711.00   352.00   371.00  1207.00   403.00
Income After Deprec + Amortization  -162.00    40.00   178.00  -503.00   517.00
Non-Operating Income                  69.00    99.00    50.00    51.00    10.00
Interest Expense                      27.00    26.00    26.00    21.00     7.00
Pretax Income                       -120.00   113.00   202.00  -472.00   520.00
Income Taxes                          -5.00     3.00   372.00    58.00    -6.00
Minority Interest                      0.00     0.00     0.00     0.00     0.00
Investment Gains/Losses                0.00    35.00     4.00   172.00    20.00
Other Income/Charges                   0.00     0.00     0.00     0.00     0.00
Income from Continuing Operations   -115.00   144.00  -166.00  -358.00   546.00
Extras + Discontined Operations        0.00     0.00     0.00     0.00     0.00
Net Income                             0.00  -115.00   144.00     0.00  -166.00
Income before Depr. + Amortization    44.00   171.00   293.00  -272.00   775.00
Depreciation + Amort. (Cash Flow)      0.00     0.00     0.00     0.00     0.00
Average Shares                       105.31   106.11   104.33   102.87   101.82
Diluted EPS bf Non-Recurring Items     1.48     1.36     2.59     5.17     4.96
Diluted Net EPS                       -1.09     1.36    -1.59    -3.48     5.37


Balance Sheets ($mil. except per share data):

                                   12/31/19 12/31/18 12/31/17 12/31/16 12/31/15
Assets:

Cash + Equivalents                     0.00     2.00     2.00     2.00     1.00
Receivables                          659.00   586.00   386.00   472.00   560.00
Notes Receivable                       0.00     0.00    20.00    15.00     1.00
Inventories                          444.00   388.00   172.00   363.00   380.00
Other Current Assets                 334.00   338.00   265.00   981.00   574.00
Total Current Assets                3600.00  3860.00  3833.00  3787.00  3346.00
Property, Plant & Equipment         2181.00  1756.00  1155.00   629.00  1284.00
Investments + Advances               304.00   322.00   644.00   614.00   734.00
Other Non-Current Assets             161.00   153.00   162.00   155.00   126.00
Deferred Charges                     131.00    78.00    51.00   253.00   358.00
Intangibles                           79.00    89.00    95.00   102.00   195.00
Deposits + Other Assets             1060.00   865.00   925.00  1327.00  1275.00
Total Assets                           0.00     7.00     7.00     6.00     6.00

                                   12/31/19 12/31/18 12/31/17 12/31/16 12/31/15
Liabilities:

Notes Payable                          0.00     0.00     0.00     0.00     0.00
Accounts Payable                     218.00   233.00   120.00   149.00   338.00
Current Portion Long-Term Debt        18.00     6.00    13.00    28.00    38.00
Current Portion Capital Leases         0.00     0.00     0.00     0.00     0.00
Accrued Expenses                     714.00   442.00   367.00   263.00   409.00
Income Taxes Payable                  17.00    21.00    20.00     5.00     1.00
Other Current Liabilities            351.00   144.00   131.00   455.00   174.00
Total Current Liabilities           1318.00   845.00   650.00   900.00   961.00
Mortgages                              0.00     0.00     0.00     0.00     0.00
Deferred Income Taxes                  0.00     0.00     0.00     0.00     0.00
Convertible Debt                       0.00     0.00     0.00     0.00     0.00
Long-Term Debt                       454.00   461.00   380.00   160.00   251.00
Non-Current Capital Leases             0.00     0.00     0.00     0.00     0.00
Other Non-Current Liabilities        647.00   602.00   735.00   594.00   556.00
Minority Interest                      0.00     0.00     0.00     0.00     0.00
Total Liabilities                      0.00     2.00     1.00     1.00     1.00

                                   12/31/19 12/31/18 12/31/17 12/31/16 12/31/15
Shareholder Equity:

Preferred Stock                        0.00     0.00     0.00     0.00     0.00
Common Sock                            0.00     0.00     0.00     0.00     0.00
Capital Surplus                     2849.00  2825.00  2799.00  2759.00  2743.00
Retained Earnings                   2327.00  2442.00  2297.00  2463.00  2790.00
Other Equity                         -79.00   -54.00     2.00   -10.00    15.00
Treasury Stock                         0.00     0.00     0.00     0.00     0.00
Total Shareholder Equity            5097.00  5212.00  5099.00  5213.00  5548.00
Total Liabilities+ Owners' Equity   7516.00  7121.00  6865.00  6867.00  7316.00
Total Common Equity                    0.00     0.00     0.00     0.00     0.00
Shares Outstanding                   105.40   104.80   104.40   103.90   100.90
Book Value per Share                  48.36    49.74    48.84    50.17    54.99


Cash Flow Statement:

    Operations, Investments, & Financial Activities

                                   12/31/19 12/31/18 12/31/17 12/31/16 12/31/15

Net Income                             0.00  -114.93   144.33  -165.62  -357.96
Depreciation/Amortization + Deplet   205.48   130.74   115.31   230.94   257.83
Net Change in Assets/Liab.           225.28  -326.34  1166.09  -481.56 -1165.46
Net Cash f Discontinued Operations     0.00     0.00     0.00     0.00     0.00
Other Operating Activities          -141.62  -275.53   224.89   815.33     0.30
Net Cash f Operating Activities        0.00   174.20  -326.81     1.00   206.75
Property + Equipment                -668.72  -739.84  -514.36  -229.45  -166.36
Acquisition/Disp. of Subsidiaries      0.00     0.00     0.00   -10.27     0.00
Investments                          309.30    14.54  -114.66   394.41  -230.60
Other Investing Activity              -2.88    42.58     2.22   -10.16   284.82
Net Cash from Investing             -362.30  -682.71  -626.80   144.52  -112.14

    Use of Funds

                                   12/31/19 12/31/18 12/31/17 12/31/16 12/31/15

Issue (Repurchase) Capital Stock       0.00     0.00     0.00     0.00     0.00
Issuance (Repayment) of Debt          90.03   271.99   191.34  -110.55   -47.08
Increase/Decrease Short-Term Debt      0.00     0.00    43.03     0.00   146.03
Dividends + Distributions              0.00     0.00     0.00     0.00     0.00
Other Financing Acitivies            -15.09   -16.76   -42.32   -25.84    38.15
Net Cash from Financing               74.94   255.23   192.05  -136.39   137.10
Effect of Exchange Rate Changes       -2.96   -13.56     8.87    -6.31   -19.27

Net Change in Cash + Equivalents    -116.11  -767.85   914.79   208.57  -355.23

    Net Change in Cash & Equivalents

                                   12/31/19 12/31/18 12/31/17 12/31/16 12/31/15

Cash at Beginning of Per.           1562.62  2330.48  1415.69  1207.12  1482.05
Cash at End of Period               1446.51  1562.62  2330.48  1415.69  1126.83
Net Change in Cash + Equivalents    -116.11  -767.85   914.79   208.57  -355.23


Zenith Indices:                      [Indices near +3.0, or near zero,
                                     or < zero bear special attention.]
P/E Ratio Tests:
Current P/E Ratio < 28?    0.0000     P/E Ratio > 5?             0.0000
P/E Ratio Vs Growth Rate:  0.0000     Forward P/E Ratio < 28?    1.3423

Sales Tests:
Sales < $500 mil.?         0.2228     Sales incr. 25% Yearly?    0.0012
Sales > $340 million?      3.0000     Inventory/Sales < 5%?      0.2892

Balance Sheet Tests:
Debt/Equity Ratio < 0.40?  3.0000     LTD/Net Assets:            0.0152
Debt Reduction:            0.3471     Intangibles/Assets < 10%?  0.0079
Current Ratio > 2?         3.0000     Return on Equity > 9.8%?   0.6255

Earnings Tests:
EPS 5-Yr. Growth > 18%?    3.0000     Operating Margin > 5%?     0.4854
EPS Annual Growth > 0%?   -3.0000     Dividend Rate cp 2.7%:     0.0000
Earnings Consistent?       1.3333     Payout Ratio Decreasing?   1.2000
Net Income Increasing 25%?-0.6389     Price<15% below 52-wk Hi?  1.0324
Positive Cash Flow?        0.6705     Price/Book X PE < 22?      3.0000
Profit Margin > 7.5%?      0.1893     Price/Book < 1.6?          1.2598
Profit Margin Increasing? -0.3787     Stock Compared to S+P 500: 3.0000

Price & Float Tests:
Return on Investment>12%?  0.3606     Shares Out > 50 mil.?      2.1182
Return on Assets > 10%?    0.1808     Beta > 1.25?:              1.2600
Price/Sales Ratio < 2.3?   0.3060     Liquidity > 2%?            3.0000

Ownership Tests:
Analyst Following > 2.0?   1.5000     Market Capital'n > 300M?   3.0000
Owner's Equity Increasing? 0.9394     Shares Out Decreasing?     0.9628

FSLR                                   Overall Zenith Index:     1.0618
Financial Statements |
FIRST SOLAR INC (FSLR) INCOME STATEMENT Fiscal year ends in December. USD in thousand 2015-12 2016-12 2017-12 2018-12 2019-12 TTM Revenue 3,578,995 2,951,328 2,941,324 2,244,044 3,063,117 3,063,263 Cost of revenue 2,659,728 2,247,349 2,392,377 1,851,867 2,513,905 2,423,825 Gross profit 919,267 703,979 548,947 392,177 549,212 639,438 Operating expenses Research and development 130,593 124,762 88,573 84,472 96,611 100,347 Sales, General and administrative 255,192 261,994 202,699 176,857 205,471 218,706 Restructuring, merger and acquisition 0 818,792 37,181 0 0 0 Other operating expenses 16,818 -817,771 5,462 90,735 45,915 40,875 Total operating expenses 402,603 387,777 333,915 352,064 347,997 359,928 Operating income 516,664 316,202 215,032 40,113 201,215 279,510 Interest Expense 6,975 20,538 25,765 25,921 27,066 23,734 Other income (expense) 10,146 -767,354 12,848 98,955 -294,278 -305,508 Income before taxes 519,835 -471,690 202,115 113,147 -120,129 -49,732 Provision for income taxes -6,156 58,219 371,996 3,441 -5,480 -93,301 Other income 20,430 171,945 4,266 34,620 -284 -199 Net income from continuing operations 546,421 -357,964 -165,615 144,326 -114,933 43,370 Net income 546,421 -357,964 -165,615 144,326 -114,933 43,370 Net income available to common shareholders 546,421 -357,964 -165,615 144,326 -114,933 43,370 Earnings per share Basic 5.42 -3.48 -1.59 1.38 -1.09 0.41 Diluted 5.37 -3.48 -1.59 1.36 -1.09 0.40 Weighted average shares outstanding Basic 100,886 102,866 104,328 104,745 105,310 105,447 Diluted 101,815 102,866 104,328 106,113 105,310 105,645 ____________________________________________________________________________________________________________________________________________ FIRST SOLAR INC (FSLR) BALANCE SHEET Fiscal year ends in December. USD in thousand 2015-12 2016-12 2017-12 2018-12 2019-12 Assets Current assets Cash Short-term investments 703,454 607,991 720,379 1,143,704 811,506 Total cash 1,830,280 1,955,146 2,988,913 2,547,266 2,164,247 Receivables 500,629 266,687 211,797 128,282 475,039 Inventories 517,313 425,995 201,210 444,818 497,096 Prepaid expenses 74,990 77,343 73,391 150,300 185,738 Other current assets 422,374 1,061,449 357,461 588,857 277,714 Total current assets 3,345,586 3,786,620 3,832,772 3,859,523 3,599,834 Non-current assets Property, plant and equipment Gross property, plant and equipment 2,717,676 2,608,387 2,790,321 3,384,129 4,242,946 Accumulated Depreciation -1,339,799 -1,530,644 -1,218,676 -1,319,278 -1,439,109 Net property, plant and equipment 1,377,877 1,077,743 1,571,645 2,064,851 2,803,837 Equity and other investments 399,805 242,361 219,503 3,186 2,812 Goodwill 84,985 14,462 14,462 14,462 14,462 Intangible assets 110,002 87,970 80,227 74,162 64,543 Deferred income taxes 357,693 252,655 51,417 77,682 130,771 Other long-term assets 1,640,383 1,405,402 1,094,475 1,027,496 899,430 Total non-current assets 3,970,745 3,080,593 3,031,729 3,261,839 3,915,855 Total assets 7,316,331 6,867,213 6,864,501 7,121,362 7,515,689 Liabilities and stockholders' equity Liabilities Current liabilities Short-term debt 38,090 27,966 13,075 5,570 17,510 Capital leases 0 0 0 0 11,102 Accounts payable 337,668 148,730 120,220 233,287 218,081 Taxes payable 1,330 5,288 19,581 20,885 17,010 Accrued liabilities 409,452 262,977 366,827 441,580 628,799 Deferred revenues 105,899 123,365 81,816 129,755 323,217 Other current liabilities 68,361 331,381 48,757 14,380 102,489 Total current liabilities 960,800 899,707 650,276 845,457 1,318,208 Non-current liabilities Long-term debt 251,325 160,422 423,861 461,221 454,187 Capital leases 0 0 0 0 112,515 Accrued liabilities 163,407 166,277 166,609 134,442 137,761 Deferred revenues 0 0 63,257 48,014 71,438 Other long-term liabilities 392,312 428,120 461,801 419,825 324,813 Total non-current liabilities 807,044 754,819 1,115,528 1,063,502 1,100,714 Total liabilities 1,767,844 1,654,526 1,765,804 1,908,959 2,418,922 Stockholders' equity Common stock 102 104 104 105 105 Additional paid-in capital 2,742,795 2,759,211 2,799,107 2,825,211 2,849,376 Retained earnings 2,790,110 2,463,279 2,297,227 2,441,553 2,326,620 Accumulated other comprehensive income 15,480 -9,907 2,259 -54,466 -79,334 Total stockholders' equity 5,548,487 5,212,687 5,098,697 5,212,403 5,096,767 Total liabilities and stockholders' equity 7,316,331 6,867,213 6,864,501 7,121,362 7,515,689 ____________________________________________________________________________________________________________________________________________ FIRST SOLAR INC (FSLR) Statement of CASH FLOW Fiscal year ends in December. USD in thousand 2015-12 2016-12 2017-12 2018-12 2019-12 TTM Cash Flows From Operating Activities Net income 546,421 -357,964 -165,615 144,326 -114,933 43,370 Depreciation & amortization 257,825 230,940 115,313 130,736 205,475 212,882 Investment/asset impairment charges 14,593 838,467 35,364 8,065 7,577 8,513 Investments losses (gains) 0 -41,632 -49 -55,405 -40,621 -40,693 Deferred income taxes -17,534 123,864 173,368 -10,112 -59,917 -140,718 Stock based compensation 44,899 28,712 35,121 34,154 37,429 39,614 Change in working capital -1,165,463 -481,556 1,166,086 -326,343 225,279 -79,567 Inventory 113,537 95,785 212,758 -257,229 -83,528 -45,322 Prepaid expenses -38,635 9,574 26,680 -53,488 -34,528 -19,515 Accounts payable 143,872 -191,642 -47,191 96,443 -336 -23,431 Accrued liabilities -85,425 179,610 -258,028 132,382 397,527 -211,744 Income taxes payable -13,281 -59,640 169,079 0 0 0 Other working capital -1,285,531 -515,243 1,062,788 -244,451 -53,856 220,445 Other non-cash items -41,660 -134,078 -18,911 -252,230 -86,088 -70,624 Net cash provided by operating activities -360,919 206,753 1,340,677 -326,809 174,201 -27,223 Cash Flows From Investing Activities Investments in property, plant, and equipmen -166,438 -229,452 -514,357 -739,838 -668,717 -632,095 Property, plant, and equipment reductions 77 0 0 0 0 0 Acquisitions, net -27,475 281,230 0 247,595 0 0 Purchases of investments -556,479 -422,609 -580,971 -1,369,036 -1,177,336 -1,322,415 Sales/Maturities of investments 353,359 525,515 466,309 1,135,984 1,486,631 1,845,476 Other investing activities 284,816 -10,164 2,217 42,581 -2,876 -17,047 Net cash used for investing activities -112,140 144,520 -626,802 -682,714 -362,298 -126,081 Cash Flows From Financing Activities Debt issued 190,745 576,816 258,440 290,925 120,132 13,629 Debt repayment -50,780 -692,643 -29,296 -18,937 -30,099 -27,721 Excess tax benefit from stock based compe 17,707 0 0 0 0 0 Other financing activities -20,569 -20,566 -37,099 -16,760 -15,090 -12,243 Net cash provided by (used for) financing 137,103 -136,393 192,045 255,228 74,943 -26,335 Effect of exchange rate changes -19,272 -6,306 8,866 -13,558 -2,959 -8,108 Net change in cash -355,228 208,574 914,786 -767,853 -116,113 -187,747 Cash at beginning of period 1,482,054 1,207,116 1,415,690 2,330,476 1,562,623 1,206,625 Cash at end of period 1,126,826 1,415,690 2,330,476 1,562,623 1,446,510 1,018,878 Free Cash Flow Operating cash flow -360,919 206,753 1,340,677 -326,809 174,201 -27,223 Capital expenditure -166,438 -229,452 -514,357 -739,838 -668,717 -632,095 Free cash flow -527,357 -22,699 826,320 -1,066,647 -494,516 -659,318 ____________________________________________________________________________________________________________________________________________
Average to Current P/E Ratios |
              (FSLR)     First Solar Inc.

                               2015    2016    2017    2018    2019

          Annual Earnings:     5.37   -4.05   -1.59    1.36   -1.09
Average Price During Year:    51.22   51.64   40.27   59.54   56.98

                P/E Ratio:     9.54   12.75   25.33   43.78   52.28

 Average 5-Year P/E Ratio  =  28.73
             Current Price =  60.11

Previous 5 Quarter Earnings:  -0.64   -0.18    0.29   -0.56    0.85

          Current Annualized (Last Four Quarters) Earnings =   0.58
                                                           ________
                                 Average PE / Current PE =     0.28
                                                           --------

                                      ...a number above 1.00 is good
                                                1.00 or below is bad
Financial Ratios |
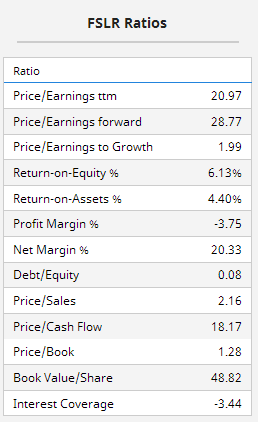
. . . . . . . . . . . . Lowest to Highest, Compared to Industry
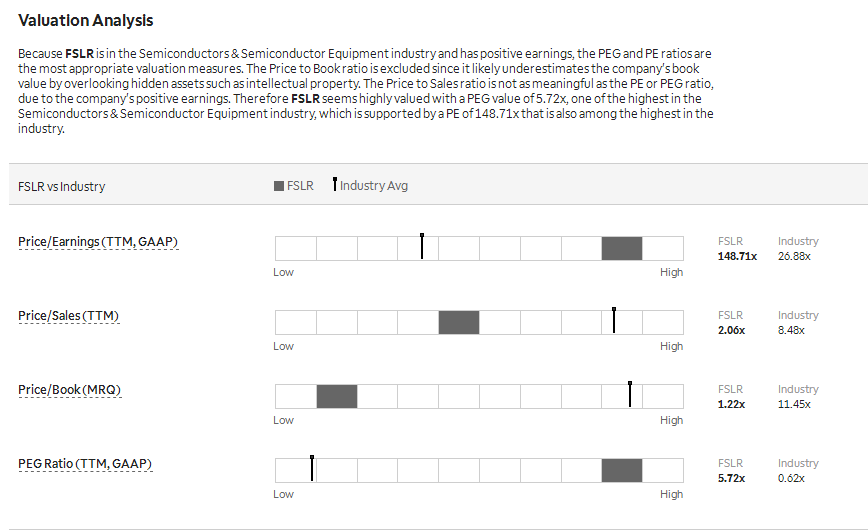
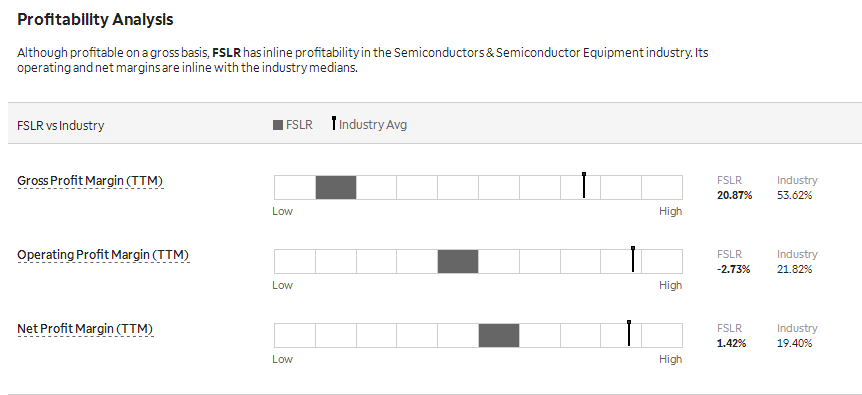
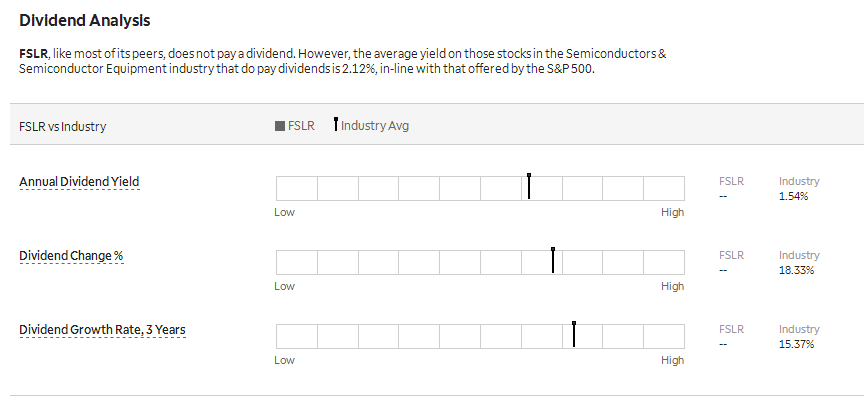
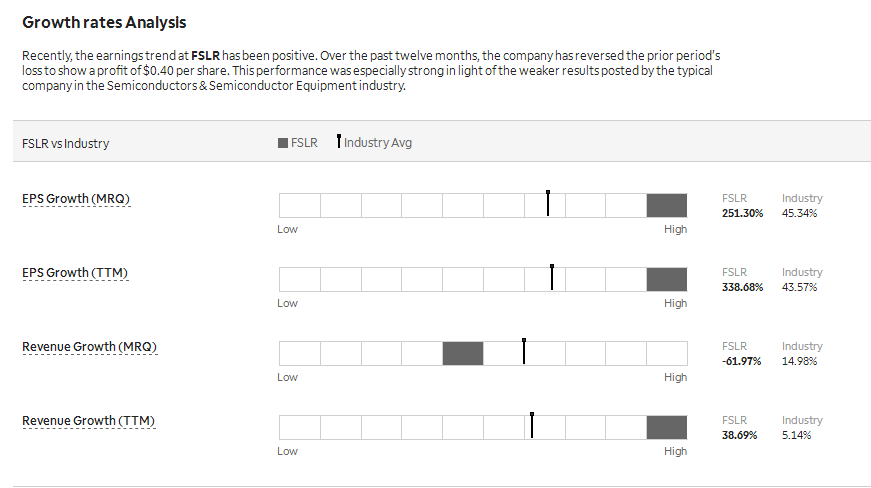
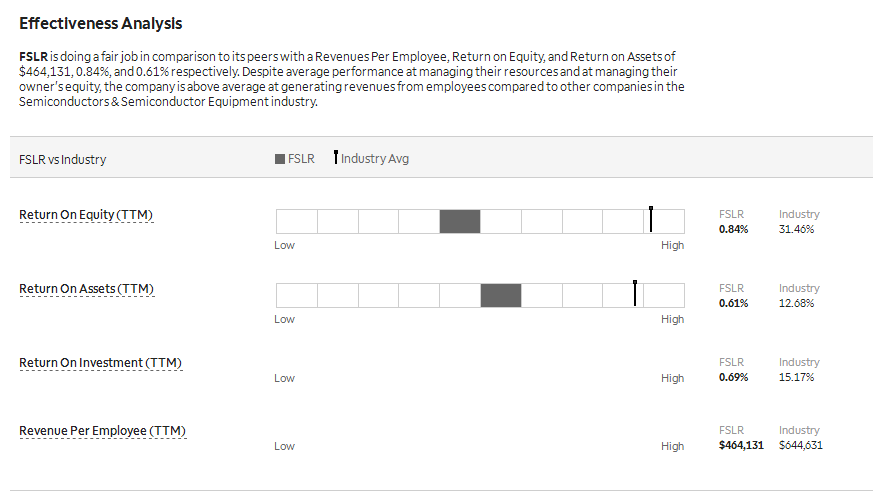
Intrinsic Value (DCF) |
Intrinsic Value by Discounted Cash Flow Method:
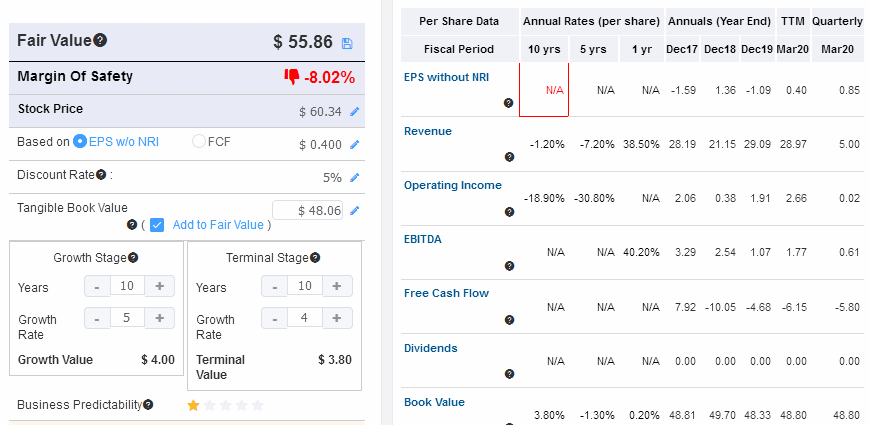
Fair Value Estimator |
Fair Value Estimate:
Projected Earnings |

Research Reports |
Analysts' Opinions |

Insider Activity |
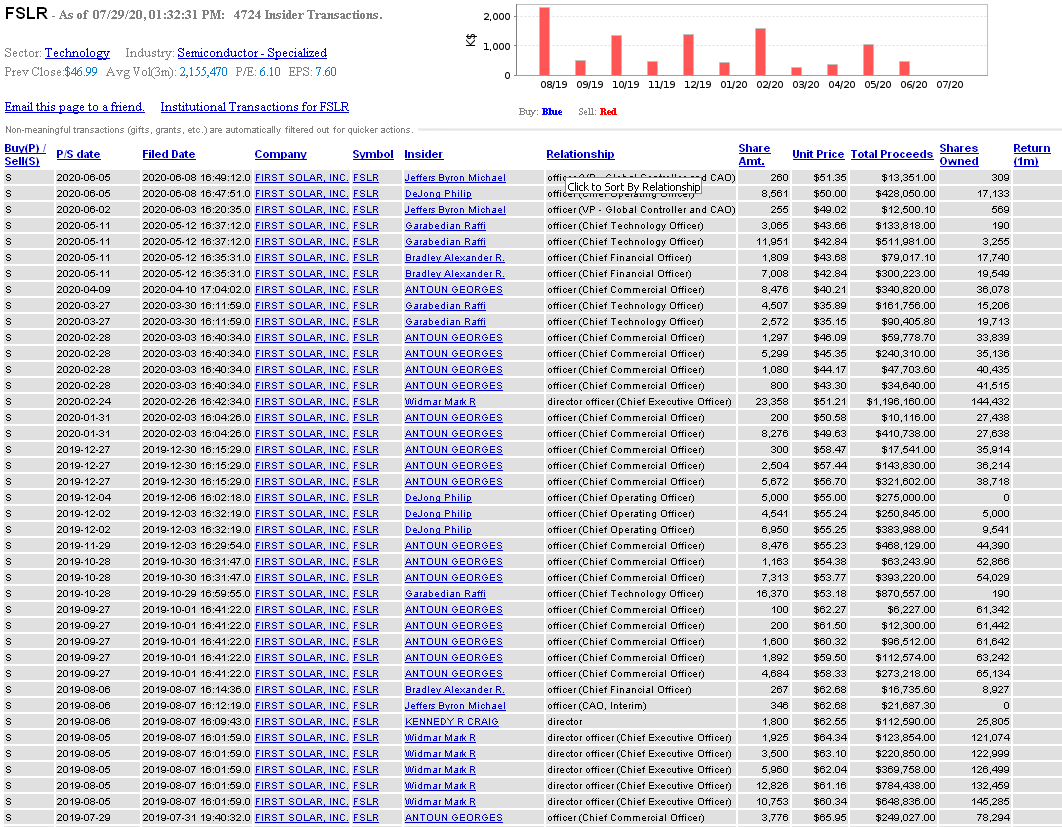
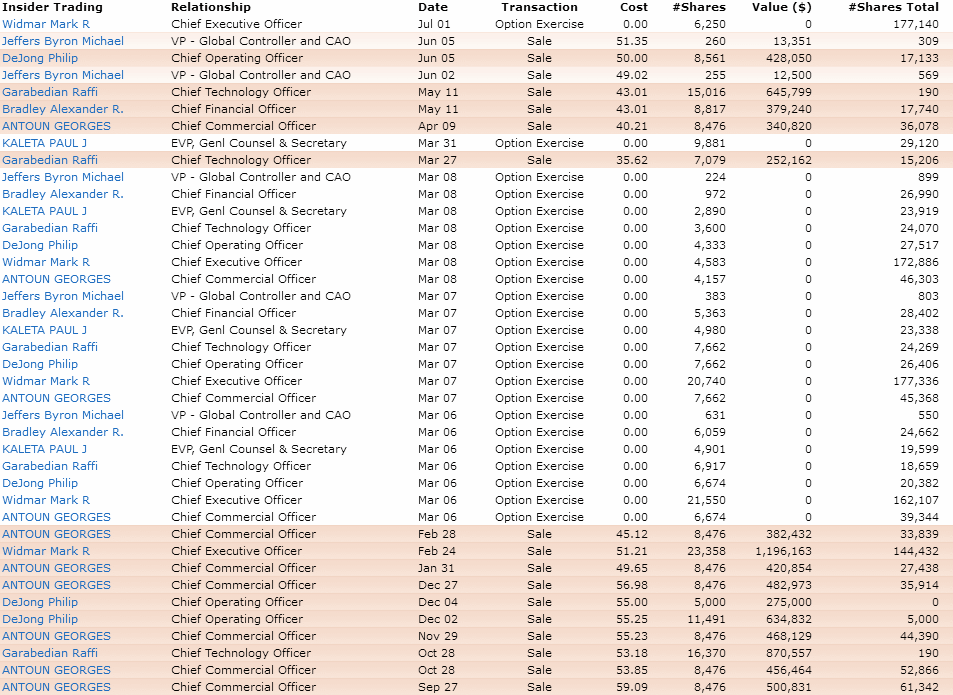
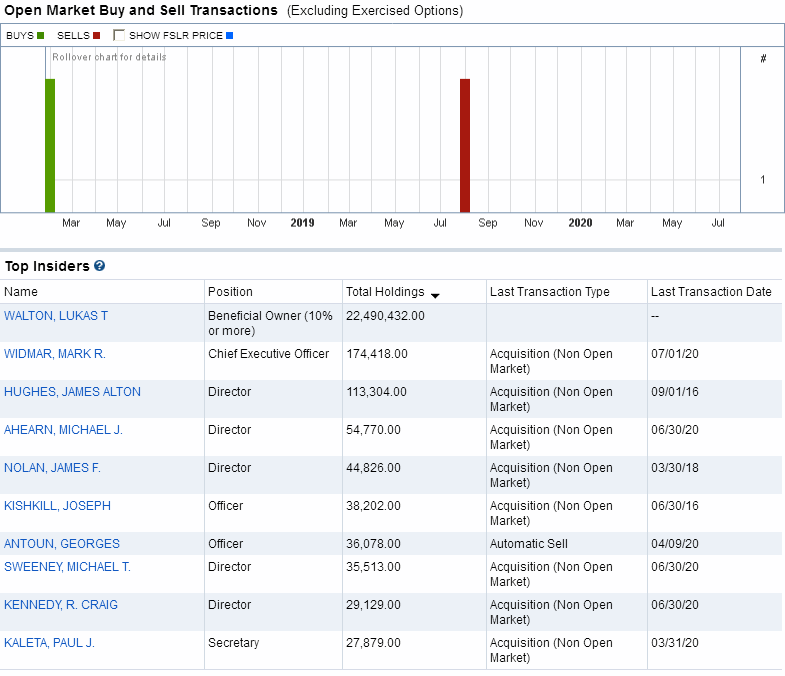
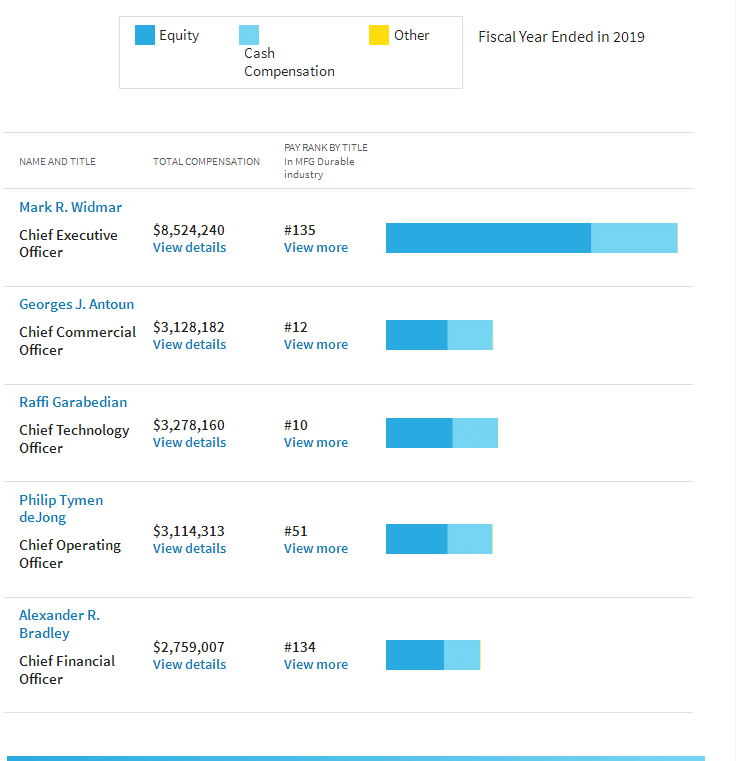
Institutional Activity |
Institutional Ownership:
Sentiment |
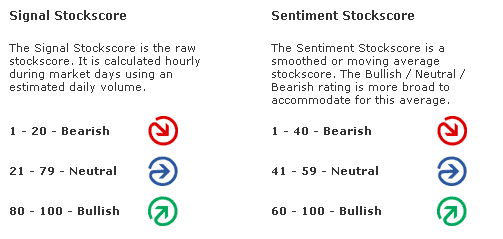
Zenith uses the "sentiment" score above or below 50 to award a positive or negative point in the Decision Matrix.


Short Interest Ratio |
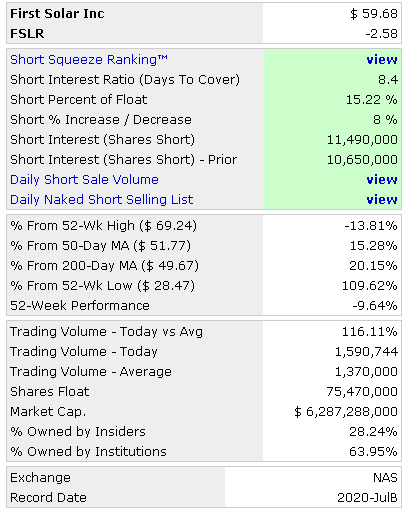
As the short interest rises as a percentage of average daily share volume (Days to Cover), this is considered a measure of negative sentiment. Similarly, a decrease in that percentage is considered positive sentiment.

Standard & Poor's |
Management's Discussion of Results of Operations Excerpts |
Channeling Potential |
The summary below includes a value for `Degree,' which refers on a
scale of 1 to 10 the range of a channel in the period under consi-
deration compared to the total range of price movement. It also looks
for the last closing price to be within the channel, otherwise zeroed.
The `Index' is the `Degree' weighted for volatility.  Generally, the
the higher the index, the more suitable is the stock for trading as
a `rolling stock' between channel high and low points.

Results for FIRST SOLAR INC.:
Symbol? FSLR
Total Months Available:  25
       Months in Cycle?   4

Months Covered by Periods:  12

Period 1           Period 2          Period 3
   H1      L1        H2      L2        H3      L3
  69.24   50.22     59.90   28.47     63.68   33.00

RANGE   =  69.24  TO   28.47            Close =  62.26
CHANNEL =  59.90  TO   50.22           Degree =   2
Volatility =  15.55%                    Index =   3
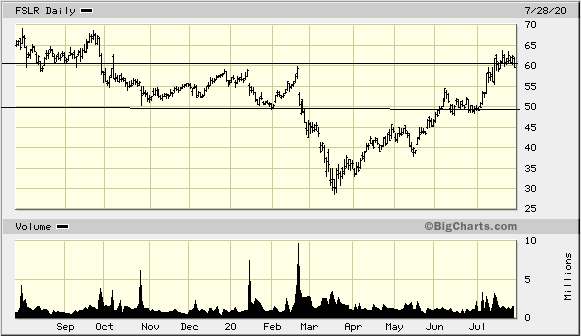
MACD Histogram Divergence |
The theory is that connecting the two most recent peaks or valleys of the MACD histogram will signal the direction of the next major move.
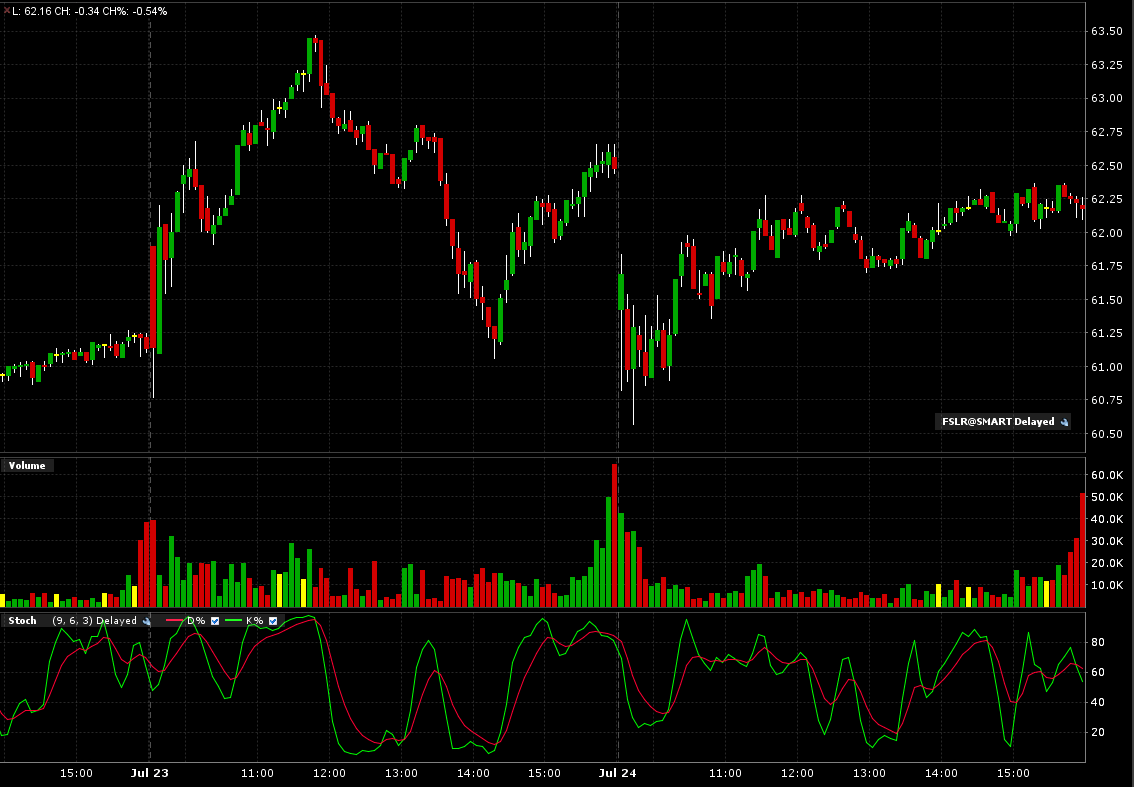
Intraday Chart |
2 Days:
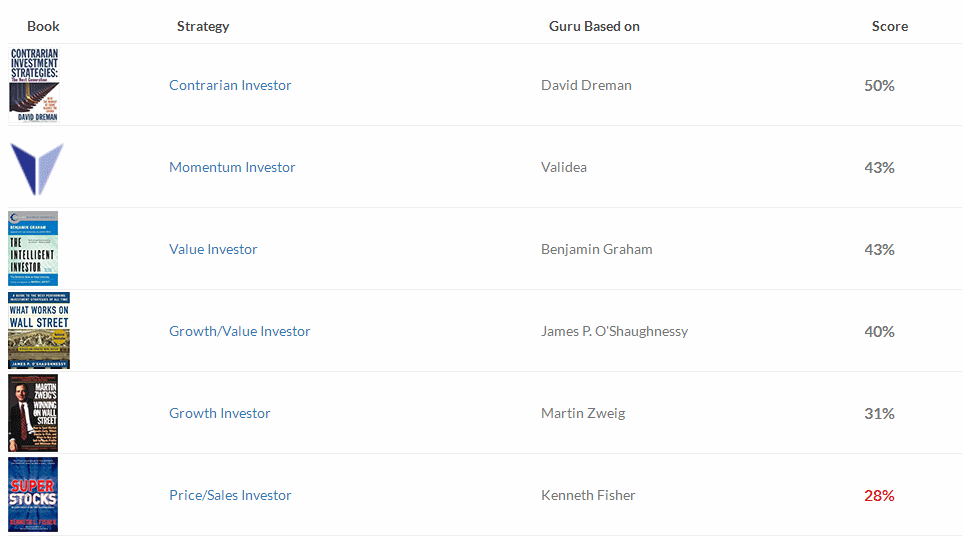
Val Idea |
1 out of 7 favorable, (negative opinion.)

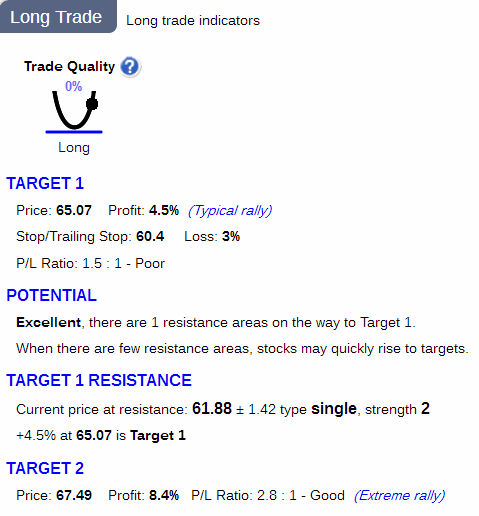
Stock Consultant |
Point & Figure Chart |
Wall Street Analyzer |
Marketspace Chart |
Time Series Forecast |
Neural Network Prediction |
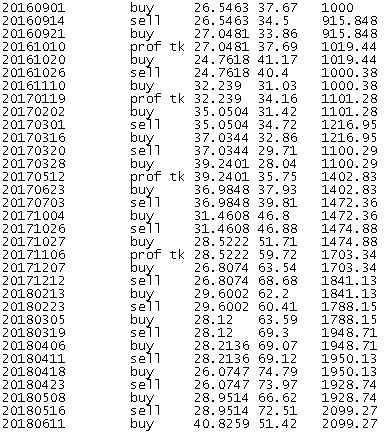
"Neurostock" can only track long trades. Therefore its performance, as tracked by itself on stocks which are consistently falling, may not appear as good as it could if each "sell" signal were a "short sale."

![]()

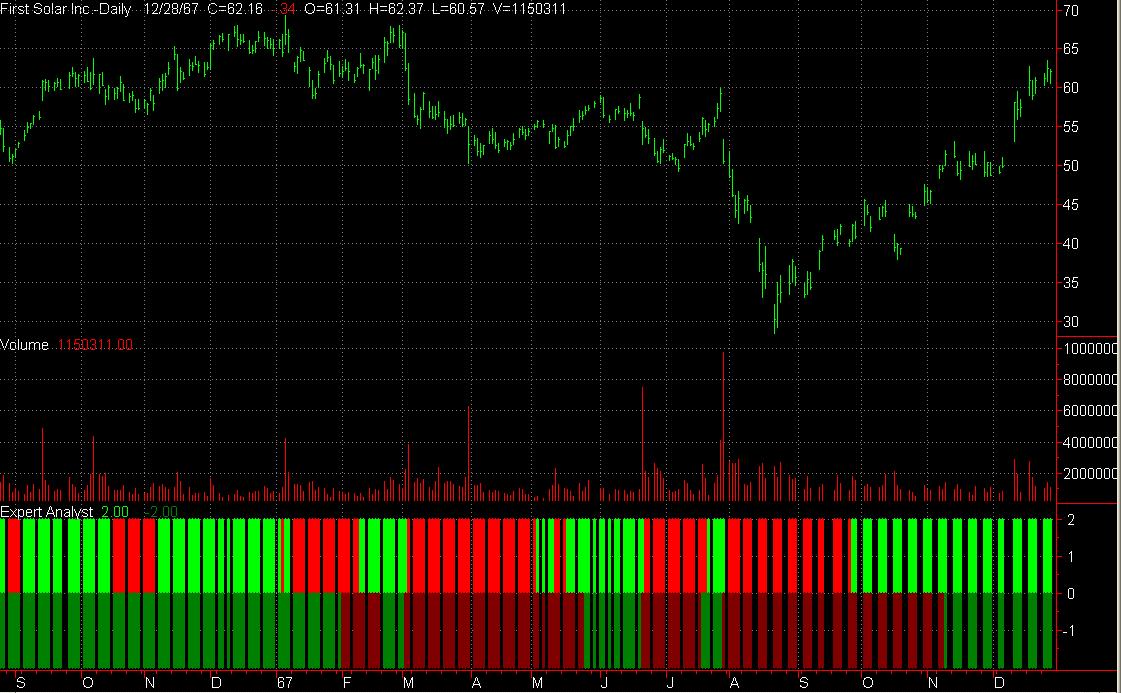
Ultimate Trading Systems |
2 out of 3 of the ultimate systems favor a downmove.
System Below:
Short term outlook: Positive: Bright Green, Negative: Bright Red
Long term outlook: Postive: Dark Green, Negative: Dark Red.

Recommendation |
| Factors | Weighted Points |
|---|---|
| News | + 1 |
| Comparison | - 1 |
| Industry | + 1 |
| Bond Issue | 0 |
| Zenith Index | - 1 |
| Non-GAAP vs. GAAP Earnings | - 1 |
| Cash Flow | - 1 |
| Average to Current P/E | - 1 |
| Ratios | + 1 |
| Intrinsic Value DCF | - 1 |
| Fair Value Estimator | - 1 |
| Projected Earnings | + 1 |
| Research Reports | - 1 |
| Analysts | + 1 |
| Executive Perquisites | - 1 |
| Insider Activity | - 1 |
| Institutional Activity | - 1 |
| Management Reporting | + 1 |
| Short Interest | - 1 |
| Sentiment | + 1 |
| Standard & Poor's | - 1 |
| MACD Histogram Divergence | + 1 |
| Val Idea | - 1 |
| Stock Consultant | - 1 |
| Point & Figure | + 1 |
| Wall Street Analyzer | + 1 |
| Marketspace Chart | + 1 |
| Time Series Chart | - 1 |
| Neural Network | - 1 |
| Stock Options | + 1 |
| Ultimate Trading Systems | - 1 |
| Total | - 6AA |
Place 500 shares of First Solar, Inc. (FSLR) on the Active List.