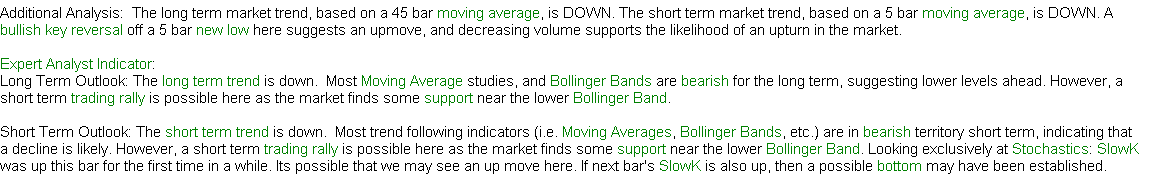
![]()
Corporate Webpages Delek US Holdings, Inc.
Delek US Holdings, Inc. (DK) is considered one of the best oil
and gas plays because of its financial strength. Standard &
Poor's gives it its highest rating, although most researchers
are negative on the stock. All oil and gas operations from all
companies are struggling now with lower oil prices. If oil
prices recover, this corporation will probably lead the upward
charge, but currently is in a downspin, and buyers should await
for more upward momentum to develop over a consistent period of time.
It is described as a "downstream" oil services operation
possibly because even though they are limited to Texas and New
Mexico, Delek is the largest U.S. franchiser of 7-Eleven
convenience stores usually located at gas stations. We think it
is better described as a "midstream" oil company where
"midstream" is defined as the processing and transportation of
oil and gas. Primary revenue sources are its pipelines. Its
operations are entirely domestic, centered around the Permian Basin.
Institutions are net sellers, but Dimensional Fund Advisors
(DFA) is prominent among them and it is acquiring. We regard that as a
good sign. (DFA analyzes and picks stocks in a manner which is
often similar to ours.)
News on the company is somewhat sparse, consisting mainly of
earnings reports, partnerships, borrowings, and few recent acquisitions.
It is not what we would call a story stock, but trades in a
range or channel near the bottom of its recent range.
Other things to note are a consistent dividend north of 3%, and
also a p/e ratio well below its historic average. When energy
recovers, we believe this stock will shoot up as fast as any.
08-18-2019: Delek US Holdings, Inc. (DK): Awaiting Oil Price Recovery
(WAIT FOR PAGE TO LOAD COMPLETELY BEFORE LINKS WORK.)
Company Profile
Company History
News
Comparison with Peers
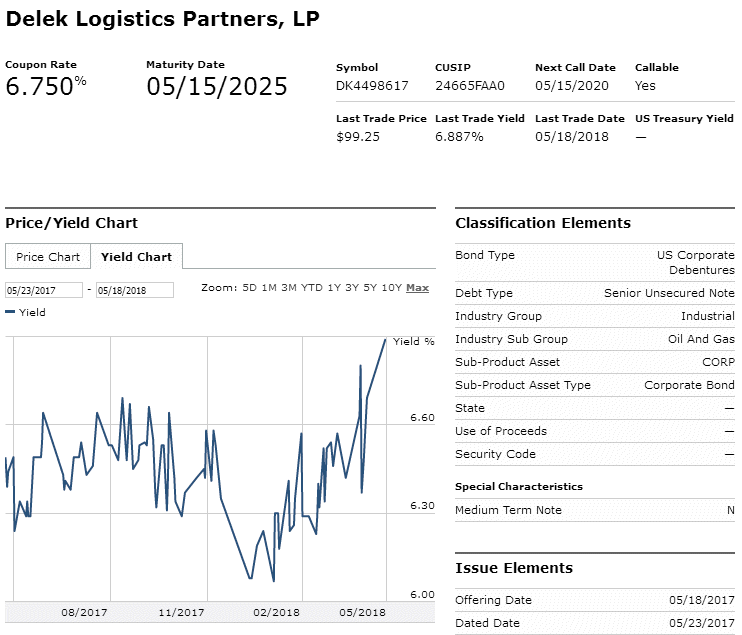
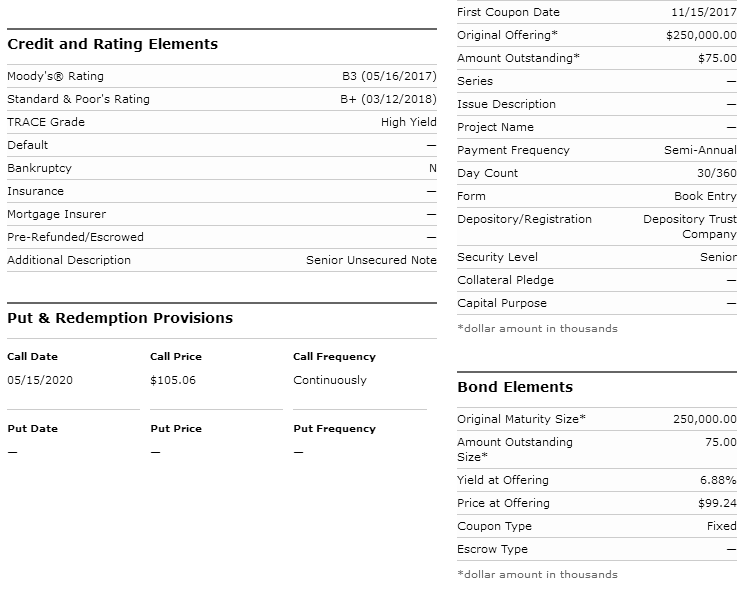
Bond Issue
Zenith Index
Financial Statements
Avg. P/E to Current P/E
Financial Ratios
Intrinsic Value (Disc. CashFlow)
Fair Value Estimator
Projected Earnings
Research Reports
Analysts' Opinions
Insider Activity
Institutional Activity
Sentiment
Short Interest
Standard & Poor's
Management's Discussion
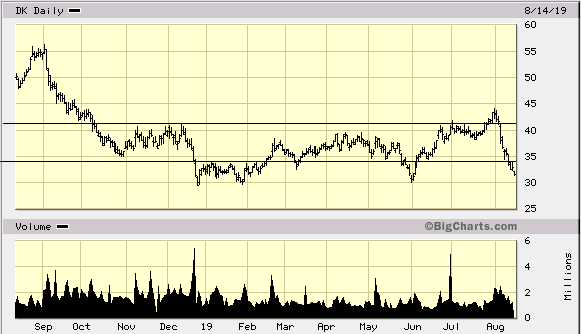
Channel Potential
MACD Histogram
Intraday Chart
Val Idea
Stock Consultant
Point & Figure Chart
Wall Street Analyzer
Marketspace Chart
Time Series Forecast
Neural Network Prediction
Stock Options
Ultimate Trading Systems
Recommendation
Corporate Wepages


Company Profile |
Company History |
News |
Comparison |
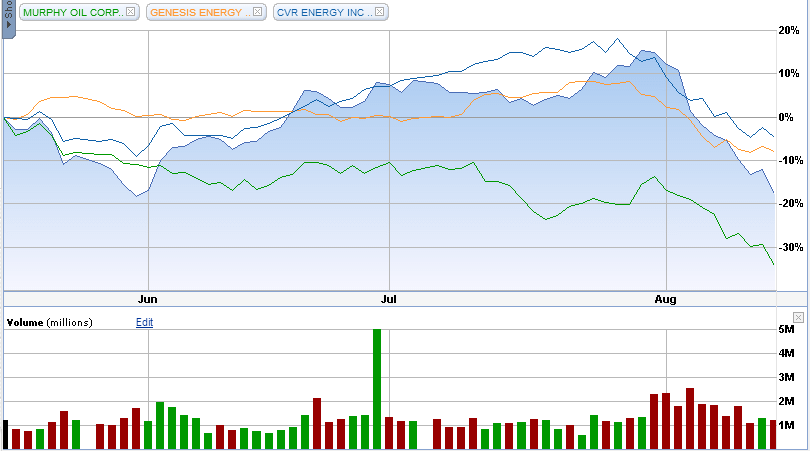
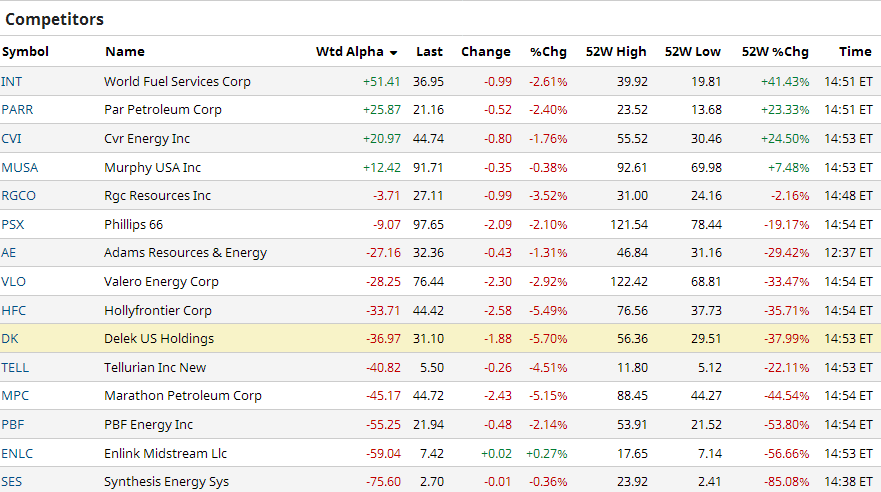
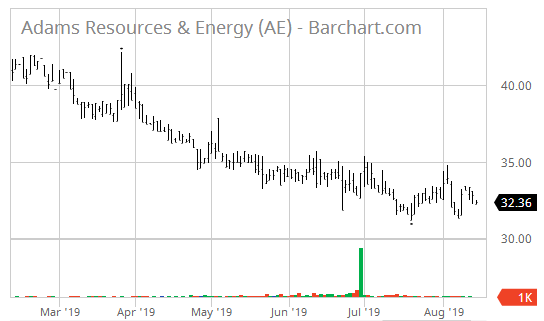
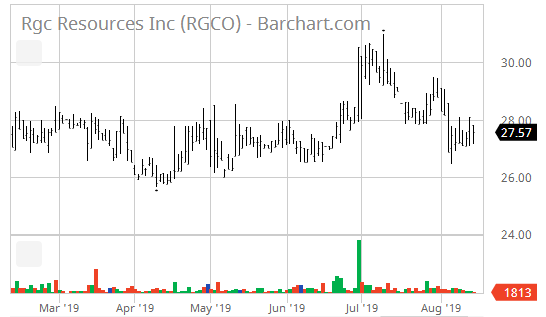
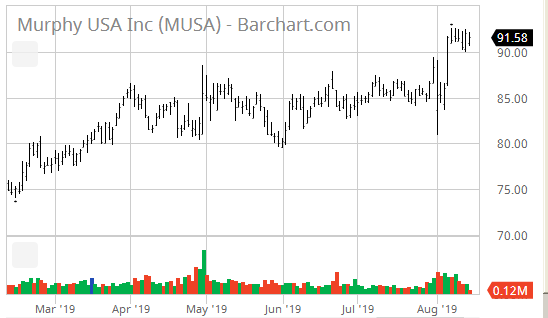
Similar Companies Performance:
Bond Issue |
Zenith Index |
Under current market conditions, a Zenith Index Score of 1.20 or above is required for a positive rating on this factor. 1.21 -1.30 is considered acceptable, 1.30-1.40 is considered strong and
> 1.40 is considered exceptionally strong. Accounting statements in this section often contain mistakes, especially in earlier years' totals, but data is deemed sufficient for us to give a rating. More accurate financial statements follow in the next section.
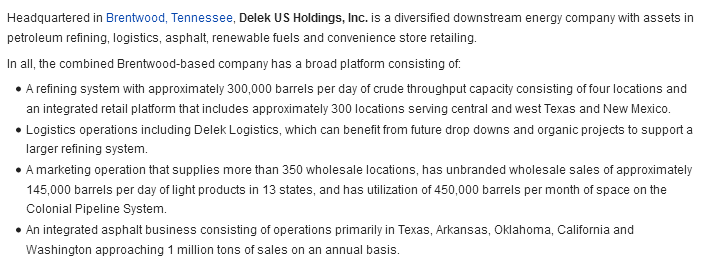
Delek US Holdings, Inc. (DK) Exchange: NYSE
7102 Commerce Way
Brentwood, TN 37027 Sector: Energy
United States Industry: Oil & Gas Refining & Marketing
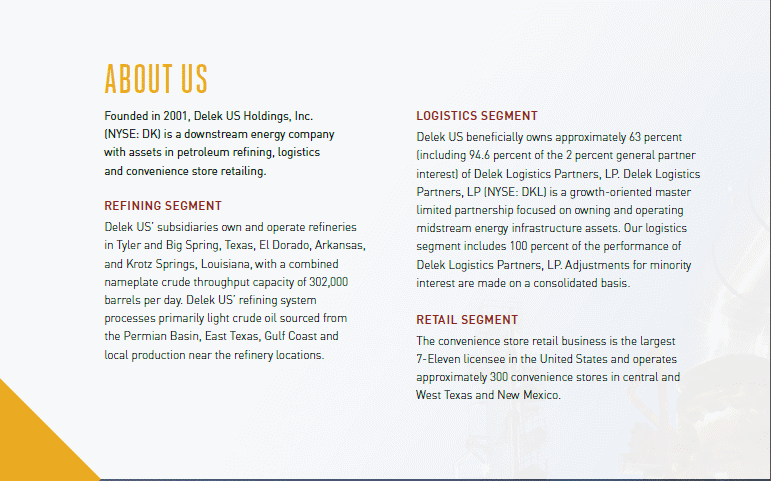
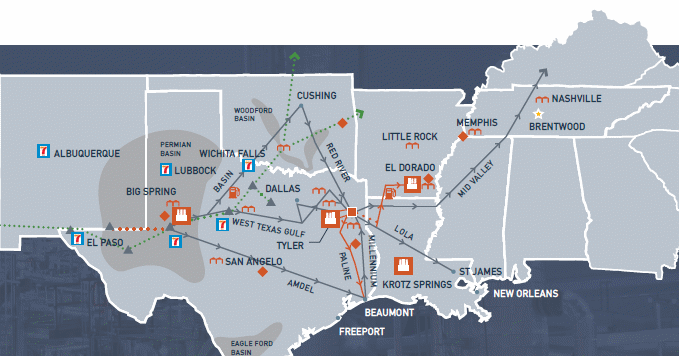
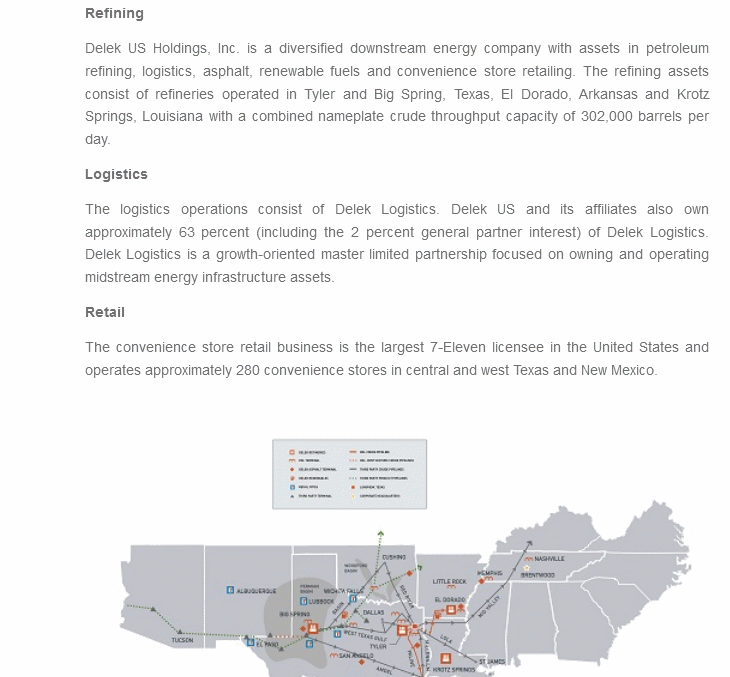
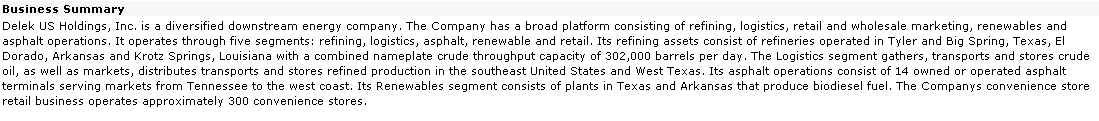
Delek US Holdings, Inc. engages in the integrated downstream energy
business in the United States. The company's Refining segment processes
crude oil and other purchased feedstocks for the manufacture of various
grades of gasoline, diesel fuel, aviation fuel, asphalt, and other
petroleum-based products that are distributed through owned and
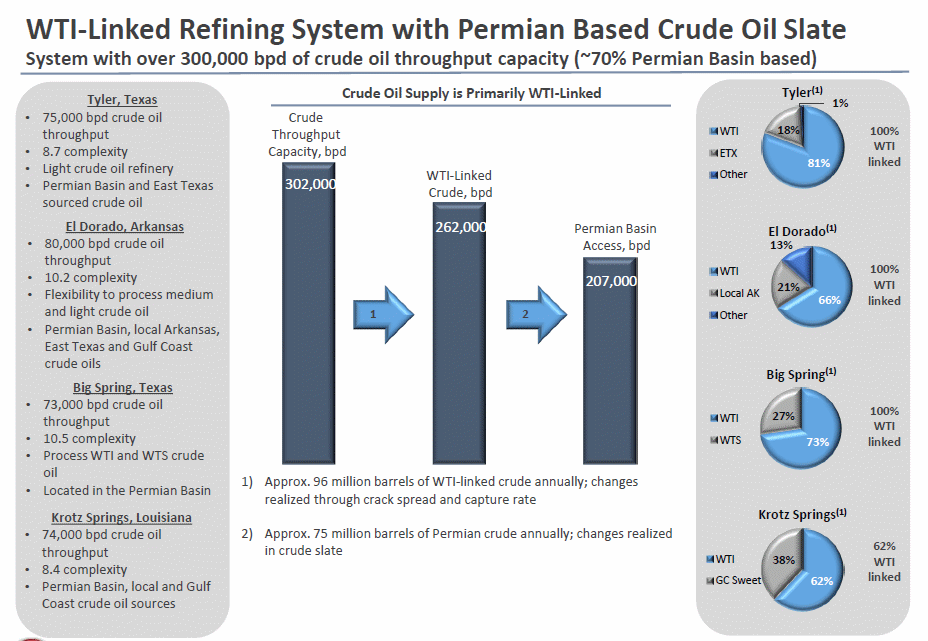
third-party product terminals. This segment owns and operates four
independent refineries located in Tyler, Texas; El Dorado, Arkansas; Big
Spring, Texas; and Krotz Springs, Louisiana. This segment also owns and
operates two biodiesel facilities in Crossett, Arkansas, and Cleburne,
Texas; and a crude oil refinery. Its Logistics segment gathers,
transports, and stores crude oil, intermediate, and refined products;
and markets, distributes, transports, and stores refined products for
third parties. This segment owns or leases capacity on approximately 400
miles of crude oil transportation pipelines, approximately 450 miles of
refined product pipelines, an approximately 600-mile crude oil gathering
system, and associated crude oil storage tanks with an aggregate of
approximately 9.6 million barrels of active shell capacity; and owns and
operates nine light product terminals, as well as markets light products
using third-party terminals. The company's Retail segment owns and
leases 279 convenience store sites located primarily in Texas and New
Mexico. This segment's convenience stores offer various grades of
gasoline and diesel under the Alon brand name; and food products and
service, tobacco products, beverages, and general merchandise, as well
as money orders to the public under the 7-Eleven and Alon brand names.
The company serves oil companies, independent refiners and marketers,
jobbers, distributors, utility and transportation companies, independent
retail fuel operators, and the U.S. government. Delek US Holdings, Inc.
was founded in 2001 and is headquartered in Brentwood, Tennessee.
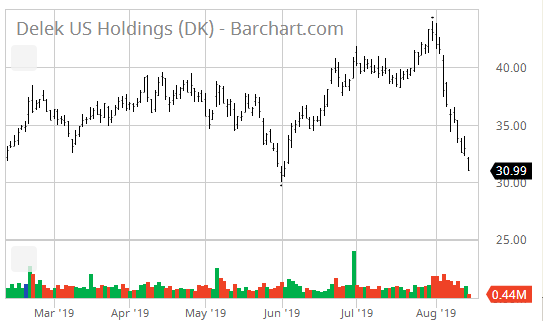
Last Trade: 32.58 52-Week Range: 56.36 - 29.51
Employees: 3,717 Avg.Volume: 1,309,756 Shares
Corporate Governance:
Pillar scores are Audit: 2; Board: 5; Shareholder Rights: 6; Compensation: 2.
(A lower number means less governance risk.)
EPS: 6.41 Dividend Amount: $ 1.16 Yield: 3.56%
Ex-Dividend Date: Aug 15, 2019 Payout Ratio: 16.54
Key Statistics:
Trailing P/E: 5.15 Forward P/E (est.): 9.14
Target Price: 44.62
Qrtly Stock Price Growth (yoy): -32.31% Beta: 0.00
Qrtly S&P Index Growth (yoy): 0.00% Short Ratio: 4.10%
Qrtly Revenue Growth (yoy): 2.32% Shares Out: 76860000
Qrtly Earnings Growth (yoy): 0.00%
Book Value: 0.00 Debt/Equity: 0.00%
Price/Book Value: 1.45 Operating Profit Margin: 0.00%
Price/Sales: 0.25 Profit Margin: 0.00%
Market Cap: 2,485,000,000 Return on Equity: 0.00%
Enterprise Value: 3,830,000,000 Return on Assets: 0.00%
Operating Cash Flow: 560,300
Free Cash Flow: 137,400
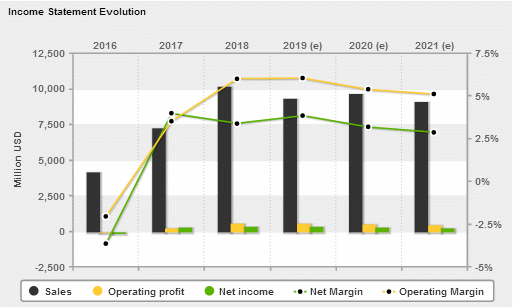
Annual Income Statement: (All numbers in thousands)
Period Ending 12/31/2018 12/31/2017 12/31/2016
Total Revenue 10,233,100 7,267,100 4,197,900
Cost of Revenue 9,099,000 6,670,100 4,059,900
Gross Profit 1,134,100 597,000 138,000
Operating Expenses:
Research & Development 0 0 0
Selling, General & Administrative 342,200 198,400 105,400
Non-Recurring Expenses 0 0 0
Other Operating Expenses -30,400 -30,400 -30,400
Total Operating Expenses 9,610,200 7,021,800 4,281,700
Operating Income or Loss 622,900 245,300 -83,800
Income from Continuing Operations:
Total Other Income/Expenses Net -137,400 54,000 -307,400
Earnings Before Interest & Taxes 622,900 245,300 -83,800
Interest Expense -125,900 -93,800 -54,400
Income Before Taxes 485,500 299,300 -391,200
Income Tax Expense 101,900 -29,200 -171,500
Minority Interest 175,500 313,600 190,600
Net Income from Continuing Op.s 383,600 328,500 -219,700
Non-recurring Events:
Discontinued Operations -8,700 -5,900 86,300
Extraordinary Items 0 0 0
Effect of Accounting Changes 0 0 0
Other Items 0 0 0
Net Income 340,100 288,800 -153,700
Preferred Stock & Other Adjustments 0 0 0
Net Income Avail to Common Shares 340,100 288,800 -153,700
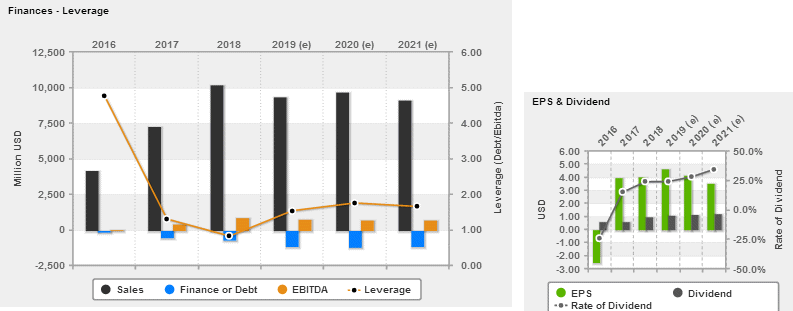
Annual Cash Flow Statement: (All numbers in thousands)
Period Ending 12/31/2018 12/31/2017 12/31/2016
Net Income 383,600 328,500 -219,700
Operating Activities:
Depreciation 199,000 148,700 116,000
Adjustments to Net Income 27,300 -190,100 102,800
Changes in Accounts Recv'bls 112,700 -155,800 -48,100
Changes in Liabilities -128,100 290,900 223,800
Changes in Investories 138,700 -191,100 -56,500
Changes in other Oper'g Acts -138,000 120,000 59,300
Total Cash Flow f Operations 560,300 319,700 248,000
Investing Activities:
Capital Exenditures -322,000 -172,000 -46,300
Investments 1,000 6,600 -41,400
Other Cash Flows fr Investing 20,000 12,200 288,900
Total Cash Flows from Investing -125,300 37,600 200,700
Financing Activities:
Dividends Paid -80,100 -44,000 -37,500
Sale of Purchase of Stock 0 0 0
Net Borrowings 236,700 18,700 32,500
Other Cash Flows fr Financing -77,400 -49,300 288,900
Total Cash Flows from Financing -297,600 -104,600 -61,700
Effect of Exchange Rate Chg 0 0 0
Change in Cash & Cash Equiv. 137,400 252,700 387,000
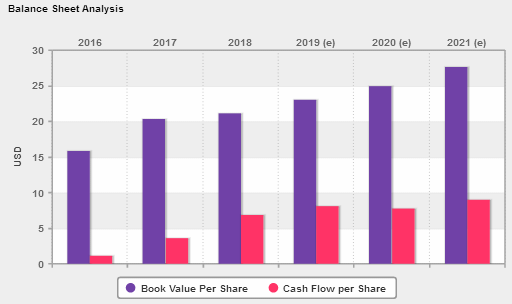
Annual Balance Sheets: (All Numbers in Thousands)
Period Ending 12/31/2018 12/31/2017 12/31/2016
Current Assets:
Cash & Cash Equivalents 1,079,300 931,800 689,200
Short Term Investments 0 0 0
Net Receivables 538,700 656,600 285,200
Inventory 690,900 808,400 392,400
Other Current Assets 95,600 197,400 16,100
Total Current Assets 2,420,300 2,611,800 1,396,900
Long-Term Investments 130,300 138,100 360,000
Property, Plant & Equipt 2,194,900 2,140,800 1,103,300
Goodwill 857,800 816,600 12,200
Intangible Assets 104,400 101,100 26,700
Accumulated Amortization 0 0 0
Other Assets 52,900 126,800 80,700
Deferred LT Asset Charges 0 0 0
Total Assets 5,760,600 5,935,200 2,979,800
Current Liabilities:
Accounts Payable 1,009,700 973,900 494,600
Current Portion LT Debt 32,000 590,200 84,400
Other Current Liabilities 542,200 947,200 325,300
Total Current Liabilities 1,663,500 2,671,700 935,200
Long Term Debt 1,751,300 876,300 748,500
Other Liabilities 537,700 423,000 113,600
Deferred LT Liab. Charges 10,600 5,900 8,200
Minority Interest 175,500 313,600 190,600
Negative Goodwill 0 0 0
Total Liabilities 3,952,500 3,971,000 1,797,300
Stockholder Equity:
Misc. Options, Warrants 0 0 0
Redeemable Preferred Stock 0 0 0
Preferred Stock 0 0 0
Common Stock 900 800 700
Retained Earnings 981,800 767,800 522,300
Treasury Stock -485,500 -18,100 -181,600
Capital Surplus 1,135,400 900,100 650,500
Other Stockhohlder Equity 28,600 6,900 -20,800
Total Stockholder Equity 1,632,600 1,650,600 991,900
Net Tangible Assets 670,400 732,900 953,000
Delek US Holdings, Inc. (DK) [Indices near +3.0, near zero,
or < zero bear special attention.]
P/E Ratio Tests:
P/E Ratio < 28? 3.0000 P/E Ratio > 5? 1.0000
P/E Ratio Vs Growth Rate: 0.0000 Forward P/E Ratio < 28? 3.0000
Price/Sales Ratio < 2.3? 3.0000 Inventory/Sales < 5%? 0.7406
Sales < $1 Billion? 0.0977 Operating Margin < 7.5%? 0.0000
Balance Sheet Tests:
Debt/Equity < 0.40? 1.0000 Long-Term Debt Service: 1.0324
LTD Being Reduced? -3.0000 Short-Term Debt Service: -3.0000
Current Ratio > 2? 0.7275 Working Capital >= 1.5? 1.0447
Leverage Ratio < 20%? 0.2764 Debt/Assets < 1? 3.0000
Quick Ratio > 1? 3.0000 Inventory Turnover > 1? 0.0719
Share Equity Increase: 2.6532 Market Cap.< 1.5 Billion? 0.6036
Intangibles < 3% Assets? 0.1796
Income Tests:
Profit Margin < 7.5%? 0.0000 EPS Annual Growth > 10%? 0.0849
Dividend Yield > 2.0%? 0.5618 EPS 3-yr Growth > 15? -0.0678
Enterprise Value/Revenue 0.2429 EPS Growth Consistent? 2.0000
Enterprise Value/EBITDA: 3.0000 Collection < 45 days? 2.3420
EPS Qrtly Growth > 10%? 0.0000 Gross Pft/Cur. LTD > 1? 3.0000
Borrowing Int. Rate < 6%? -0.8346
Stock Performance Tests:
Volatility > 25%? 1.9056 % Held by Insiders < 5%? 2.0833
Beta > 1.25? 0.0000 % Held by Institut. < 50? 0.4787
50 Da MA > 200 Da MA? 0.2569 % Held by Institut. > 30? 3.0000
52-Wk Change vs. S&P 500: -3.0000 Short Ratio > 5? 0.8200
Price/Book Value < 3? 3.0000 Short % of Float > 20? 0.3920
Return on Assets > 17%? 0.0000 Average Volume > 100,000? 3.0000
Cash Flow Tests:
Oper. C.F. > Lever'd C.F: 3.0000 Positive Free Cash Flow? 3.0000
Positive Oper. Cash Flow? 3.0000 Price to C.F.Ratio < 14?: 3.0000
Cash Flow / Assets > 10%? 1.7068
DK Delek US Holdings, Inc. Overall Zenith Index: 1.1102
Financial Statements |
DELEK US HOLDINGS INC  (DK)                 INCOME STATEMENT

Fiscal year ends in December.                        2014-12         2015-12         2016-12         2017-12         2018-12             TTM

Revenue                                        8,324,299,776   5,761,999,872   4,197,900,032   7,267,100,160  10,233,100,288   9,923,200,000
Cost of revenue                                7,713,999,872   5,422,199,808   4,062,200,064   6,756,599,808   9,260,300,288   8,750,499,840
Gross profit                                     610,300,032     339,800,000     135,700,000     510,500,000     972,800,000   1,172,700,032


Operating expenses
Sales, General and administrative                133,400,000     126,000,000     106,100,000     169,800,000     247,600,000     261,200,000
Other operating expenses                         110,400,000     133,100,000     121,200,000     154,300,000     113,300,000     116,800,000
Total operating expenses                         243,800,000     259,100,000     227,300,000     324,100,000     360,900,000     378,000,000

Operating income                                 366,500,000      80,700,000     -91,600,000     186,400,000     611,900,032     794,700,032
Interest Expense                                  40,600,000      58,300,000      54,400,000      93,800,000     125,900,000     123,400,000
Other income (expense)                             1,700,000       4,700,000    -245,200,000     206,700,000        -500,000      32,100,000
Income before taxes                              327,600,000      27,100,000    -391,200,000     299,300,000     485,500,000     703,400,000
Provision for income taxes                       101,600,000     -16,600,000    -171,500,000     -29,200,000     101,900,000     151,000,000
Net income from continuing operations            226,000,000      43,700,000    -219,700,000     328,500,000     383,600,000     552,400,000
Net income from discontinuing ops                          0               0      86,300,000      -5,900,000      -8,700,000        -500,000
Other                                            -27,400,000     -24,300,000     -20,300,000     -33,800,000     -34,800,000     -23,900,000
Net income                                       198,600,000      19,400,000    -153,700,000     288,800,000     340,100,000     528,000,000
Net income available to common shareholders      198,600,000      19,400,000    -153,700,000     288,800,000     340,100,000     528,000,000

Earnings per share
Basic                                                   3.38            0.32           -2.49            4.04            4.11            6.59
Diluted                                                 3.35            0.32           -2.49            4.00            3.95            6.41

Weighted average shares outstanding
Basic                                             58,780,948      60,819,772      61,921,788      71,566,224      82,797,112      79,817,584
Diluted                                           59,355,120      61,320,568      61,921,788      72,303,080      86,768,400      82,823,248

____________________________________________________________________________________________________________________________________________


DELEK US HOLDINGS INC  (DK)                 BALANCE SHEET

Fiscal year ends in December.                        2014-12         2015-12         2016-12         2017-12         2018-12

Assets

Current assets

Cash

Total cash                                       444,100,000     302,200,000     689,200,000     931,800,000   1,079,299,968

Receivables                                      197,000,000     233,000,000     265,900,000     579,600,000     514,400,000
Inventories                                      469,600,000     307,600,000     392,400,000     808,400,000     690,899,968
Prepaid expenses                                           0               0      14,000,000      17,600,000      15,800,000
Other current assets                             136,700,000     146,000,000      40,700,000     274,400,000     119,900,000
Total current assets                           1,247,399,936     988,800,000   1,402,200,064   2,611,800,064   2,420,300,032

Non-current assets

Property, plant and equipment
Gross property, plant and equipment            1,958,400,000   2,100,099,968   1,587,600,000   2,772,499,968   2,999,600,128
Accumulated Depreciation                        -509,600,000    -579,000,000    -484,300,000    -631,699,968    -804,700,032
Net property, plant and equipment              1,448,800,000   1,521,100,032   1,103,299,968   2,140,800,000   2,194,899,968

Equity and other investments                               0     605,200,000     360,000,000     138,100,000     130,300,000
Goodwill                                          73,900,000      74,400,000      12,200,000     816,600,000     857,800,000
Intangible assets                                 16,200,000      27,300,000      26,700,000     101,100,000     104,400,000
Other long-term assets                           105,100,000     108,100,000      80,700,000     126,800,000      52,900,000
Total non-current assets                       1,644,000,000   2,336,100,096   1,582,899,968   3,323,399,936   3,340,300,032

Total assets                                   2,891,399,936   3,324,900,096   2,985,100,032   5,935,200,256   5,760,600,064

Liabilities and stockholders' equity

Liabilities

Current liabilities
Short-term debt                                   56,400,000      95,200,000      84,400,000     590,200,000      32,000,000
Accounts payable                                 477,000,000     397,600,000     494,600,000     973,400,000   1,009,699,968
Taxes payable                                              0               0     115,700,000     154,100,000     126,000,000
Accrued liabilities                              122,900,000     134,900,000      16,900,000      69,000,000      67,300,000
Other current liabilities                        200,900,000     132,000,000     228,900,000     885,000,000     428,500,000
Total current liabilities                        857,200,000     759,699,968     940,499,968   2,671,699,968   1,663,500,032

Non-current liabilities
Long-term debt                                   533,300,000     880,499,968     748,499,968     875,400,000   1,751,299,968
Deferred taxes liabilities                       266,300,000     247,900,000      76,200,000     199,900,000     210,200,000
Minority interest                                196,700,000     200,600,000     190,600,000     313,600,000     175,500,000
Other long-term liabilities                       36,200,000      82,900,000      37,400,000     224,000,000     327,500,000
Total non-current liabilities                  1,032,499,968   1,411,900,032   1,052,700,032   1,612,899,968   2,464,499,968

Total liabilities                              1,889,699,968   2,171,599,872   1,993,200,000   4,284,600,064   4,128,000,000

Stockholders' equity

Common stock                                         600,000         700,000         700,000         800,000         900,000
Additional paid-in capital                       395,100,000     639,200,000     650,499,968     900,099,968   1,135,399,936
Retained earnings                                731,200,000     713,500,032     522,300,000     767,800,000     981,800,000
Treasury stock                                  -112,600,000    -154,800,000    -160,800,000     -25,000,000    -514,100,000
Accumulated other comprehensive income           -12,600,000     -45,300,000     -20,800,000       6,900,000      28,600,000
Total stockholders' equity                     1,001,699,968   1,153,299,968     991,900,032   1,650,599,936   1,632,600,064
Total liabilities and stockholders' equity     2,891,399,936   3,324,900,096   2,985,100,032   5,935,200,256   5,760,600,064

____________________________________________________________________________________________________________________________________________


DELEK US HOLDINGS INC  (DK)                 Statement of CASH FLOW

Fiscal year ends in December. USD.                   2014-12         2015-12         2016-12         2017-12         2018-12             TTM

Cash Flows From Operating Activities
Net income                                       226,000,000      43,700,000    -219,700,000     328,500,000     383,600,000     552,400,000
Depreciation & amortization                      111,500,000     134,000,000     116,400,000     153,300,000     199,400,000     199,100,000
Amortization of debt discount/premium and is      -2,700,000               0        -700,000      -5,800,000      -3,700,000      -1,500,000
Investment/asset impairment charges                        0       2,200,000     245,300,000               0      27,500,000               0
Investments losses (gains)                                 0      15,100,000      20,200,000      18,300,000       8,800,000      10,700,000
Deferred income taxes                             38,800,000      18,700,000    -153,200,000     -48,000,000     -26,800,000      54,500,000
Stock based compensation                          13,900,000      16,800,000      16,400,000      17,500,000      21,400,000      22,800,000
Change in working capital                        -72,900,000     -52,400,000     178,500,000      64,000,000     -14,700,000     103,400,000
Accounts receivable                               55,400,000     -36,500,000     -48,100,000    -155,800,000     112,700,000     -42,200,000
Inventory                                        217,000,000     114,000,000     -53,700,000    -191,100,000     138,700,000      -7,600,000
Accounts payable                                -117,300,000     -75,800,000     221,000,000     290,900,000    -128,100,000     177,800,000
Other working capital                           -228,000,000     -54,100,000      59,300,000     120,000,000    -138,000,000     -24,600,000
Other non-cash items                               2,300,000       1,900,000      65,000,000    -195,700,000     -35,200,000      -9,300,000
Net cash provided by operating activities        316,900,000     180,000,000     268,200,000     332,100,000     560,300,032     932,099,968

Cash Flows From Investing Activities
Investments in property, plant, and equipmen    -256,900,000    -214,100,000     -46,300,000    -172,000,000    -322,000,000    -379,400,000
Property, plant, and equipment reductions                  0               0               0               0      11,100,000      11,100,000
Acquisitions, net                                -33,800,000        -400,000               0     196,200,000     166,300,000      21,600,000
Purchases of investments                                   0    -240,900,000     -61,600,000      -5,800,000        -200,000    -136,400,000
Sales/Maturities of investments                            0               0               0               0       1,200,000       1,300,000
Purchases of intangibles                                   0      -7,200,000        -700,000      -5,500,000      -1,700,000      -1,200,000
Other investing activities                         1,300,000       2,200,000     289,100,000      12,300,000      20,000,000      14,500,000
Net cash used for investing activities          -289,400,000    -460,400,000     180,500,000      25,200,000    -125,300,000    -468,500,000

Cash Flows From Financing Activities
Debt issued                                    1,205,100,032     895,600,000     465,800,000   1,460,800,000   2,815,200,000   1,808,999,936
Debt repayment                                -1,025,400,000    -650,800,000    -433,300,000  -1,442,099,968  -2,578,500,096  -1,932,800,000
Common stock repurchased                         -74,700,000     -42,200,000      -6,000,000     -25,000,000    -365,300,000    -354,800,000
Excess tax benefit from stock based compe          1,800,000       1,300,000       1,200,000       1,400,000       2,200,000       3,900,000
Dividend paid                                    -59,200,000     -37,100,000     -37,500,000     -44,000,000     -80,100,000     -84,800,000
Other financing activities                       -31,000,000     -28,300,000     -51,900,000     -55,700,000     -91,100,000     -85,500,000
Net cash provided by (used for) financing         16,600,000     138,500,000     -61,700,000    -104,600,000    -297,600,000    -645,000,000

Net change in cash                                44,100,000    -141,900,000     387,000,000     252,700,000     137,400,000    -181,400,000
Cash at beginning of period                      400,000,000     444,100,000     302,200,000     689,200,000     941,900,032   1,132,800,000
Cash at end of period                            444,100,000     302,200,000     689,200,000     941,900,032   1,079,299,968     951,400,000

Free Cash Flow
Operating cash flow                              316,900,000     180,000,000     268,200,000     332,100,000     560,300,032     932,099,968
Capital expenditure                             -256,900,000    -221,300,000     -47,000,000    -177,500,000    -323,700,000    -380,600,000
Free cash flow                                    60,000,000     -41,300,000     221,200,000     154,600,000     236,600,000     551,500,032
____________________________________________________________________________________________________________________________________________
Average to Current P/E Ratios |
              (DK)     Delek US Holdings Inc.

                               2014    2015    2016    2017    2018

          Annual Earnings:     3.35    0.32   -2.48    3.99    4.41
Average Price During Year:    30.94   33.38   16.36   25.01   42.91

                P/E Ratio:     9.24  104.32    6.60    6.27    9.73

 Average 5-Year P/E Ratio  =  27.23
             Current Price =  32.98

Previous 5 Quarter Earnings:   0.88    2.01    1.40    1.90    1.00

          Current Annualized (Last Four Quarters) Earnings =   4.30
                                                           ________
                                 Average PE / Current PE =     3.55
                                                           --------

                                      ...a number above 1.00 is good
                                                1.00 or below is bad
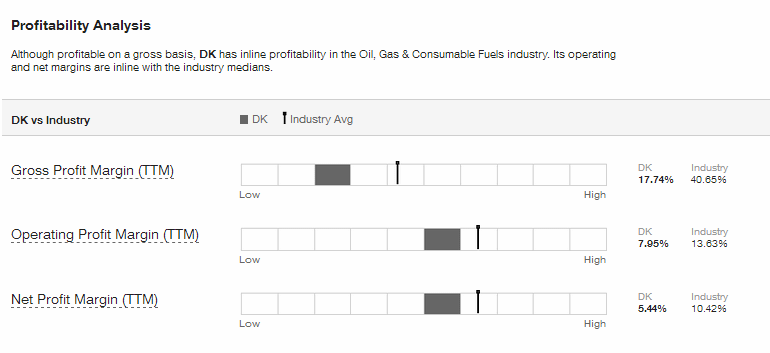
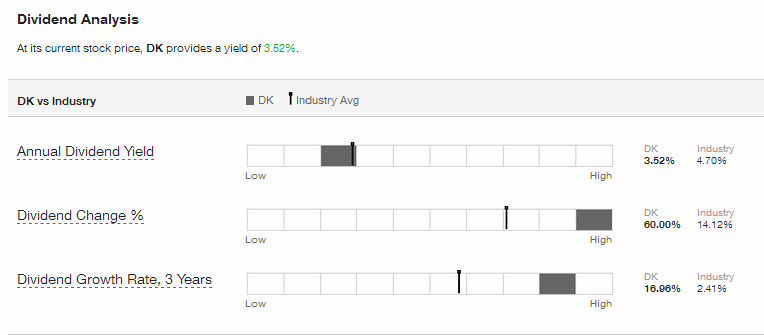
Financial Ratios |
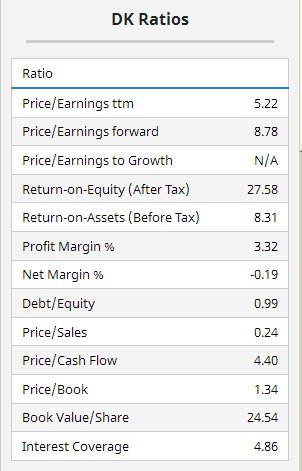
. . . . . . . . . . . . Lowest to Highest, Compared to Industry
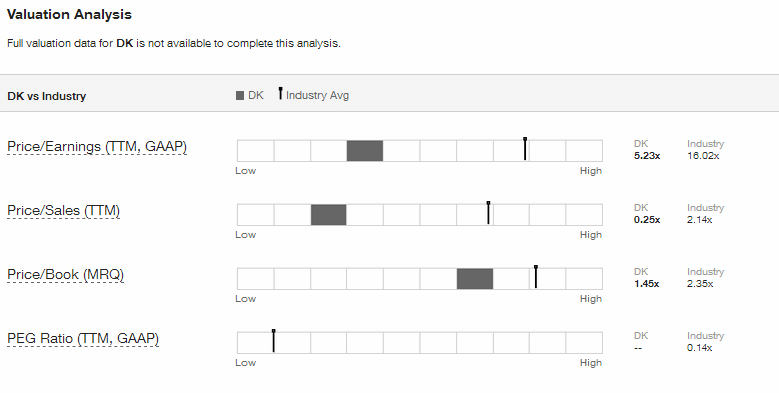
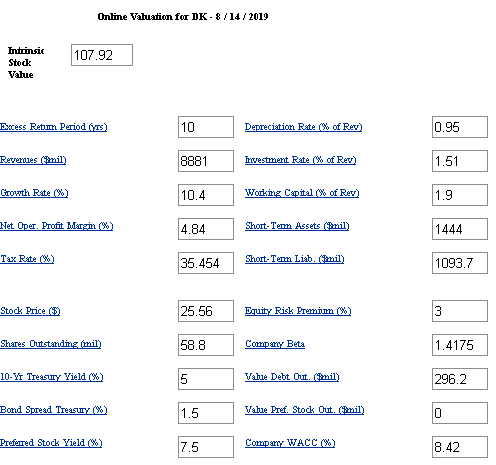
Intrinsic Value (DCF) |
Intrinsic Value by Discounted Cash Flow Method:
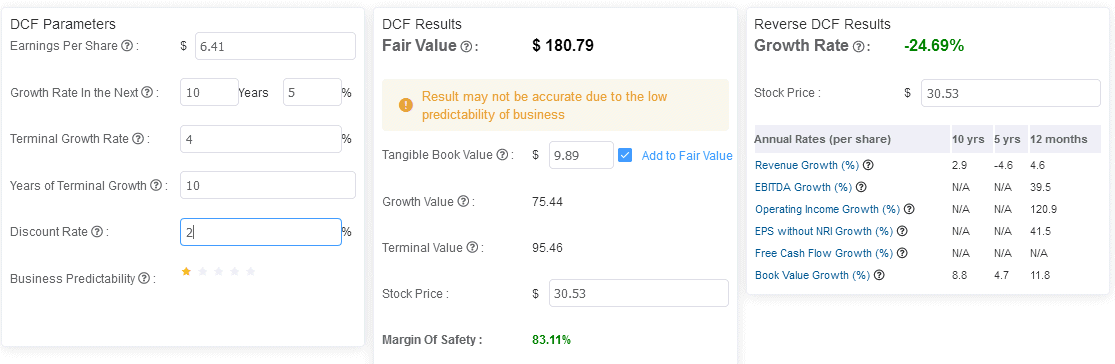
Fair Value Estimator |
Fair Value Estimate:
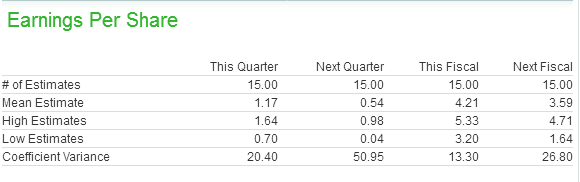
Projected Earnings |
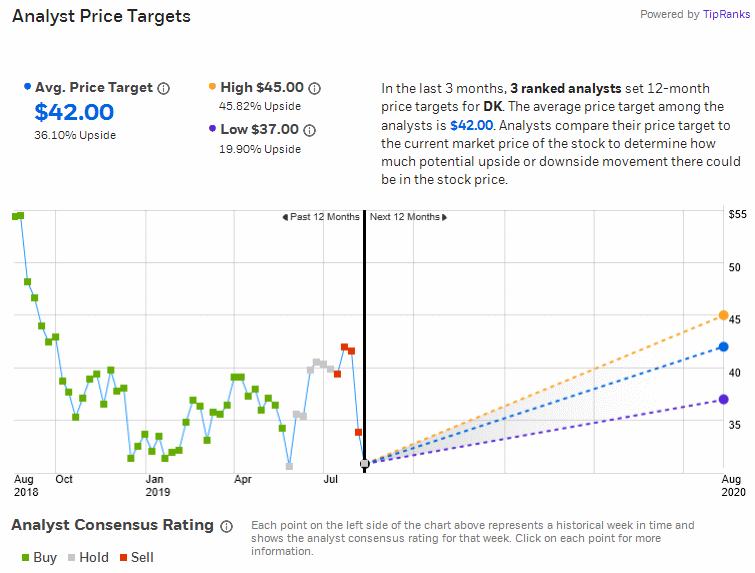
Research Reports |
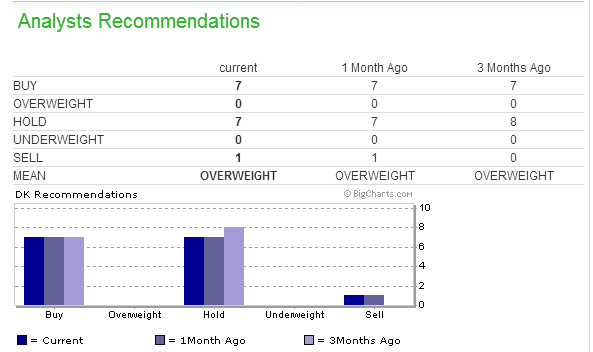
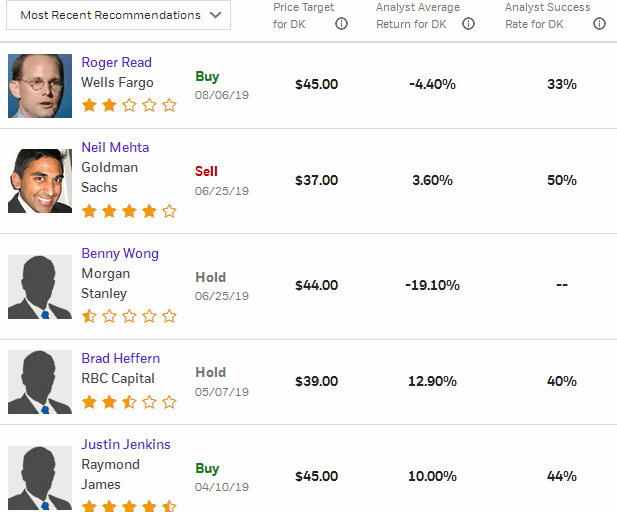
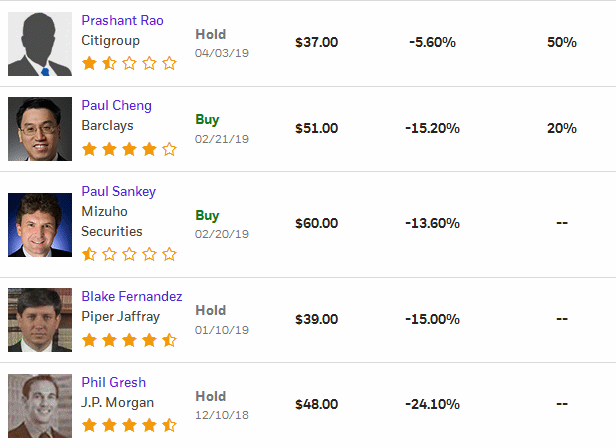
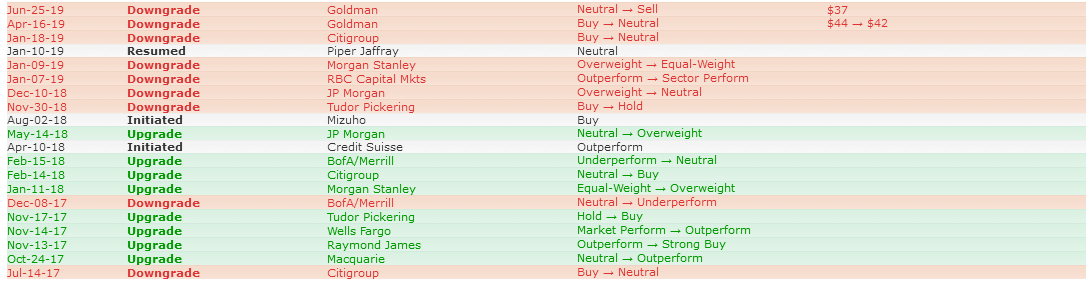
Analysts' Opinions |

Insider Activity |
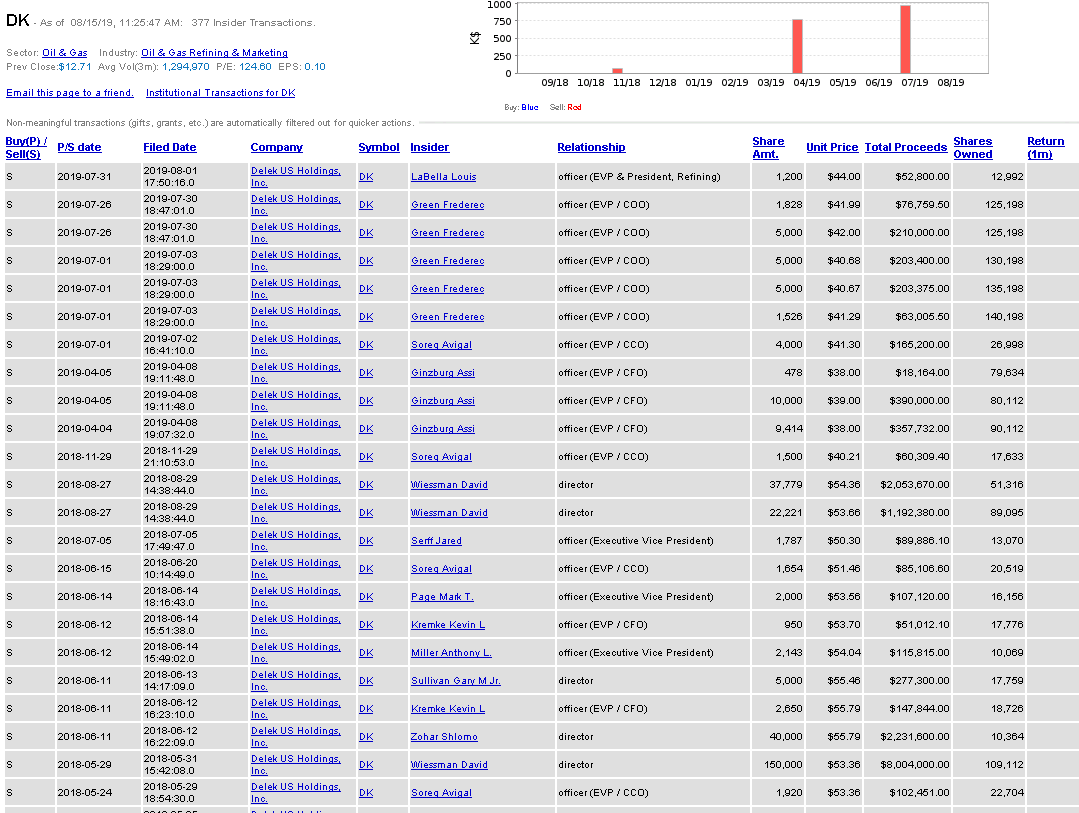
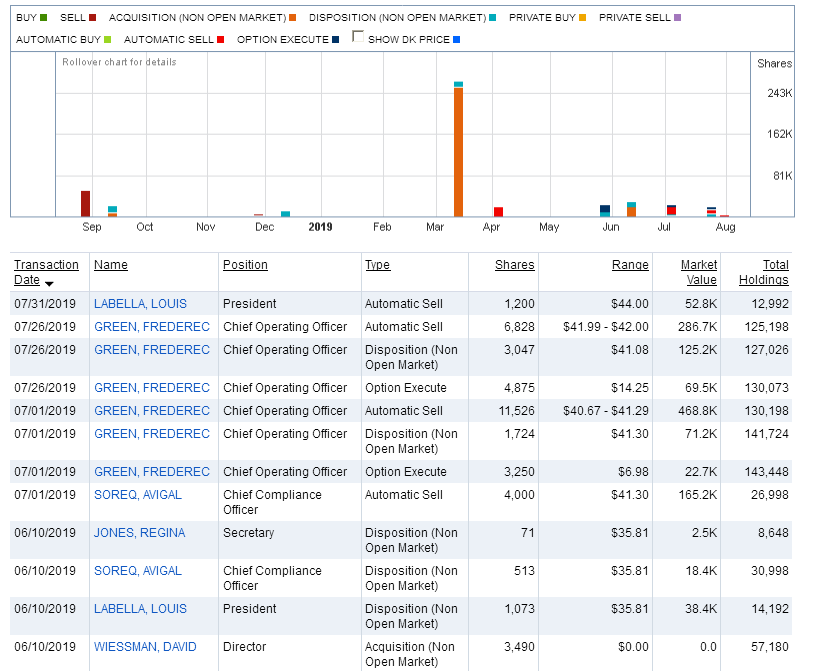
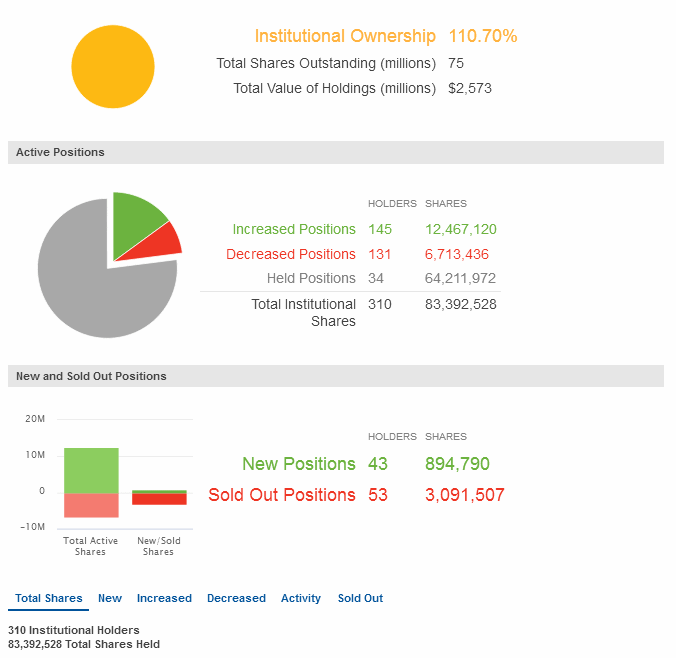
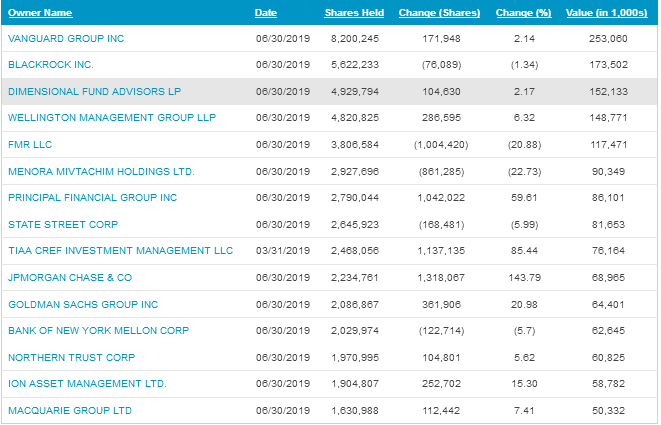
Institutional Activity |
Institutional Orders to Buy or Sell:
Sentiment |
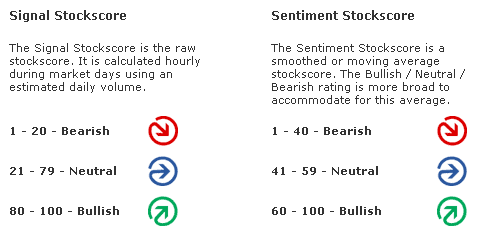
Zenith uses the "sentiment" score above or below 50 to award a positive or negative point in the Decision Matrix.

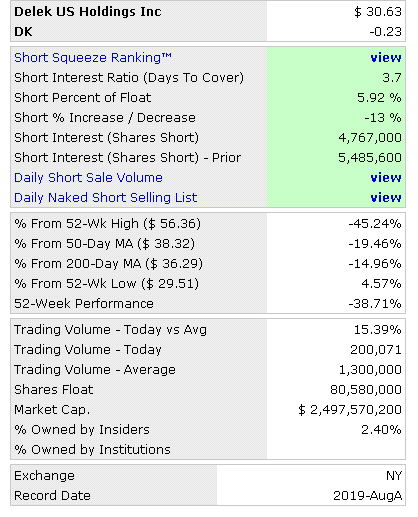
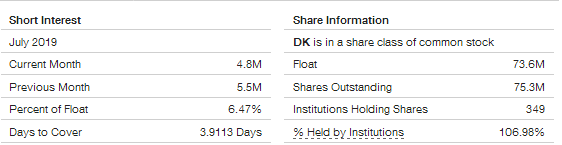
Short Interest Ratio |
As the short interest rises as a percentage of average daily share volume (Days to Cover), this is considered a measure of negative sentiment. Similarly, a decrease in that percentage is considered positive sentiment.
Standard & Poor's |
Management's Discussion of Results of Operations Excerpts |
Channeling Potential |
The summary below includes a value for `Degree,' which refers on a
scale of 1 to 10 the range of a channel in the period under consi-
deration compared to the total range of price movement. It also looks
for the last closing price to be within the channel, otherwise zeroed.
The `Index' is the `Degree' weighted for volatility.  Generally, the
the higher the index, the more suitable is the stock for trading as
a `rolling stock' between channel high and low points.

Results for DELEK US HOLDINGS INC.:
Symbol? DK
Total Months Available:  25
       Months in Cycle?   4

Months Covered by Periods:  12

Period 1           Period 2          Period 3
   H1      L1        H2      L2        H3      L3
  56.36   34.90     41.03   29.51     44.08   30.00

RANGE   =  56.36  TO   29.51            Close =  32.58
CHANNEL =  41.03  TO   34.90           Degree =   2
Volatility =  18.82%                    Index =   3
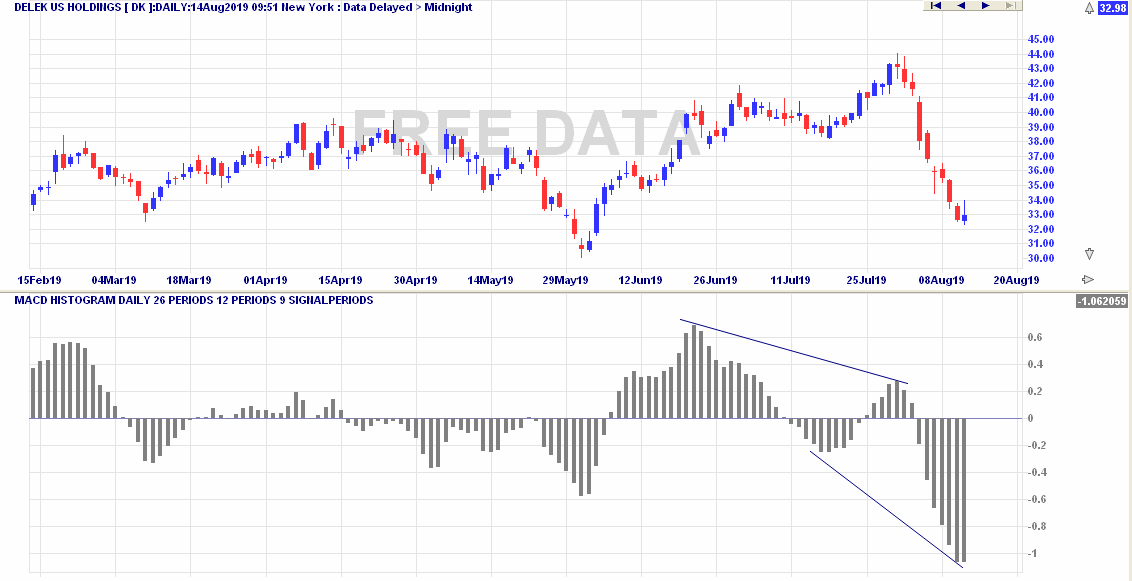
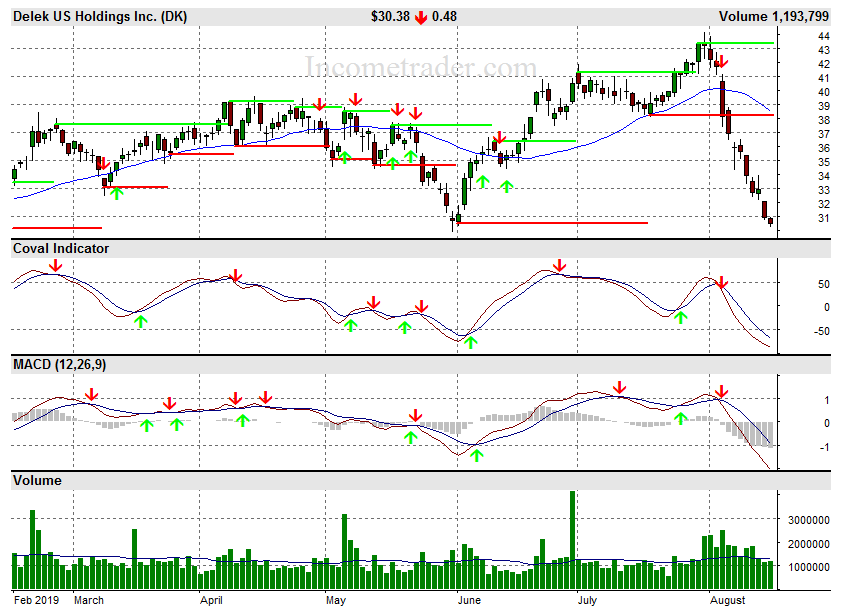
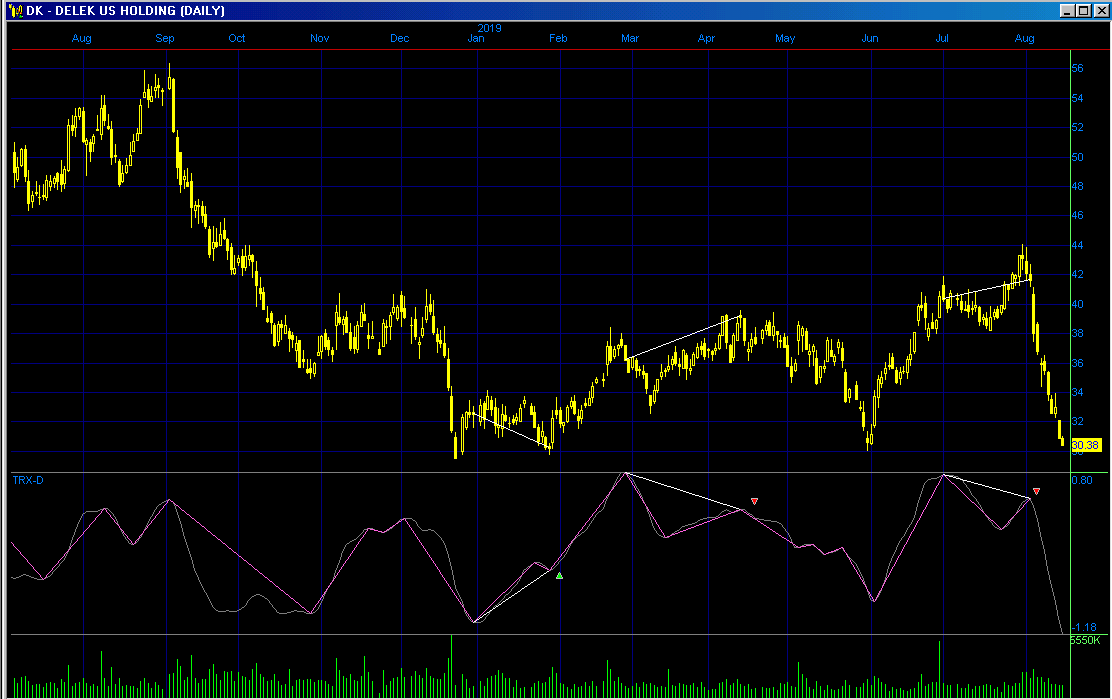
MACD Histogram Divergence |
The theory is that connecting the two most recent peaks or valleys of the MACD histogram will signal the direction of the next major move.
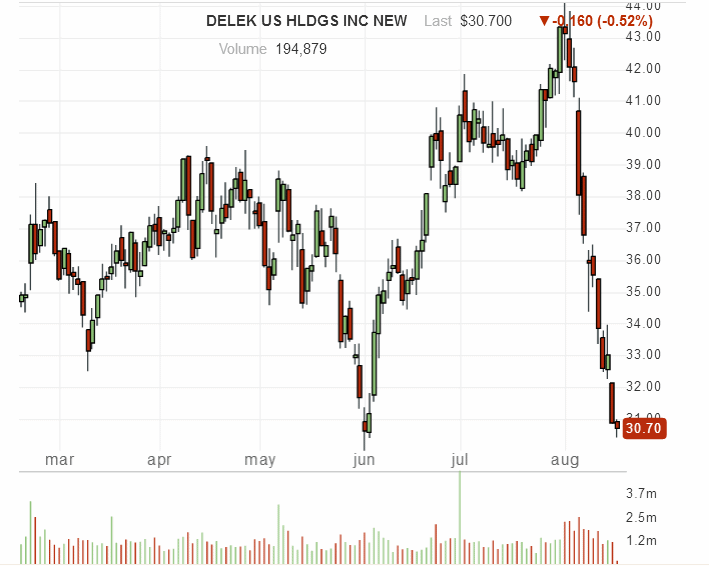
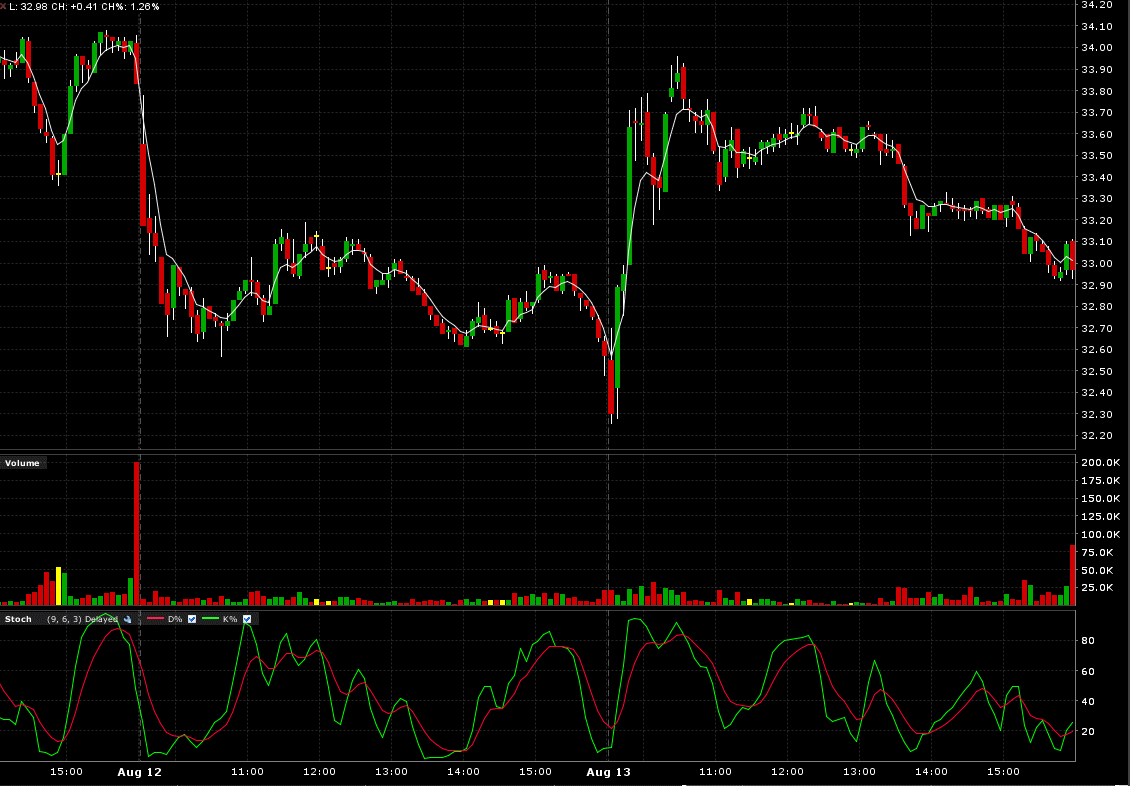
Intraday Chart |
2 Days:
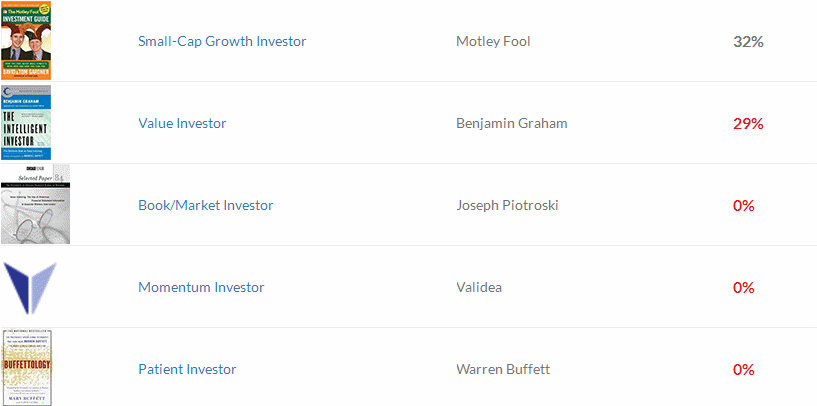
Val Idea |
6 out of 11favorable, (positive opinion.)

Stock Consultant |
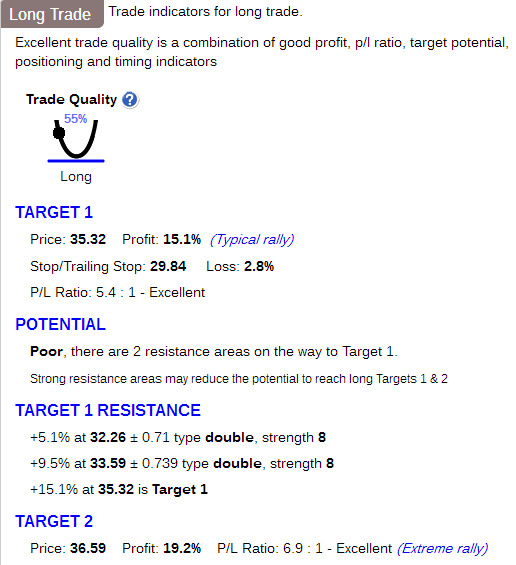
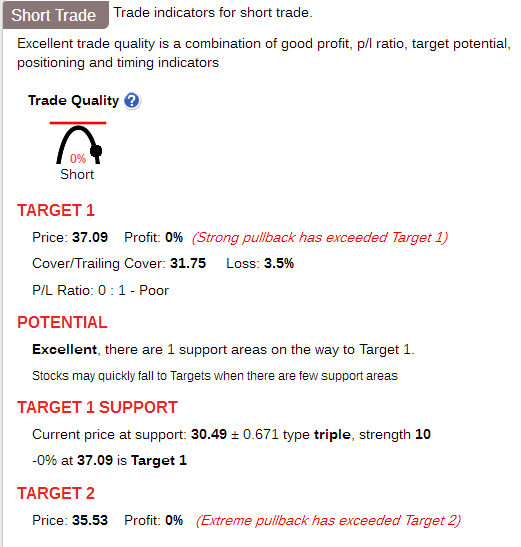
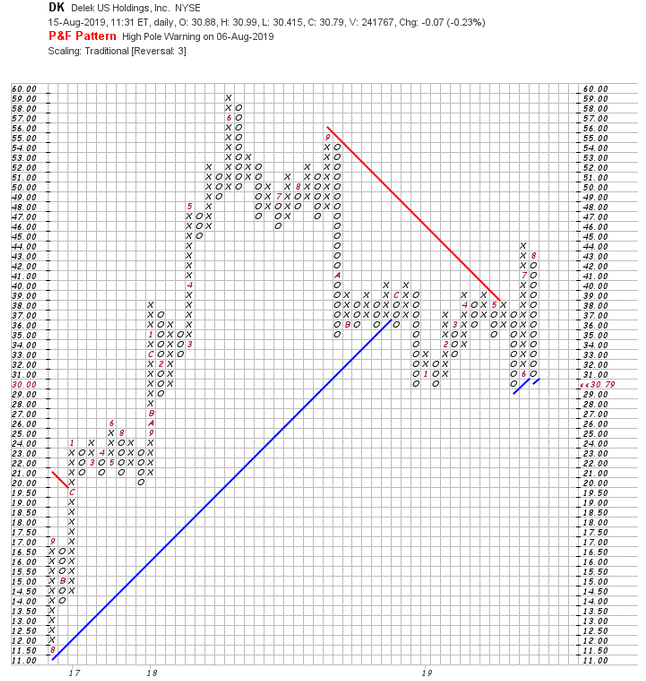
Point & Figure Chart |
Wall Street Analyzer |
Marketspace Chart |
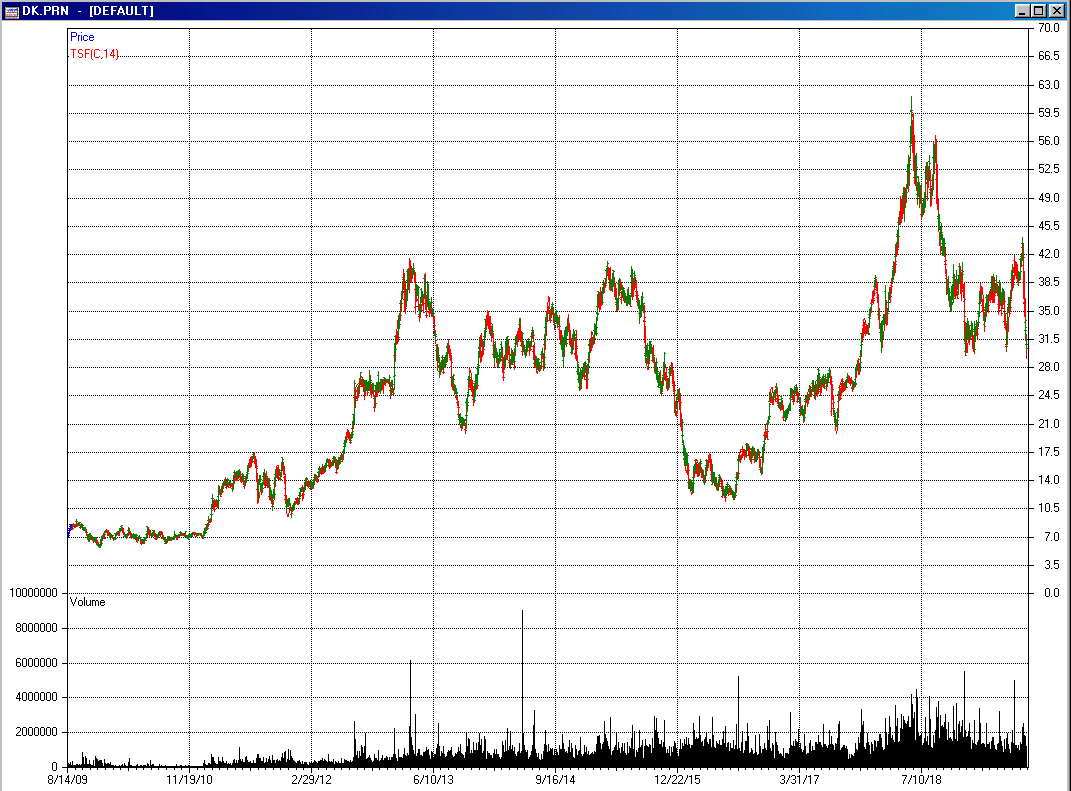
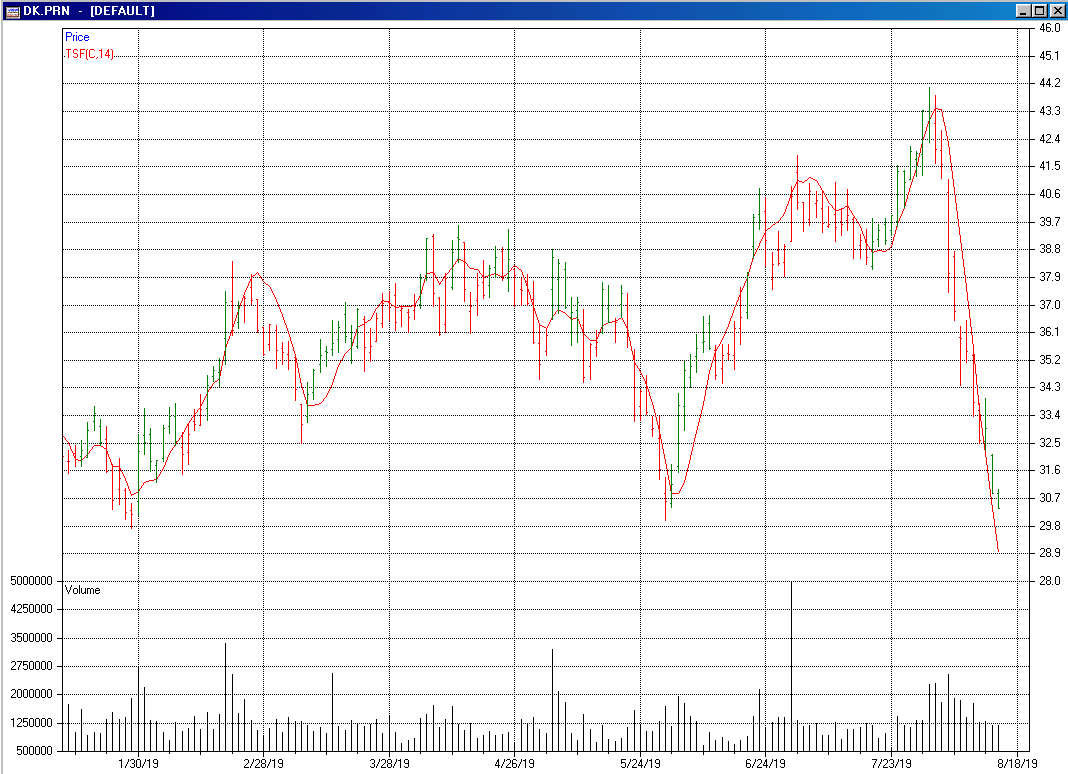
Time Series Forecast |
Neural Network Prediction |
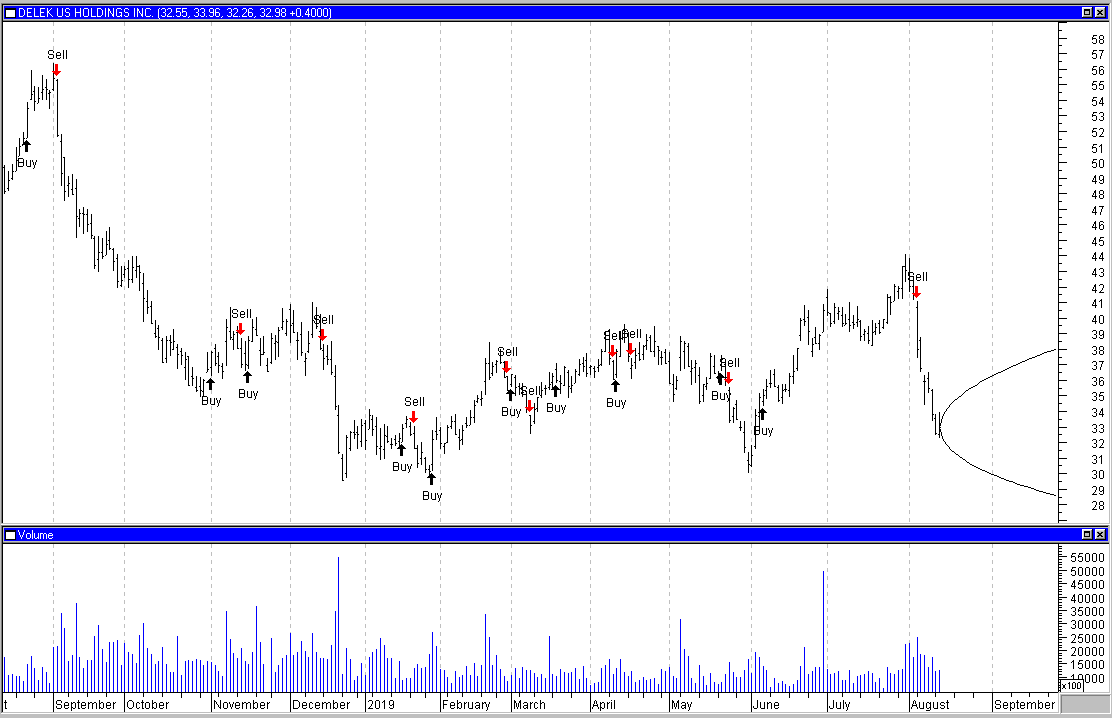
"Neurostock" can only track long trades. Therefore its performance, as tracked by itself on stocks which are consistently falling, may not appear as good as it could if each "sell" signal were a "short sale."
![]()
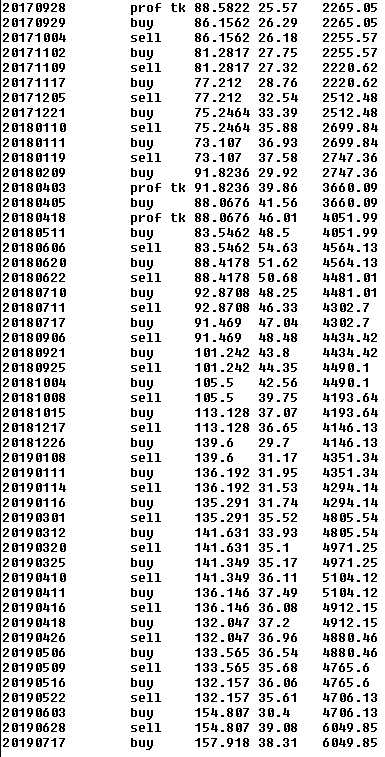

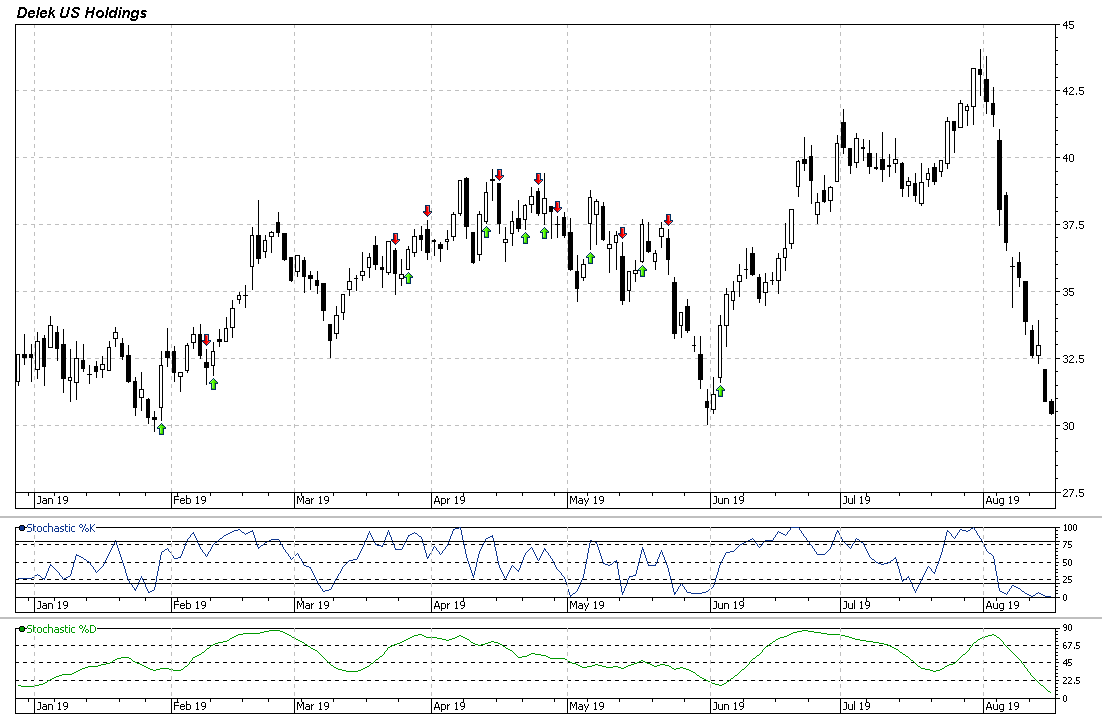
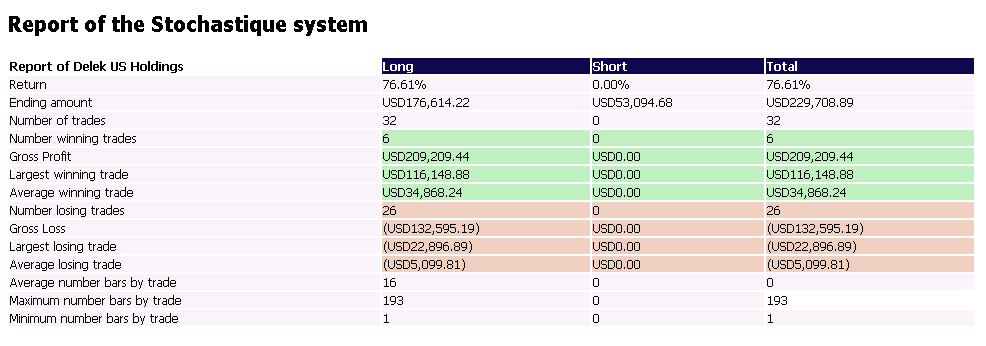
Ultimate Trading Systems |
3 out of 3 of the ultimate systems favor a downmove.
System Below:
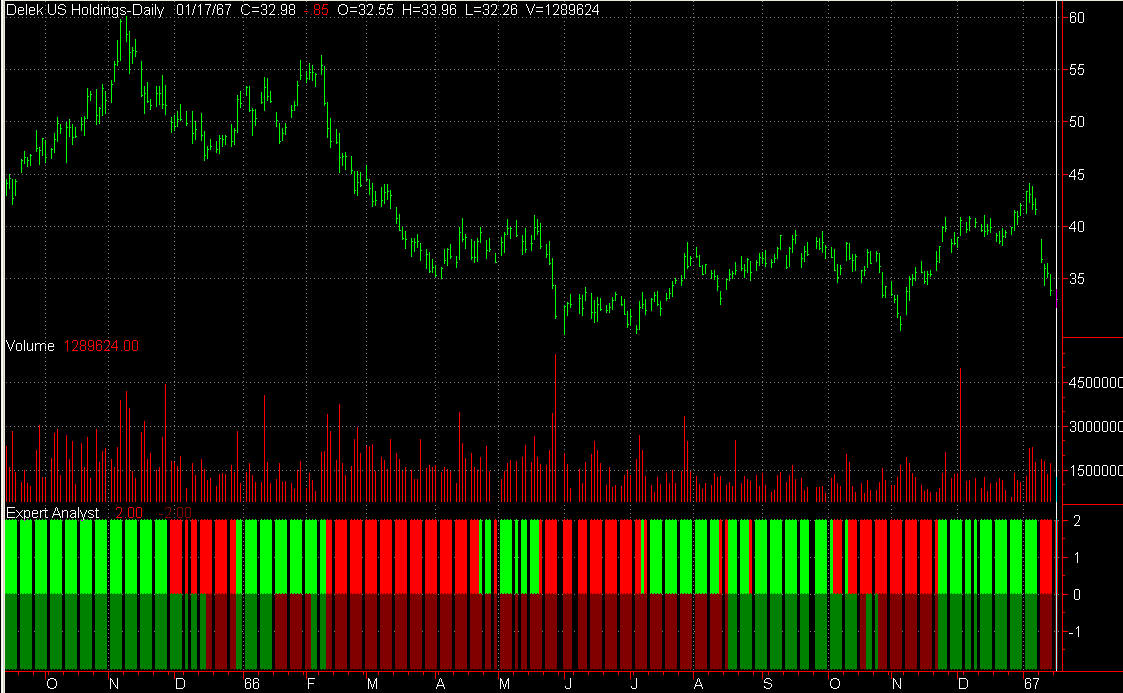
Short term outlook: Positive: Bright Green, Negative: Bright Red
Long term outlook: Postive: Dark Green, Negative: Dark Red.
Recommendation |
| Factors | Weighted Points |
|---|---|
| News | - 1 |
| Comparison | + 1 |
| Industry | + 1 |
| Bond Issue | + 1 |
| Zenith Index | - 1 |
| Non-GAAP vs. GAAP Earnings | - 1 |
| Cash Flow | - 1 |
| Average to Current P/E | + 1 |
| Ratios | - 1 |
| Intrinsic Value DCF | + 1 |
| Fair Value Estimator | + 1 |
| Projected Earnings | - 1 |
| Research Reports | - 1 |
| Analysts | + 1 |
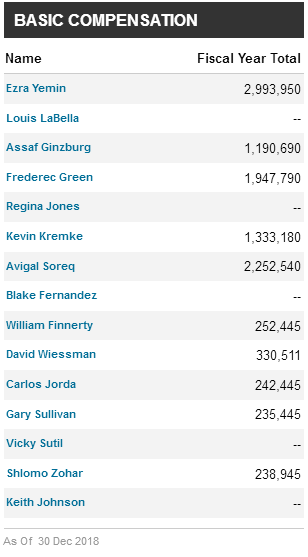
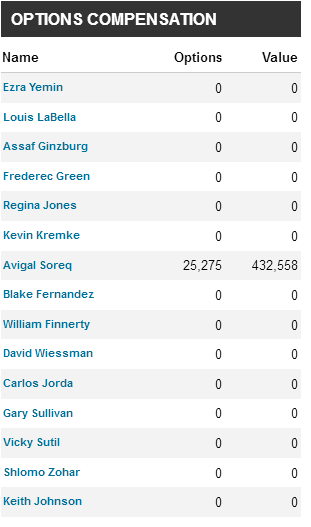
| Executive Perquisites | - 1 |
| Insider Activity | - 1 |
| Institutional Activity | - 1 |
| Management Reporting | - 1 |
| Short Interest | + 1 |
| Sentiment | - 1 |
| Standard & Poor's | + 1 |
| MACD Histogram Divergence | - 1 |
| Val Idea | + 1 |
| Stock Consultant | + 1 |
| Point & Figure | + 1 |
| Wall Street Analyzer | + 1 |
| Marketspace Chart | - 1 |
| Time Series Chart | + 1 |
| Neural Network | - 1 |
| Stock Options | + 1 |
| Ultimate Trading Systems | - 1 |
| Total | - 1 |
Place 985 shares of Delek US Holdings, Inc. (DK) on the Active List.