![]()
Introduction Nirvana Internal Progrm Historic Range
For reasons unclear to us, this software does not work on data for bond or note futures.
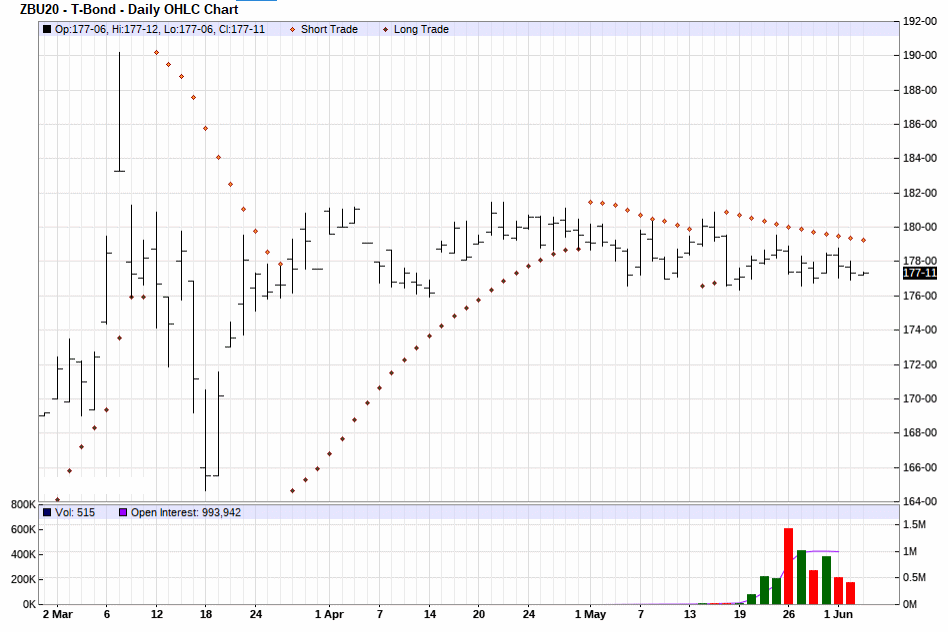
September Treasury Bonds:
06-04-2020: September Treasury Bonds: Low Rates Fail to Attract Investment Capital
(Click on links below. Whole page needs to load before links work.)
Intermarket
Parabolic
News
Point & Figure
Cyclic/Seasonal
Third System
Margin
Commitment
Volatility




Introduction
Bond prices generally move opposite to interest rates, but when the interest rates are near zero, it seems the only way for them to go is up. The implication then would be that the only way for bond prices is to go down. Traders have been frustrated by that notion for many months, but it remains a question not of "if" but "when". The potential for runaway inflation is increasing as the Treasury continually runs its printing presses to pay for exploding national debt, and equity markets are reacting positively to that. Equity markets often move opposite to bond markets.
Intermarket Analysis
Parabolic Chart
September Treasury Bonds:
Nirvana Chart
As bonds hate good news, the U.S. non-farm paiyrolls seems poised at this writing to fall by 1 milliion. The ISM manufacturing index is thought to be going to uptick. China, Spain, Italy and France all showed bettwr-than-expected PMI readings for May (41.5 in April).. Trade expectations call for the unemployment rate to approach 20%. Traders remain net short bonds. Constrction spending is forecast to have a downtick from March's 0.9% reading.
Since bond prices move opposite to interest rates and interest rates are at an exrtreme low point and the Fed stating a desire to avoid going to negative interest rates, it would seem bond prices have nowhere to go but down. Fed Chairman Powell said "Negative rates are not an appropriate tool in the U.S." In the long run, this is inevitable, but the question is always "when", not "if."
Treasury Sec'y Mnuchin says he's comfortable spenidng $3 tillion because the Treasury can lock in very low rates. Federal student loan rates have hit record lows.
The obvious in the news affecting bond prices is that businesses were scheduled to re-open after the pandemic crisis, and then nationwide looting seems to favor them rather being boarded up. If that isn't bad news, we don't know what is, and certainly favors bond prices as investors look for safe havens. George Floyd protests will almost certainly exacerbate the coronavirus outbreak, as many protestors across the country were not wearing masks, nor observing social distancing, and were from poorer neighborhoods.
Special breaks from the Treasury Dept. allowed $1 trillion in high grade corporate debt to be issued this year. Flanked by the Fed's programs, companies are racing to issue new debt to restructure existing debt, pay down bank lines or just raise cash to weather the recession. There are a record number of companies at risk of downgrade by S&P due to exposure to the pandemic's effects.
Blackrock started a new electronicalliy traded fund for Treasury Bonds. Blackrock has an existing $139.1 billion in treasury bond assets.
The current recession is projected by analysts to last at least into 2021.
U.S.- China tensions have had a negative impact on bond prices.
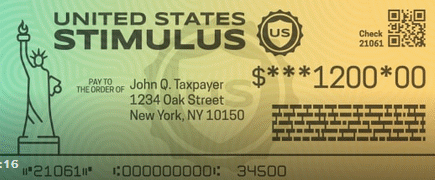
The Government is at last showing signs of worrying about sending out more stimulus checks, both Democrats and Republicans. The President is warming up to the idea which isn't dead, however. The President did call another $3 trillion stimulus bill to give each American $1,200 who earned less than $75,000 a year "Dead on arrival." The first round of stimulus was poorly targeted but Republicans are proposing to cut payroll taxes. Stimulus remains "tempting" because a strong economy will help Republican reelection efforts.
Re-opening the economy after months of coronavirus lockdown measures is being carefully monitored by investors. There are many reasons, especially nationwide protests, why this re-opening could be seriously delayed.
Reviving equities in the stock market are competing with bonds and lowering bond prices. At the same time, New York Fed President John Williams said the Fed was thinking about the use of policies that would aim to keep borrowing costs across different maturities of government paper at fixed levels. Such measures could prevent yields for targeted bonds from rising. Yield control has been used in other countries.
Eurozone proposals for borrowing 750 billion euros from the ECB to establish a recovery fund for stimulus programs there were seen as pressuring bond prices worldwide.
A wave of debt supply from the Treasury this past week pressured bonds as the Federal Government looked for ways to finance its widening budget deficits. $96 billion of bonds were sold in the most recent week. The Fed is looking more to rely on extended maturity bonds to get through the pandemic crisis. That included $20 billion in new 20-year bonds to finance the ballooning deficit.
Former President George Bush endorsed Joe Biden for President. A key point in the decision was Trump's failure to unequivocally rebuke while nationalists in the deadly Chartlotsville rally.
Private equity markets for technology, infrastructure, resources, and real estate have increased to about $6.5 trillion, a more than 300% increase over the past decade. They offer better returns, but there has been less scrutiny recently of corporate behavior leaving these markets vulnerable. Private markets lack transparency and consistency. Citigroup warns that the stock market isn't reflecting reality, either. Valuations are way over extended. Private debt is more illiquid. The pandemic is exposing these risks, especially in places like the airline industry. Taken altogether, we regard the news as negative for bond prices as interest rates may rise to attract more capital away from other questionable sources.
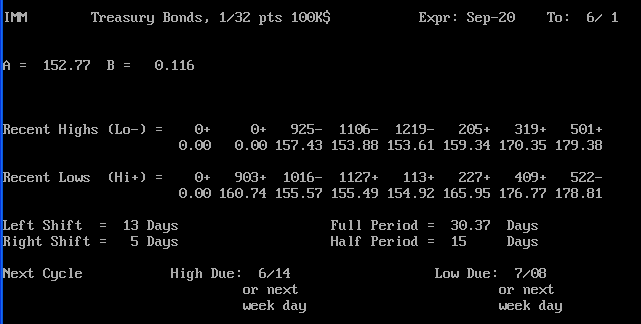
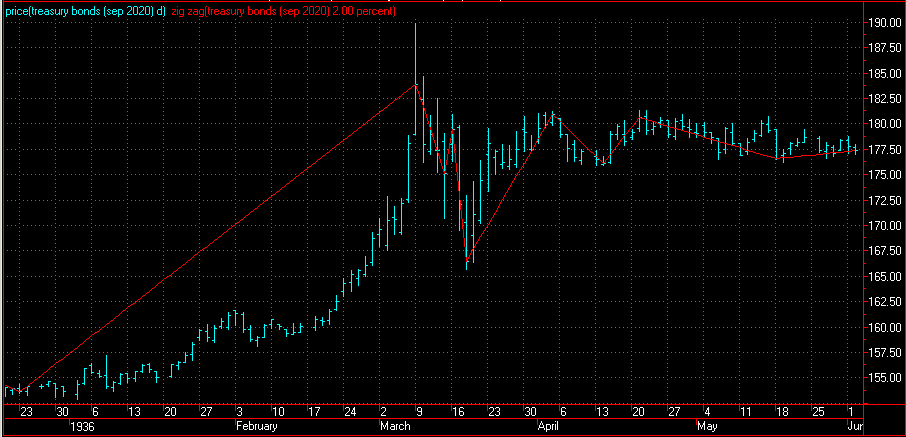
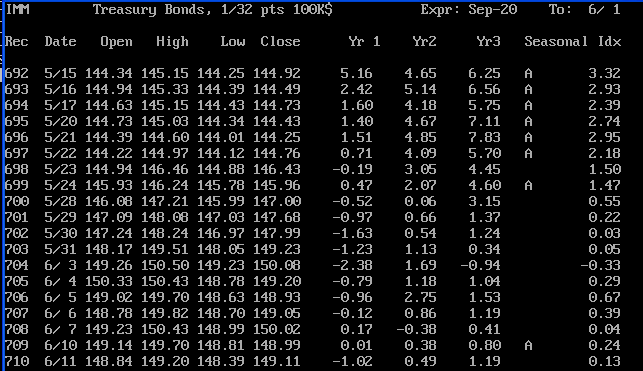
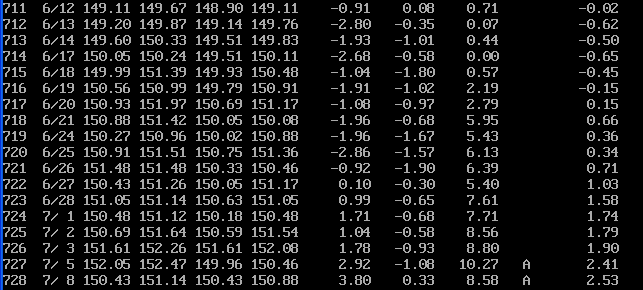
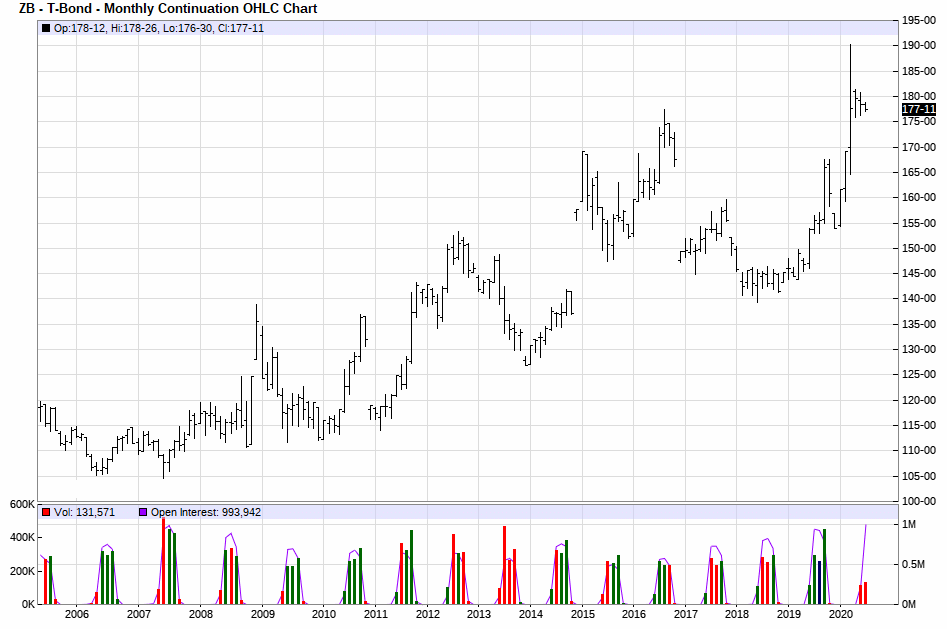
We are headed toward a cyclical high and a seasonal up period.
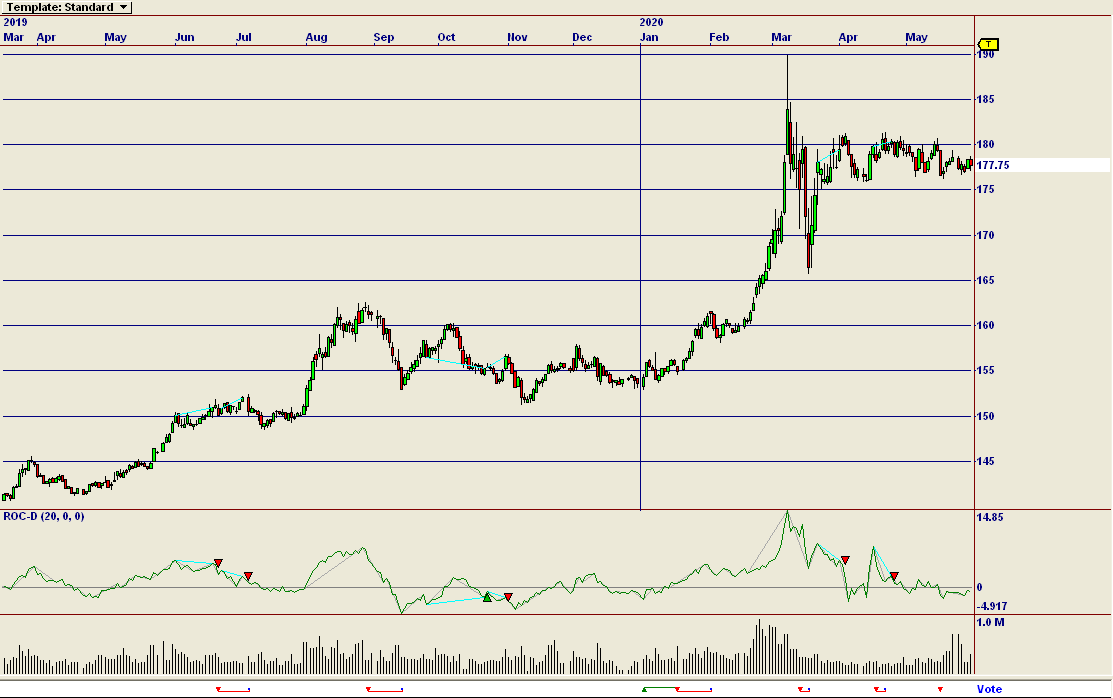
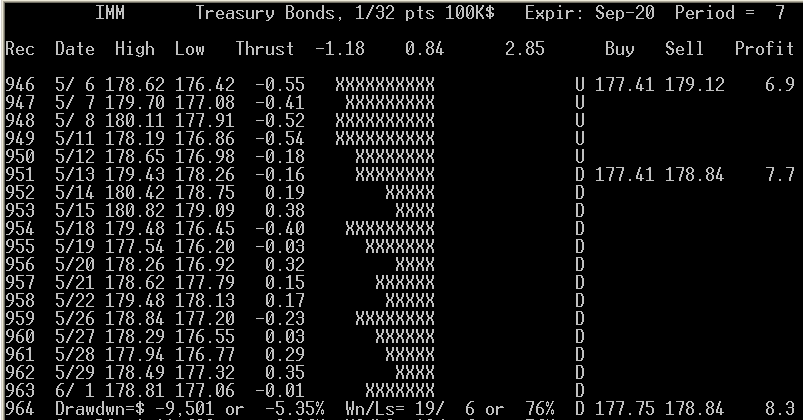
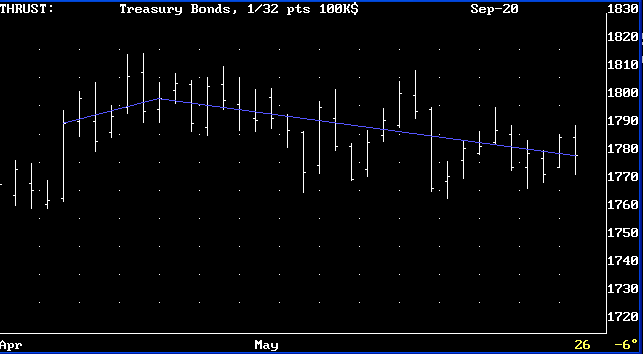
Our best-performing internal program is "Thrust". It is giving a sell signal.
Results of "Thrust" for T-Bonds (blue lines = successful trades, red, unsuccessful):
(Always in the market.)
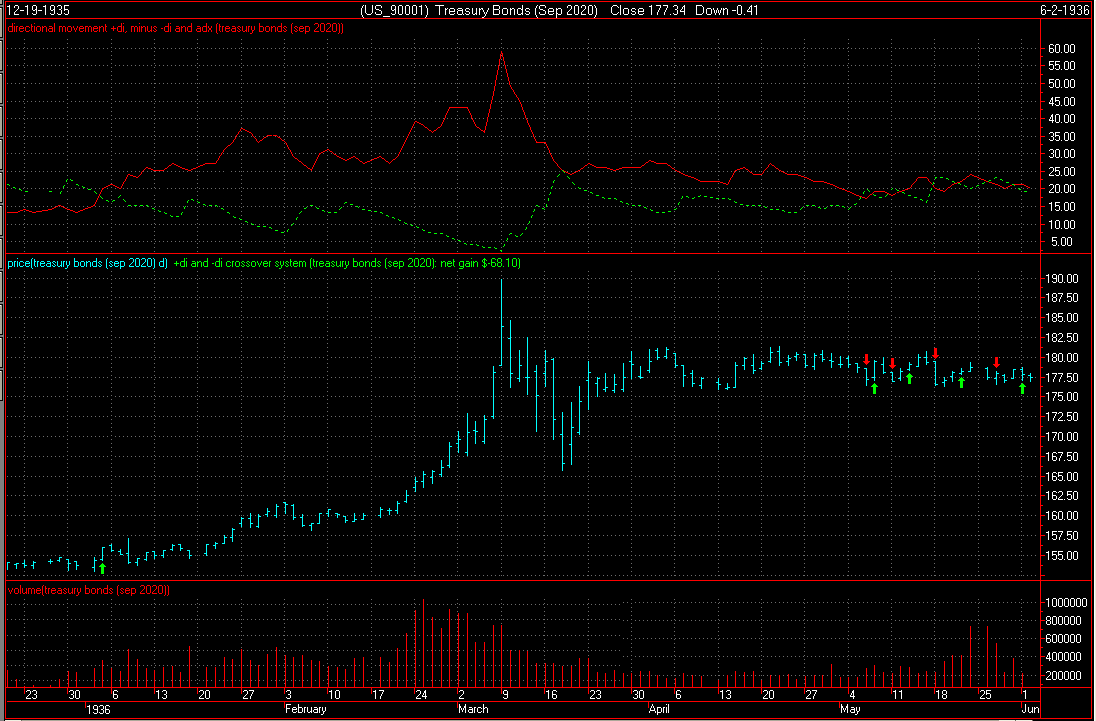
Our third system has triggered a buy signal. (Note, disregard the year on the chart. Our regular readers know this is not a Y2K-compliant system, but it still works.)
The point value is $1,000. Initial margin on a single contract is $8,050. Use of options is advised.
Scale trade sellers are entering the market for the long term in this price range.
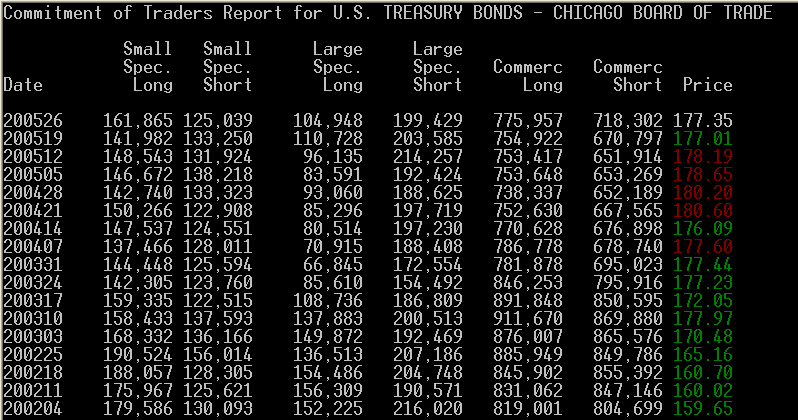
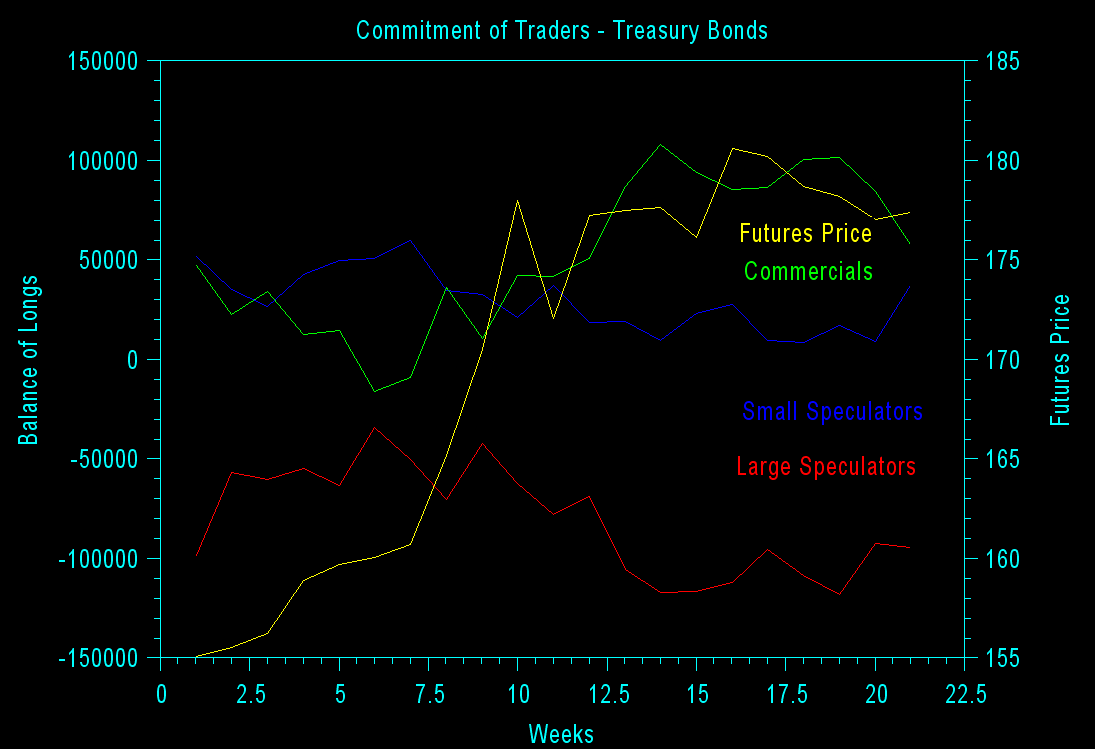
In the chart below, the yellow line is the futures price, read on the right axis. All other colors are read on the left axis. Blue is small speculators. Red is large speculators. Green is commercials. Commercials with the best track record are getting increasingly-short.
Interpretation of a Different Site Below (Their trader categories may vary from ours):
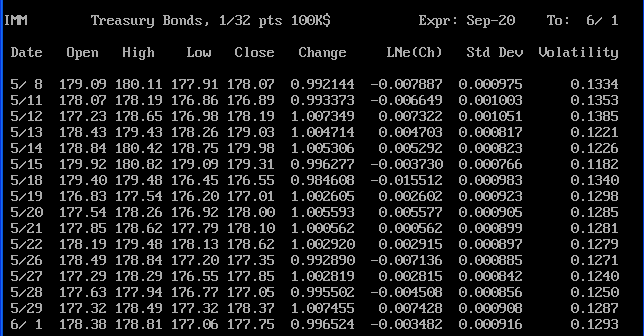
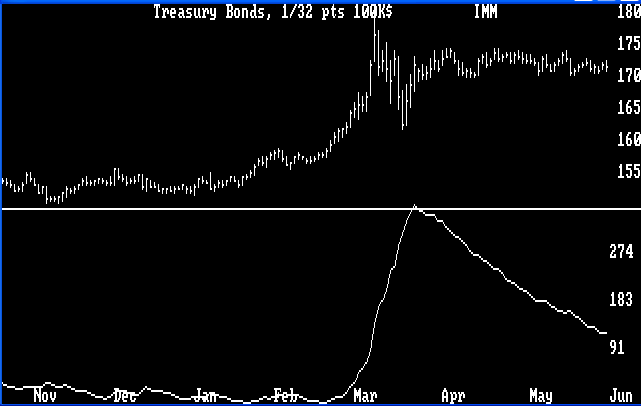
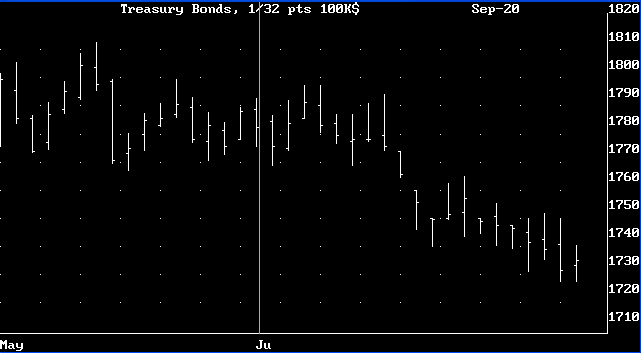
The average volatility shown below suggests that an uptrend remains intact from the last volatility low point.
An option trade recommendation may be entered later in this spot.
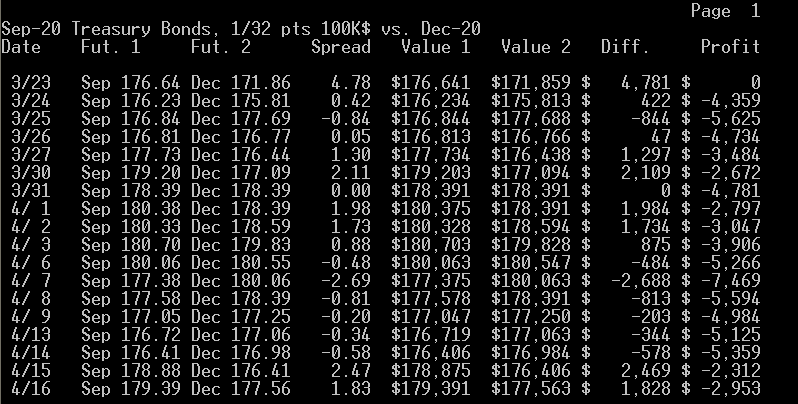
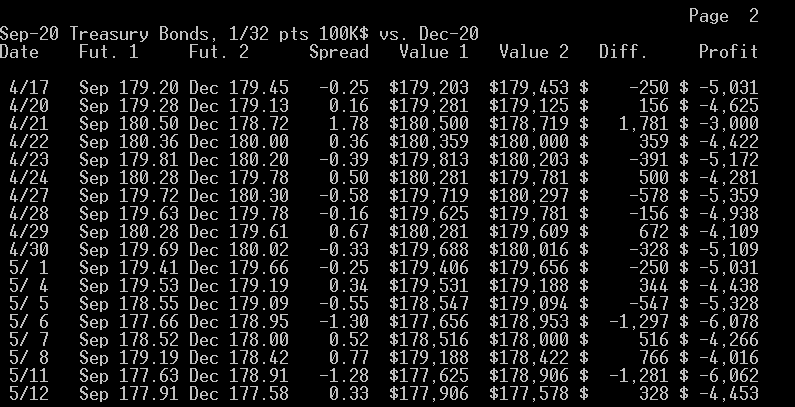
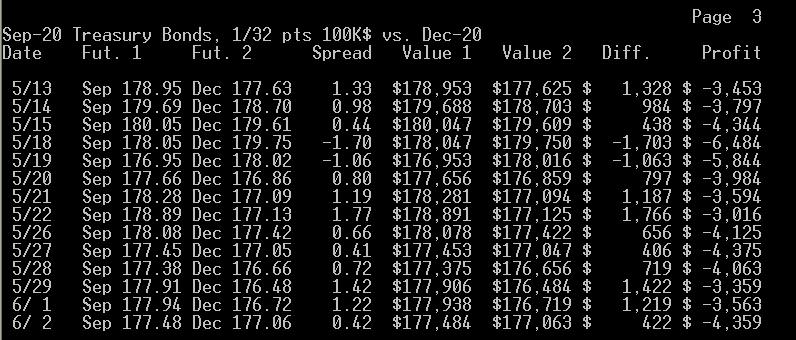
What the Jan. - Jul. calendar spread suggests to us is that buying the near contract and selling the far one is at most times profitable, which we think is a sign that these futures may go flat in the long run. The best time to enter or leave the above spread is when it is at -0.25 or narrower selling the far as prices are falling and then buying the near, and exiting or entering when it is at +1.90 or wider buying the far as prices are rising and then selling the near. At this time, we appear to be midway dropping slightly toward the sell the far, buy the near point.
To view the chart below correctly use Microsoft Internet Explorer.
Here's an intraday chart for a previous day ( 7/11 ).
News Analysis
Point & Figure Chart
190.0|                                                                  T  6/ 1
     | IMM - Sep-20 Treasury Bonds, 1/32 pts 100K$ Cm.=0.03  Lim.= 0.6
     |     X    OXOXO
     |     X
     |     XO
     |     XO
185.0|_____XO__________________________________________________________________
     |     XO
     |     XOX
     |     XOXO
     |     XOXOX
180.0|_____XOXOXOX_X_X_________________________________________________________
     |     XO OXOXOXOXO
     |     X  OXOXOXOXO
     |     X  O OXOXOXO
     |     X    OXOXO
175.0|_____X____OXOX___________________________________________________________
     |     X    OXOX
     |     X    OXOX
     |     X    OXOX
     |     X    O OX
170.0|_____X______OX___________________________________________________________
     |     X      OX
     |     X      OX
     |     X      OX
     |     X      O
165.0|_____X___________________________________________________________________
     |     X
     |     X
     |     X
     |O    X
160.0|O____X___________________________________________________________________
     |OX   X
     |OXO  X
     |OXO  X
     |OXOX X
155.0|OXOXOX___________________________________________________________________
     |OXOXOX
     |O OXO
     |  O
     |
150.0|----|----|----|----|----|----|----|----|----|----|----|----|----|----|---
        111
      89012133333333445
      22123001111111010
      63110890022379766
The above chart is giving a conventional sell signal.
Cyclical and Seasonal Factors
Internal Program

Third System Confirmation
Margin
Historic Range
Commitment of Traders

Volatility / Probable Range

Possible Future Prices
Option Recommendation
Calendar Spread
Level Table:
192.0|                                                                  T  6/ 2
 IMM - Sep-20 Treasury Bonds, 1/32 pts 100K$ Cm.=0.03  Lim.= 0.6
     |
     |
     |U
187.0|U________________________________________________________________________
     |U
     |U
     |U
     |UU
182.0|UU_______________________________________________________________________
     |UUU
     |UUUUVWWXX
     |UUUUUVVWWWWXXXXXXXXXYYYYZ
     |UUUUUUUVVVVWWWXXXXXXXYYYYYYYZZ
177.0|UUUUUUUVVVVVWWWXYYYYYZZZZZZ[[____________________________________________
     |UUUUUUUVVVVVWWWWWYYYZZZZZ[   <<<
     |UUUUVVVVVVWWW
     |UUUVV
     |UUUVVV
172.0|UUUUVV___________________________________________________________________
     |TUUUUVV
     |TTUUUUVV
     |TTTUUUV
     |TTTUV
167.0|TTTUV____________________________________________________________________
     |TTUV
     |TTU
     |TTT
     |TT
162.0|TT_______________________________________________________________________
     |FFFGGT
     |FFFFFGGGGRRRSST
     |FFFFFFFFGGJJJJRRRRRSSSSSSSS
     |EEFFFFGGGJJJKRRRSSS
157.0|EEEFGGHHJJKR_____________________________________________________________
     |EEEEEGHHHHJJJJKNNQRR
     |EEEGGHHHHHJKKKKKKLLLNNNNNNOOOOOPQQQQR
     |EHHHHHKKKLLLLLMNNNNNNOOOOOPPQQQQQQQ
     |EEHHHLLLLLMMMMMOOOOPPPPPPPQQ
152.0|EEHMMMPP_________________________________________________________________
     |CCEMMMMM
     |BBBBBBBBBCCCCDDEE
     |AAAABBCCCDDDDDDDDD
     |AAAAAACCCC
147.0|_________________________________________________________________________
     |
     |
     |
     |
142.0|-A-B-C-D-E-F-G-H-J-K-L-M-N-O-P-Q-R-S-T-U-V-W-X-Y-Z----|----|-- TPO= 0.703
                         1 1 1 1 1 1
       6 6 7 7 7 8 8 9 9 0 0 1 1 2 2 1 1 2 2 3 3 4 4 5 5 6           6
       0 1 0 1 3 1 2 1 2 1 2 0 2 0 2 0 2 0 2 0 1 0 1 0 1 0           0
       5 8 2 7 1 4 8 2 6 0 4 7 1 6 0 7 2 5 0 5 9 2 7 1 5 1           2
Other Factors
