![]()
Introduction Nirvana Internal Progrm07-11-2020: October World Sugar: Ethanol Demand Decrease Poses Possible Oversupply
(Click on links below. Whole page needs to load before links work.)
Intermarket
Parabolic
News
Point & Figure
Cyclic/Seasonal
Third System
Margin



We fed Sugar, Coffee, and Cocoa into a neural network to get the following result:
October World Sugar:
October World Sugar:
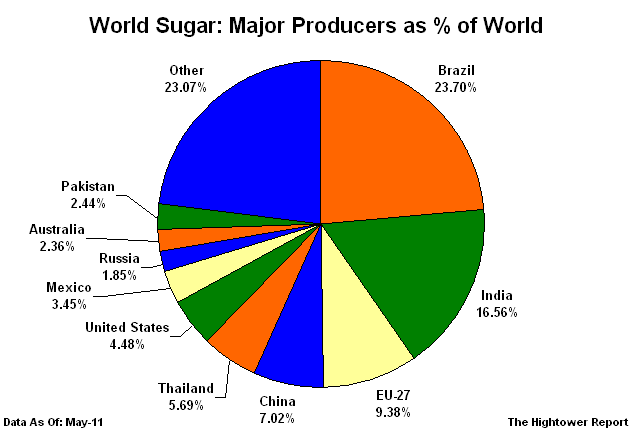
There is a sizeable global supply of sugar. Stronger energy prices have encouraged alternate use for cane sugar in making ethanol, but the sustenance of an energy recovery move at this point is questionable. Brazilian currency strength has helped sugar prices. Stronger reformulated gasoline prices also have provided a little support. There have been reports of coronavirus cases at several Brazilian ports which adds to weather-related supply bottlenecks, provoding additional support, particularly in lieu of any real recognition by Brazil's leaders of the seriousness of the pandemic and their inability to do much about it. Brazil exported 3 minnion tonnes of sugar in the last month, double that for the same period last year. It shows improving global demand, but also show a huge increase in Brazil's near-term supply. In India, the world's second-largest producer, a monsoon rain season of unusual intensity has been happening, rainfall 14% above long term averages.
Brazil has been pushing food use for its sugar output at the expesne of ethanol and may have to boost U.S. ethanol imports to meet demand. Sugar production in Brazil's south-center region reached 10.57 million tonnes so far in the 2020-21 season that began in April, according to industry group Unica. Mills in Brazil continue to push for maximum sugar output at the expense of ethanol, with 47% of the crop allocated for sweetener use. This corresponds to a 16% decrease in ethanol output.
The sugar crush in Australia has been delayed by wet weather. EU sugar beet output is expected to decline because of low returns to farmers there. U.S. sugar imports are seen as falling 10% according to the USDA. USDA kept U.S. sugar production for the new crop at 9 million short tons wich is 12% more than usual.
Drought in India has caused estimate4s for sugar output for this season to fall by somewhere in the range of 20% below normal, according to various sources, not all of which agree. Sugar stocks there are below normal at the present time by about 20%.
Overall in the news, the main concern is that a rise in Brazil's sugar production could "topple" the global market because the Brazilian ethanol market remains weak. The blobal sugar market could then become flooded, sending prices plummeting.; But currently, estimates remain very mixed, as rising ethanol and sugar prices are helping to resolve Brazil's sugar industry structural and financial weaknesses, but much more help is needed there. Global food commodity prices as a whole rose 2.4% higher in June according to the "FAO Food Price Index."
"VHP" is a term familar to sugar traders standing for "very high polarization." VHP Sugar grown in Brazil has highi sucrose content and its light brown sugar crystals are simpler to refine into white sugar. Destinations for this sugar are generally the Middle East, North Africa, Indonesia, and China. COVID19 has increased the availability of sugar out of Brazil, espeically VHP sugar. Crop issues in other countries are causing importers to turn more to Brazil. Czarnikow traders are seeing a strong demand increase from China and Indonesia. Sugar mills are having to follow new health measures which creates new risk for the entire supply chain. Transportation of sugar does not appeare to be an issue to Czarnikow.
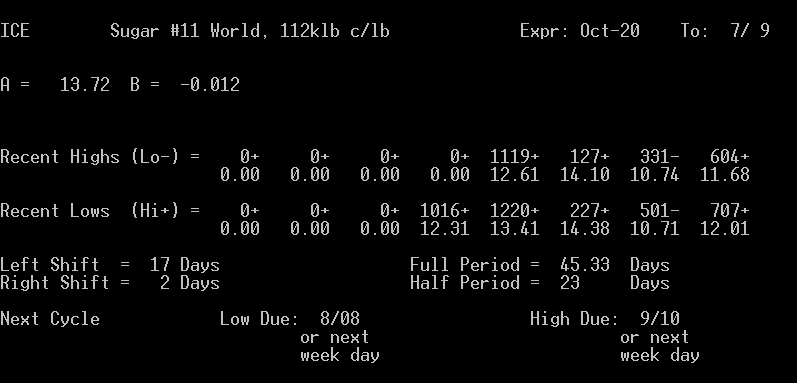
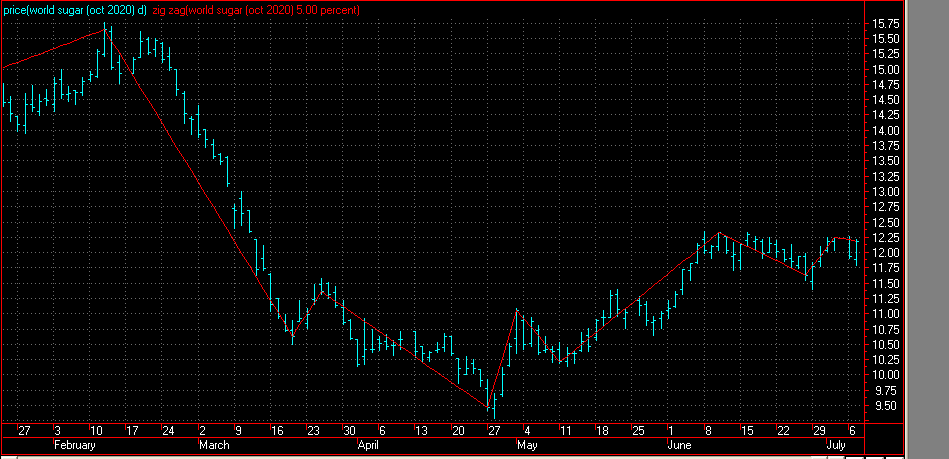
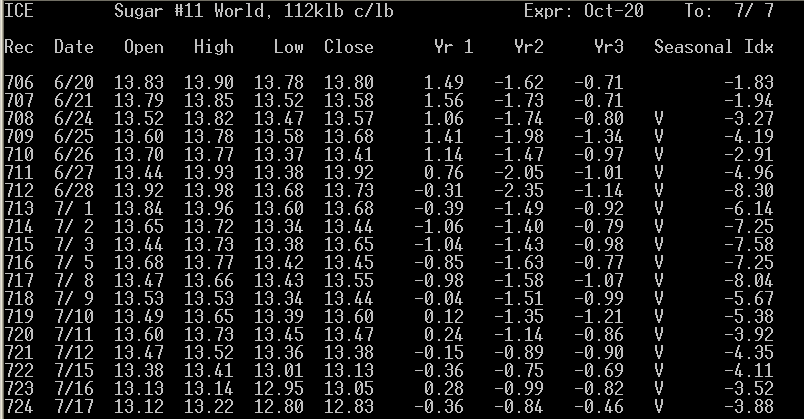
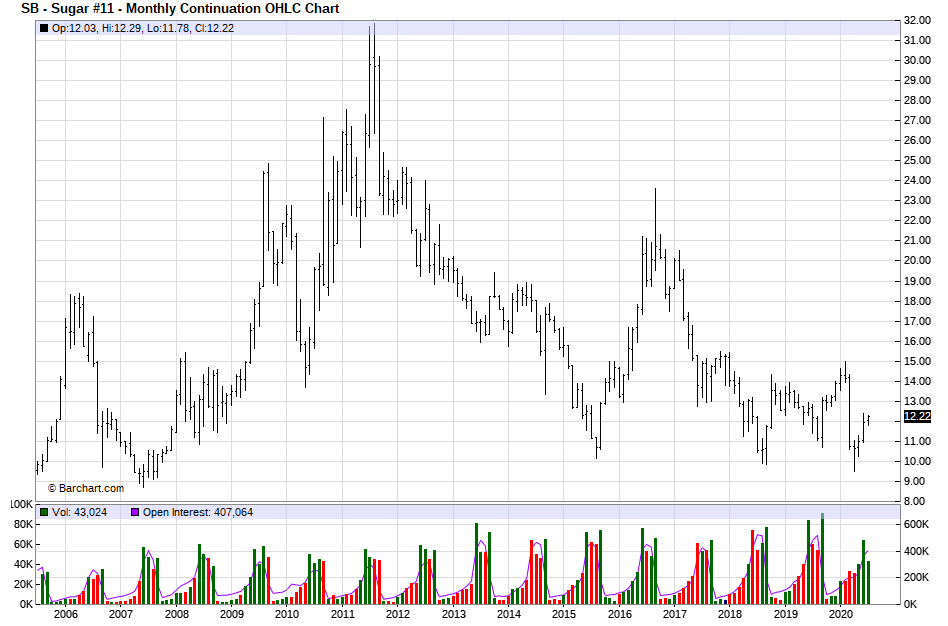
We are headed toward a cyclical low and a seasonal down period.
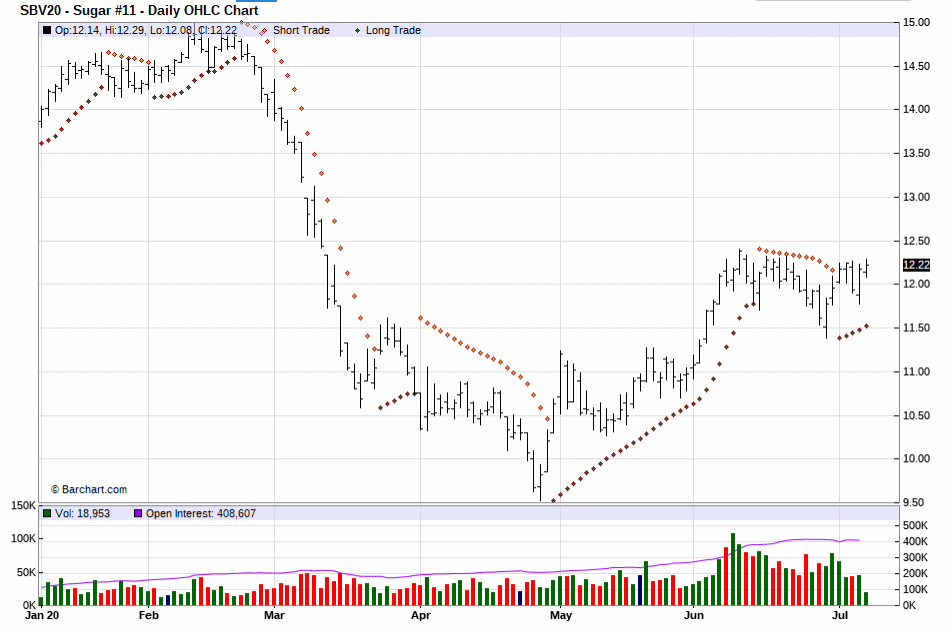
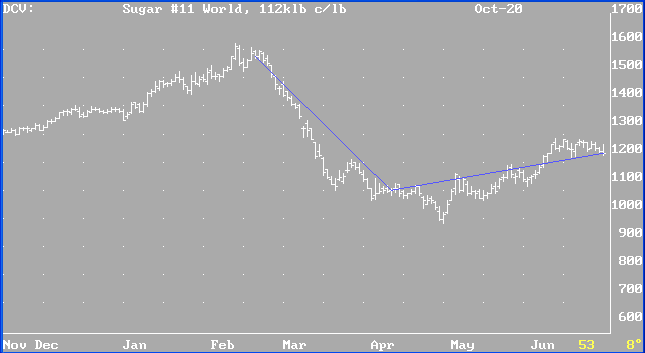
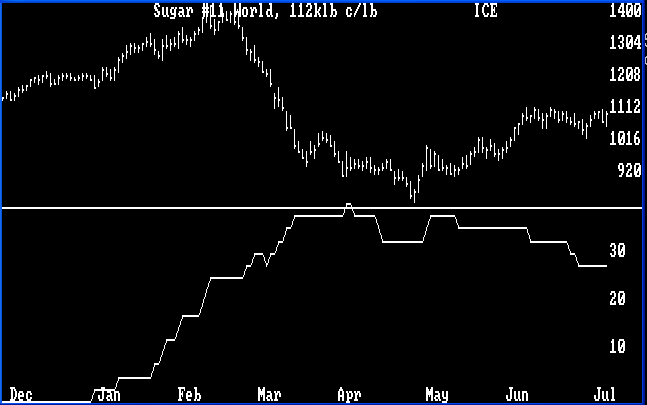
Our best-performing internal program is "DCV" (Daily Cumulative Volume). It is giving a buy signal.
Results of "DCV" for Sugar (blue lines = successful trades, red, unsuccessful):
(Always in the market.)
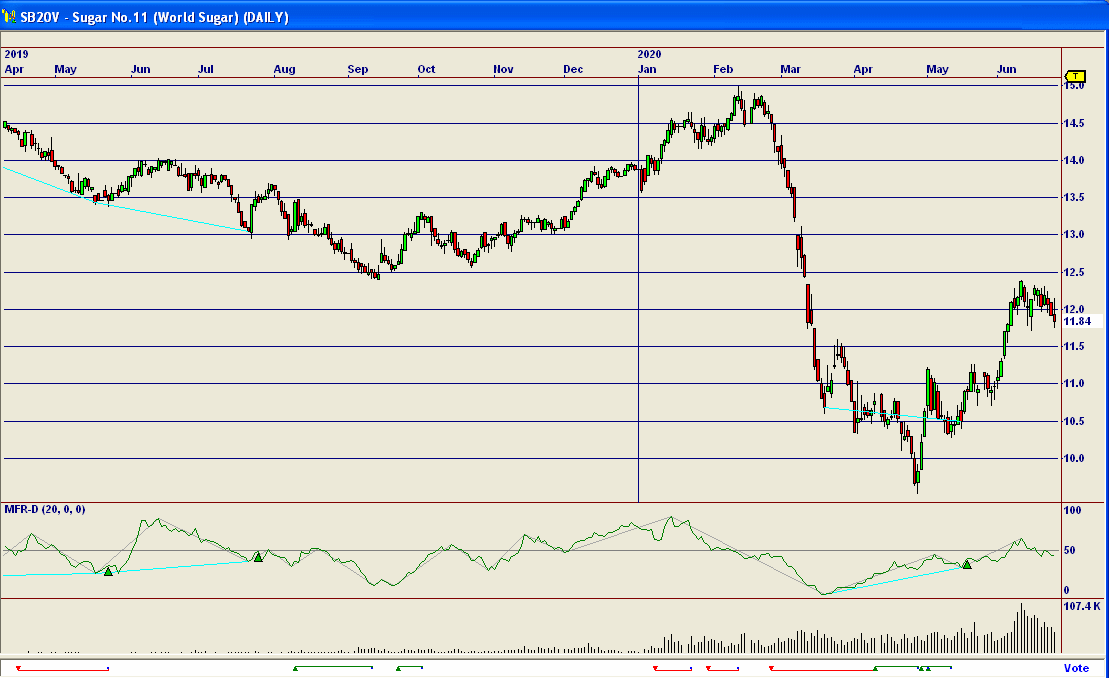
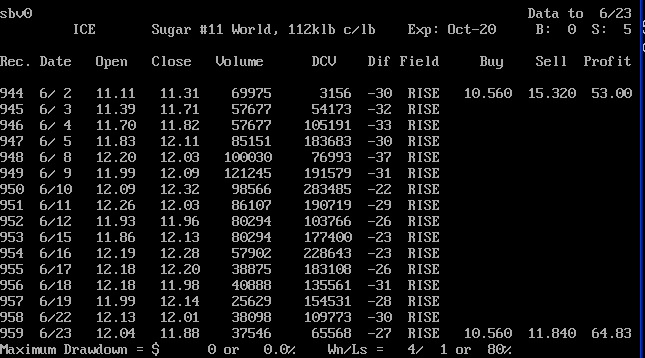
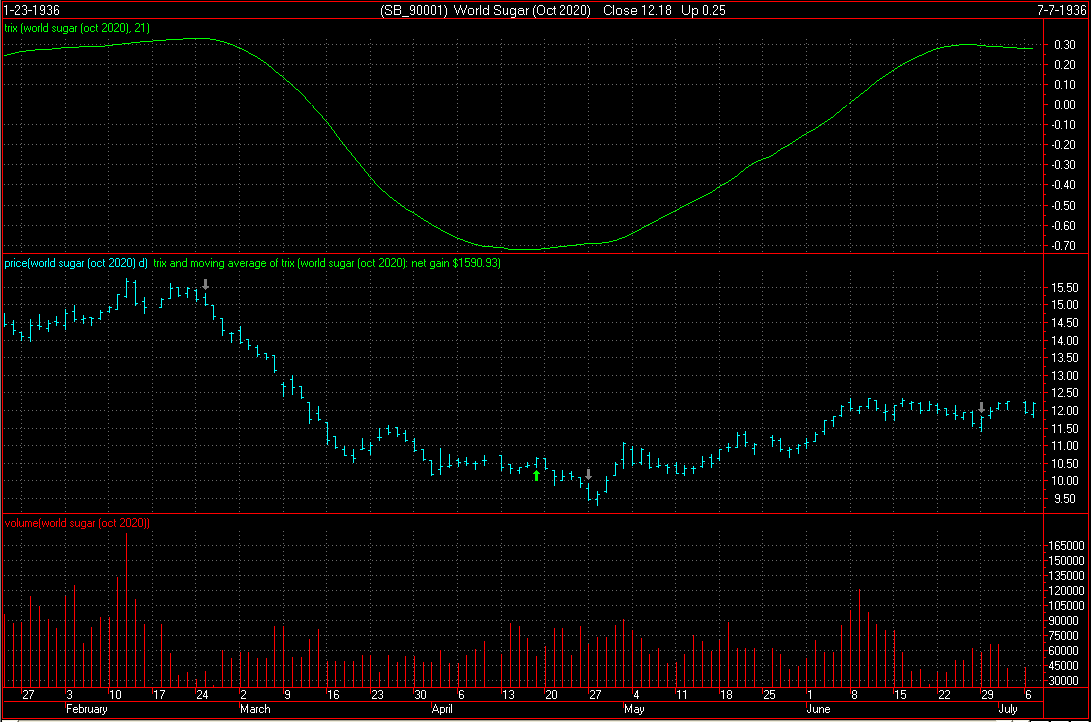
Our third system has triggered a sell signal. (Note, disregard the year on the chart. Our regular readers know this is not a Y2K-compliant system, but it still works.)
The point value is $1,120 Initial margin on a single contract is $ 1,047. Use of options is not advised.
Scale trade buyers are entering the market for the long term in this price range.
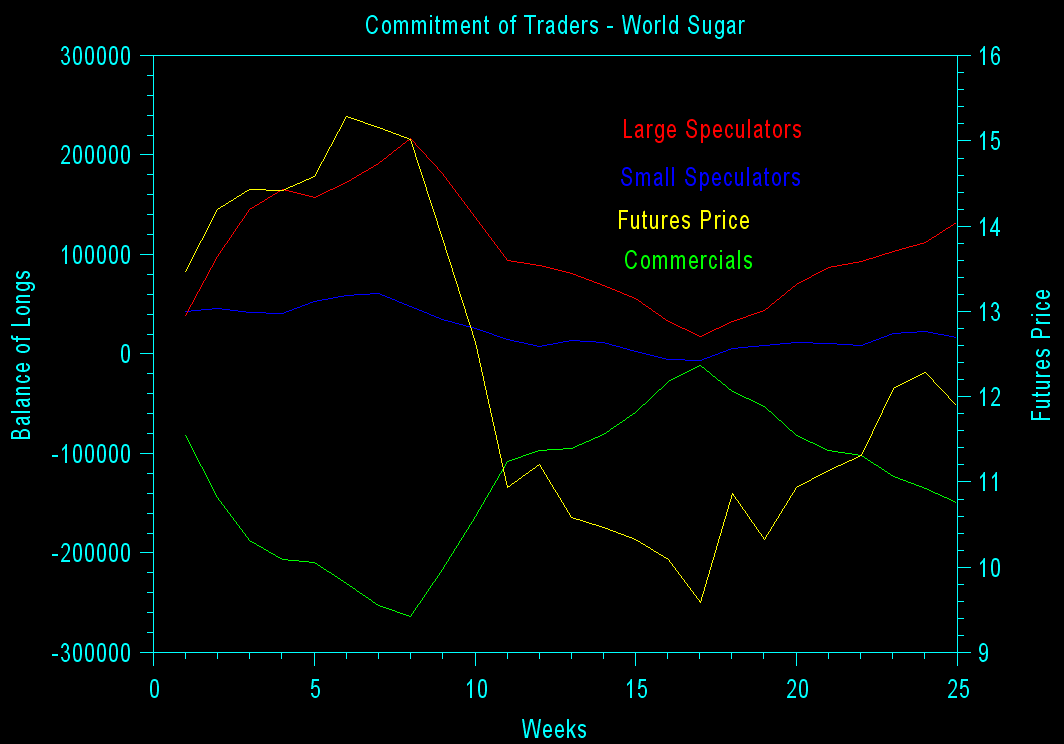
In the chart below, the yellow line is the futures price, read on the right axis. All other colors are read on the left axis. Blue is small speculators. Red is large speculators. Green is commercials. Large speculators with the best track record are getting increasingly-long.
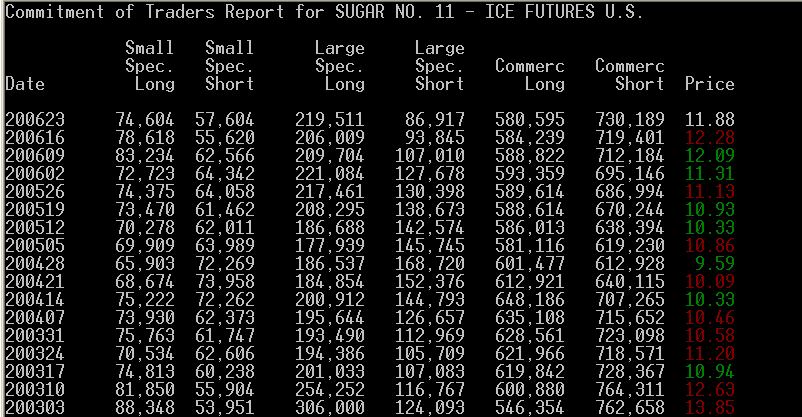
Interpretation of a Different Site Below (Their trader categories may vary from ours):
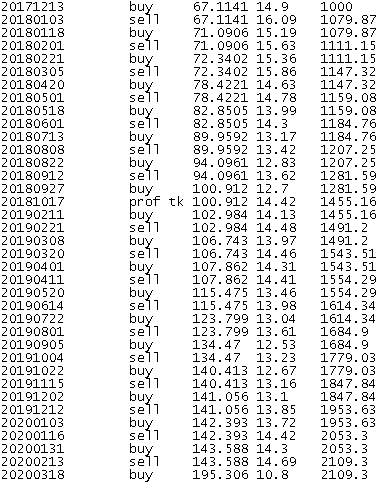
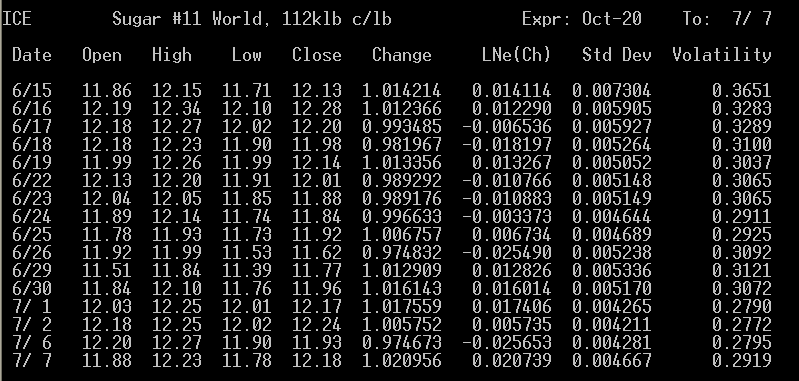
The average volatility shown below suggests that a downtrend remains intact from the last volatility low point.
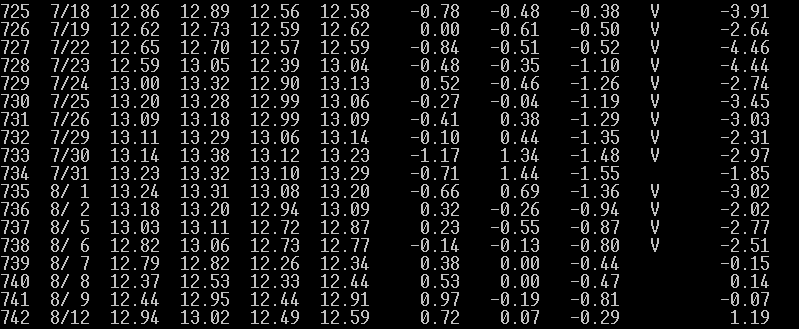
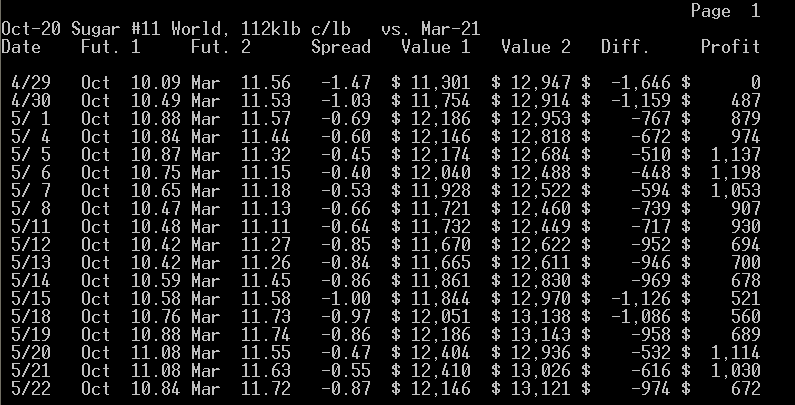
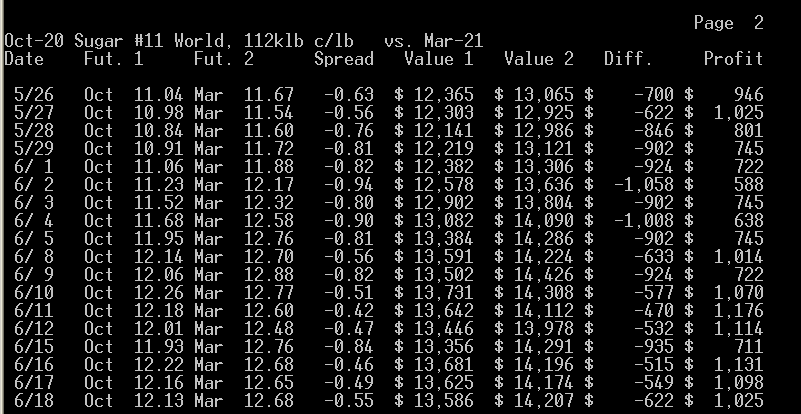
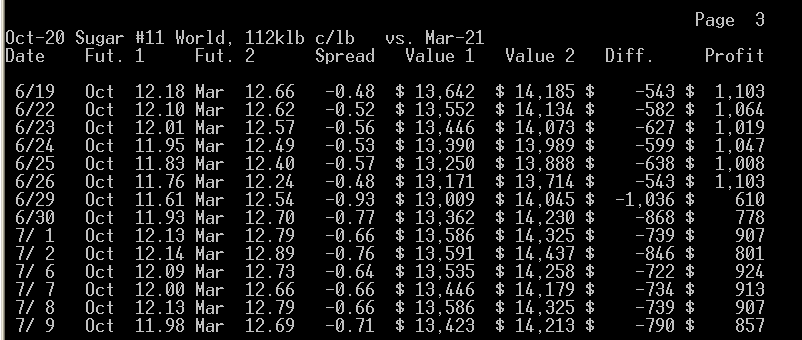
What the Oct. - Mar. calendar spread suggests to us is that buying the near contract and selling the far one is at most times not profitable, which we think is a sign that these futures may go down in the long run. This disagrees with our ultimate conclusion. The best time to enter or leave the above spread is when it is at -0.45 or narrower buying the far as prices are rising and then selling the near, and exiting or entering when it is at -0.80 or wider selling the far as prices are falling and then buying the near. At this time, we appear to be approaching the sell the far, buy the near point.
To view the chart below correctly use Microsoft Internet Explorer.
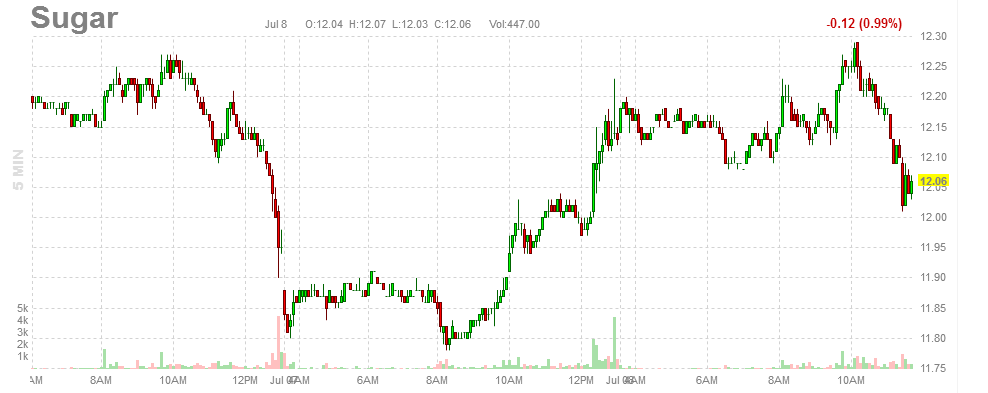
Here's an intraday chart for a previous day ( 7/7 ).
Introduction
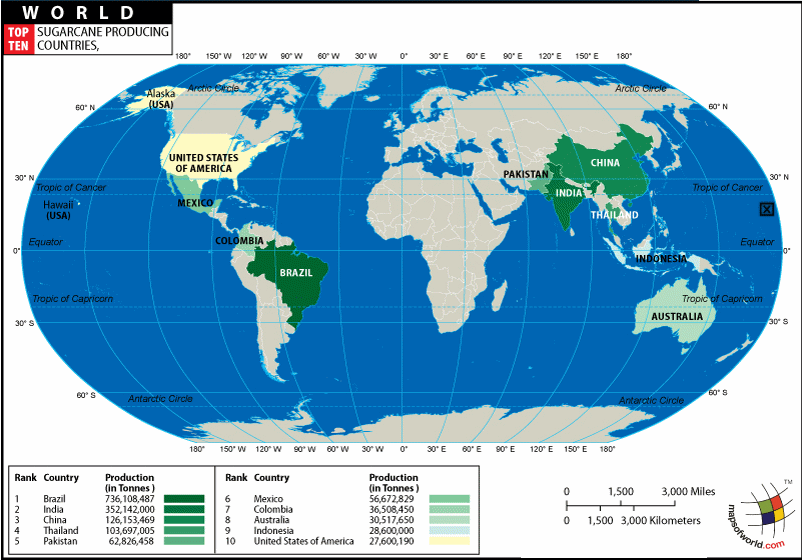
Brazil is the largest producer of cane sugar in the world. No sugar at all is any longer proudced in Hawaii. Brazil is flooding the world market with cane sugar because of diversion of its use away from ethanol there. Future energy prices will have a lot of impact on sugar. Technically, we are seeing a sort of oscillatory situation of prices around current levels which are near or below the cost of productdion. That alone should help form a base for sugar. While prices are not going to the moon any time soon, this commodity presents low risk trading opportunities which currently slightly seem to favor the upside.
Intermarket Analysis


Parabolic Chart
Nirvana Chart
News Analysis
Point & Figure Chart
 17.0|                                                                  T  7/ 7
     | ICE - Oct-20 Sugar #11 World, 112klb c/lb   Cm.=0.03  Lim.= 0.3
     |
     |
     |
 16.0|_________________________________________________________________________
     |X
     |XO      X
     |XO      XO              X X
     |XOX     XO              XOXO
 15.0|XOXO____XO____X_________XOXO_____________________________________________
     |XOXO    XO    XO        XO O
     |XOXO    XOX X XO        X  O
     |XO O    XOXOXOXOX       X  O
     |X  O    XOXOXOXOXO      X  O
     |X  O    XOXOXOXOXO      X  O
 14.0|X__O__X_XO_OXO_OXO______X__O_____________________________________________
     |X  O  XOX  OX  O OX     X  O
     |X  O  XOX  OX    OXO    X  O
     |   O  XOX  OX    OXO    X  O
     |   OX XOX  O     OXO    X  O
 13.0|___OXOXOX________OXOX___X__O_____________________________________________
     |   OXOXOX        OXOXO  X  O
     |   O OXOX        O OXOX X  O
     |     OXOX          O OXOX  O
     |     OXOX            OXOX  O
 12.0|_____O_O_____________OXO___O____X_X______________________________________
     |                     O     O    XOX
     |                           O    XOX
     |                           O    XO
     |                           OX   X
 11.0|___________________________OXO__X________________________________________
     |                           OXOX X
     |                           O OXOX
     |                             OXOX
     |                             OXO
 10.0|_____________________________OX__________________________________________
     |                             OX
     |                             OX
     |                             O
     |
  9.0|----|----|----|----|----|----|----|----|----|----|----|----|----|----|---
              1111           11
      56668889001211223467789012223345567
      10110131032102121201202211122330120
      14196004109375588935475234964108991
The above chart is giving a conventional buy signal.
Cyclical and Seasonal Factors
Internal Program
Third System Confirmation
Margin
Historic Range
Commitment of Traders

Volatility / Probable Range

Possible Future Prices
Calendar Spread
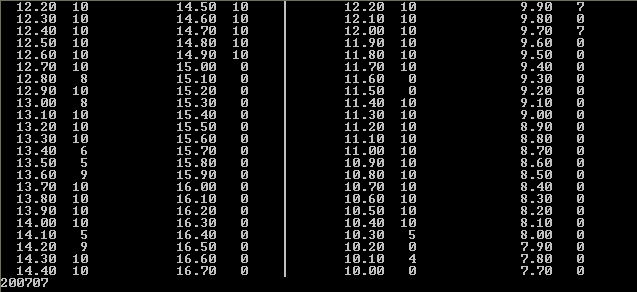
Level Table:
 16.0|                                                                  T  7/ 7
 ICE - Oct-20 Sugar #11 World, 112klb c/lb   Cm.=0.03  Lim.= 0.3
     |
     |QQQ
     |QQQQQQ
 15.0|QQQQQQQ__________________________________________________________________
     |PQQQQQ
     |PPPPQR
     |OOPPPPPPPPRR
     |OOOOOOOPPPPPRR
 14.0|OOOOOPRRR________________________________________________________________
     |NOOPRRR
     |NRR
     |AANNNNNRR
     |AAAMMMMMMMMNNNNNNNR
 13.0|AABBBBBBBLLLMMMNNR_______________________________________________________
     |AABBBBBBCCLLNR
     |AABBCCCCCCGKKKLLLLLRR
     |AAABCCCCCCCCDDDFFFFFGGGJJKKKKKKKKRRS
     |BCCDDDDDDFFGGGGGGHHHJJJJJJJJRS
 12.0|DDDDDEEFGGHHHHHHHJJJSYYYYYYZZZZ[[________________________________________
     |EEEEFFFFHHSSYYYYYYYZZZZZ[[   <<<
     |EEEEEEESSXYYZZZZZ[
     |SXXZZ
     |SSTTTXXZ
 11.0|SSSSTTWXXXXX_____________________________________________________________
     |SSSTVWWXXXXXX
     |SSSTTVVVVWWXXXX
     |STTTTTUUUUVVVVWWWW
     |TTTTUUUUUUVVVWWWWWWW
 10.0|TTUUUUVVWWWW_____________________________________________________________
     |UUVV
     |VVV
     |VV
     |V
  9.0|_________________________________________________________________________
     |
     |
     |
     |
  8.0|-A-B-C-D-E-F-G-H-J-K-L-M-N-O-P-Q-R-S-T-U-V-W-X-Y-Z----|----|-- TPO=-0.722
                   1 1 1 1 1 1 1
       7 7 8 8 9 9 0 0 0 1 1 2 2 1 1 2 2 3 3 4 4 5 5 6 6 7           7
       1 2 0 2 0 1 0 1 3 1 2 1 2 1 2 1 2 1 2 0 2 0 2 0 1 0           0
       0 3 6 0 4 8 2 6 0 3 7 2 7 3 8 1 6 1 5 8 3 7 1 5 9 6           7
Other Factors
