![]()
Introduction Nirvana Internal Progrm Historic Range02-01-2020: March NASDAQ 100 Index: Coronavirus May Trigger Correction
(Click on links below. Whole page needs to load before links work.)
Intermarket
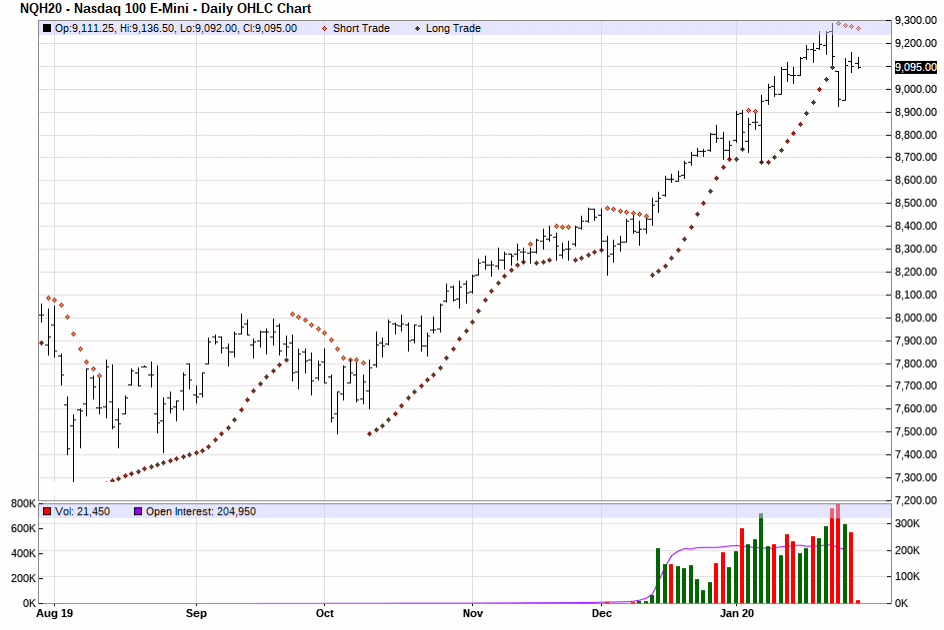
Parabolic
News
Point & Figure
Cyclic/Seasonal
Third System
Margin
Commitment
Volatility


We fed the NASDAQ 100 Index, S&P 500 Index, and the U.S. Dollar Index into a neural network to get the following result:
March NASDAQ 100 Index:
March NASDAQ 100 Index:
On the one hand, equities continue to see the risk of a global pandemic as small. But on the other, traders are beginning to express concern about slowing of the Chinese economy due to the virus. There does not seem to be much in the way of good news about to come out of China, while negative news could further sink global markets. The U.S. Federal Reserve Chairman made comments suggesting the Chinese slowdown will be a broad negative for the world and economic news gives credence to that case. Carnival shares fell on concern of the coronavirus will have an effect on the cruise and travel industry. Seven thousand passengers were quarantined on shipboard in an Italian port as of now. Earinngs reports from some major corporations are not as good as many had expected. Housing sales are slowing. Auto sales are slowing. There was some positive news from Tesla reporting "blowout results" to cushion further declines. There seems unending bad news from Boeing and a worsening macro environment for oil patch stocks. Boeing suspended all production of its 737 MAX jetliner. Royal Dutch Shell said it could rachet up divestments as it reported a sharp drop in profit for 2019. "Alll macroeconomic indicators are working against us," said Shell's Chief Executive, Ben van Beurden. Shell also was cutting the value of its U.S. Appalachia assets amid low natural gas prices. These things have interferred with Shell's efforts to transform itself into a lower-carbon emissions business. It expects to divest $10 billion in assets in the 2019-2020 period, already having achieved half of that. That figure could eventually increase to $13 billion according to the CEO. There was negative earnings news from DuPont. One major analyst concludes, the risk or being long now is much greater than the potential reward. Facebook warned about slowing revenue. The fact that the NASDAQ has been the stellar performer on the upside sllows that traders should consider it the best "short."
Moody's ratings on Shell remain positive with no immediate negative rating pressure even with weak fourth quarter results.
Nearly a third of NASDAQ stocks are now in correction, according to NASDAQ itself. The U.S. economy missed Trump's 3% target growth in 2019. Fourth quarter GDP increased at a 2.1% annualized rate. Consumer spending slowed and business investment was a drag. Trade boosted growth but inventories subtracted fromt he GDP. Growth was the slowest since 2016.
Three interest rate cuts from the Federal Reserve hlped to keep the longest economic expansion in history, now in its 11th year. At latest meeting, Fed left rates unchanged. The Trump Administration's 18-month long trade war with China fueled fears of a recession. Economists do not see a boost to the U.S. economy after this month's signing of a Phase 1 trade deal with China because U.S. tariffs remained in effect on $360 billion of Chinese imports, about 2/3 of the total.
A 40-day strike at General Motors weighed on motor vehicle inventories. Inventories rose at a $6.5 billion rate in the fourth quarter, after a $69.4 billion gain in the July-September quarter. Inventory investment chopped 1.09% from GDP growth last quarter.
Recently, the S&P 500 Index suffered its worst day in nearly four months on coronavirus concerns. More recently, surges in shares of Apple, Boeing, and General Electric happened after thier results oivershadoiwed concerns about the economic impact of the fast-spreading coronavirus. Intel headed NASDAQ winners recently, with semiconductor maker Boadcom close behind, announcing new deals with Apple worth $15 billion.
NASDAQ concerns are, can Tech earings reinforce sky high valuations? Is the world about to learn if a $1 Trillion Tech rally was a good idea? Twenty-six contituents are about to report earnings next week.
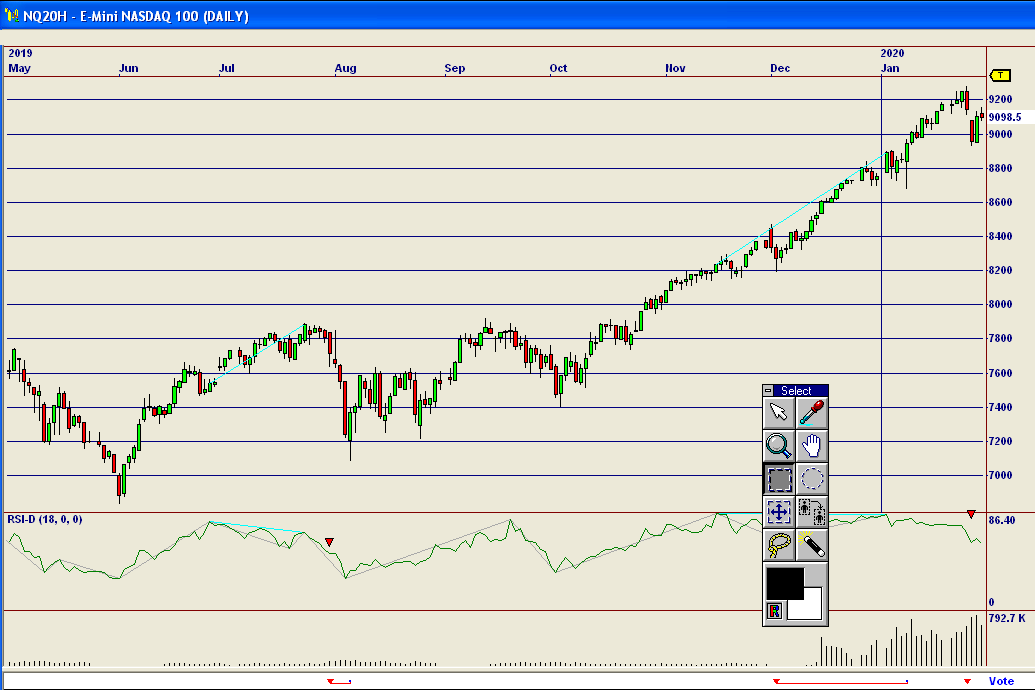
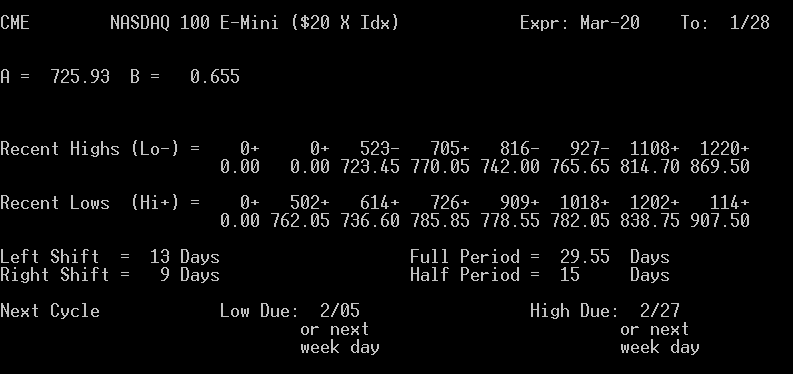
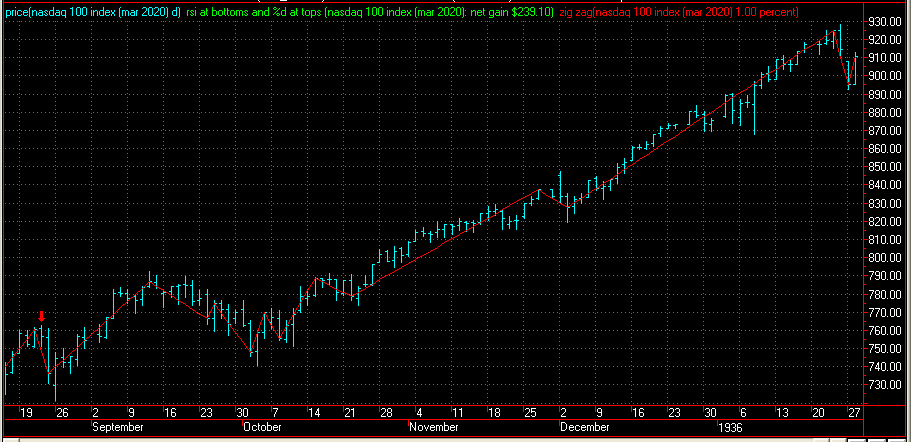
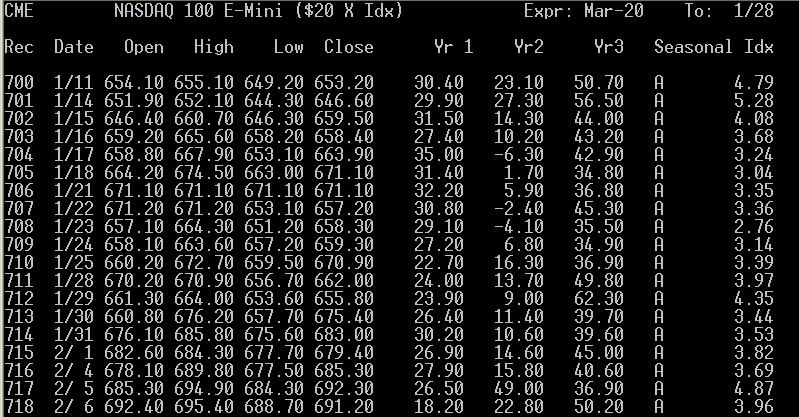
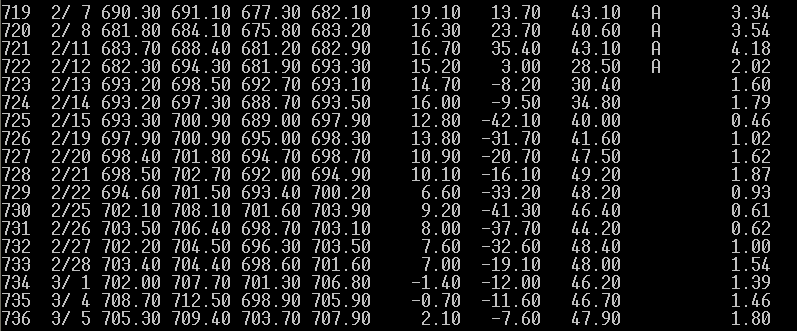
We are headed toward a cyclical high and a seasonal down period.
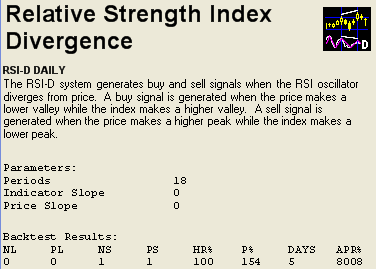
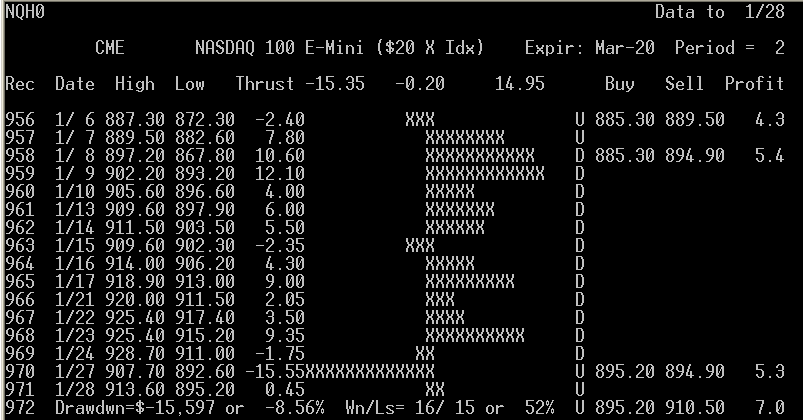
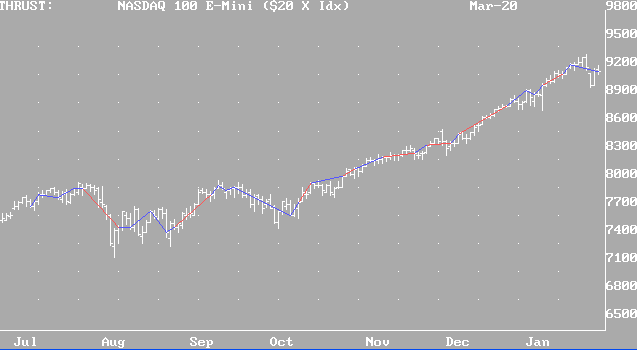
Our best-performing internal program is "Thrust". It is giving a buy signal.
Results of "Thrust" for NASDAQ 100 (blue lines = successful trades, red, unsuccessful):
(Always in the market.)
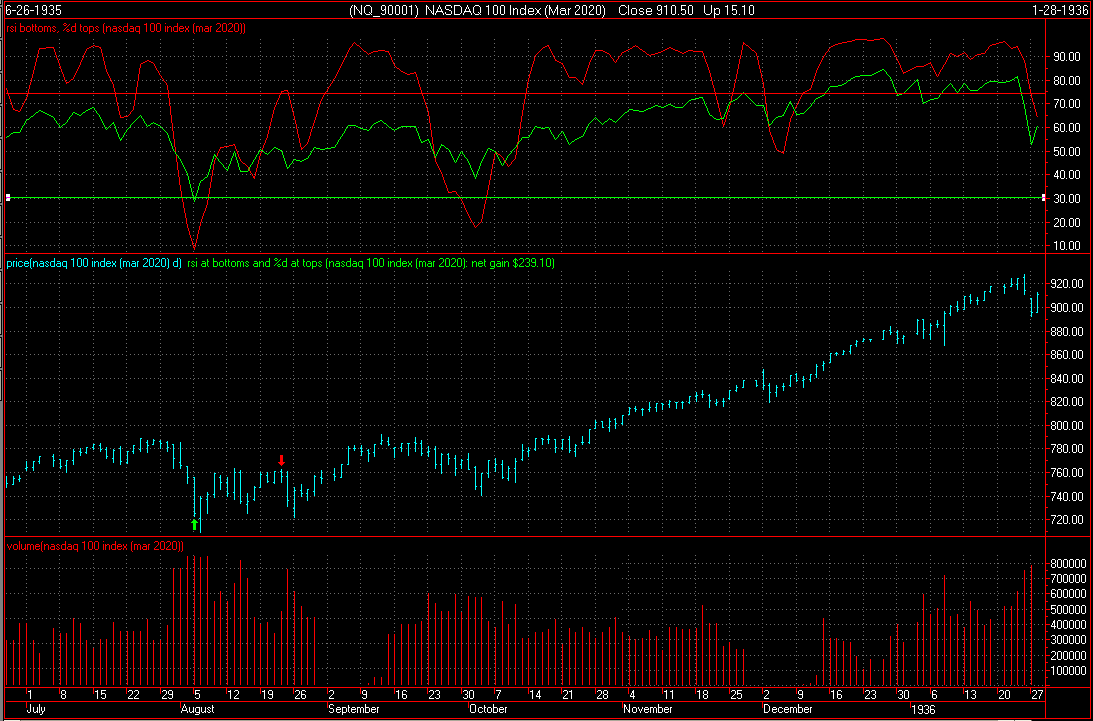
Our third system has triggered a long-term sell signal. (Note, disregard the year on the chart. Our regular readers know this is not a Y2K-compliant system, but it still works.)
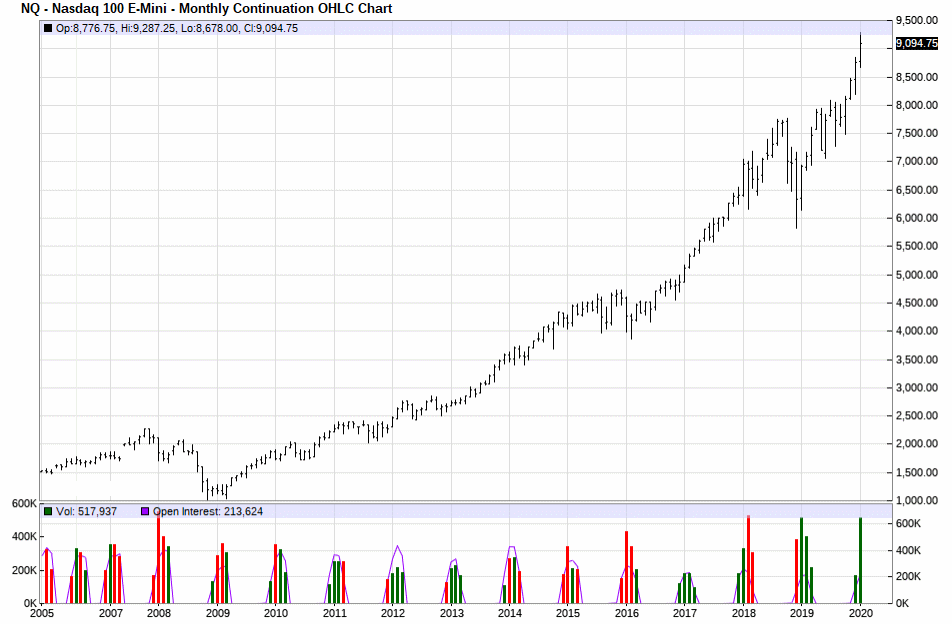
The point value is $200 for the mini contract. Initial margin on a single contract is $8,250. Use of options is not advised.
Scale trade sellers are entering the market for the long term in this price range.
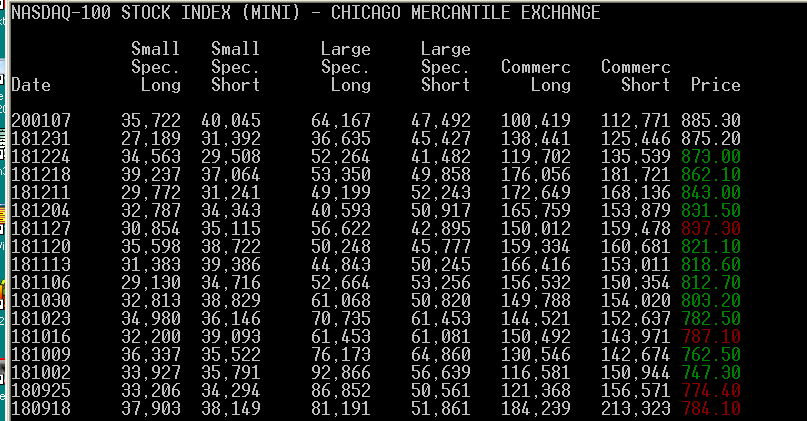
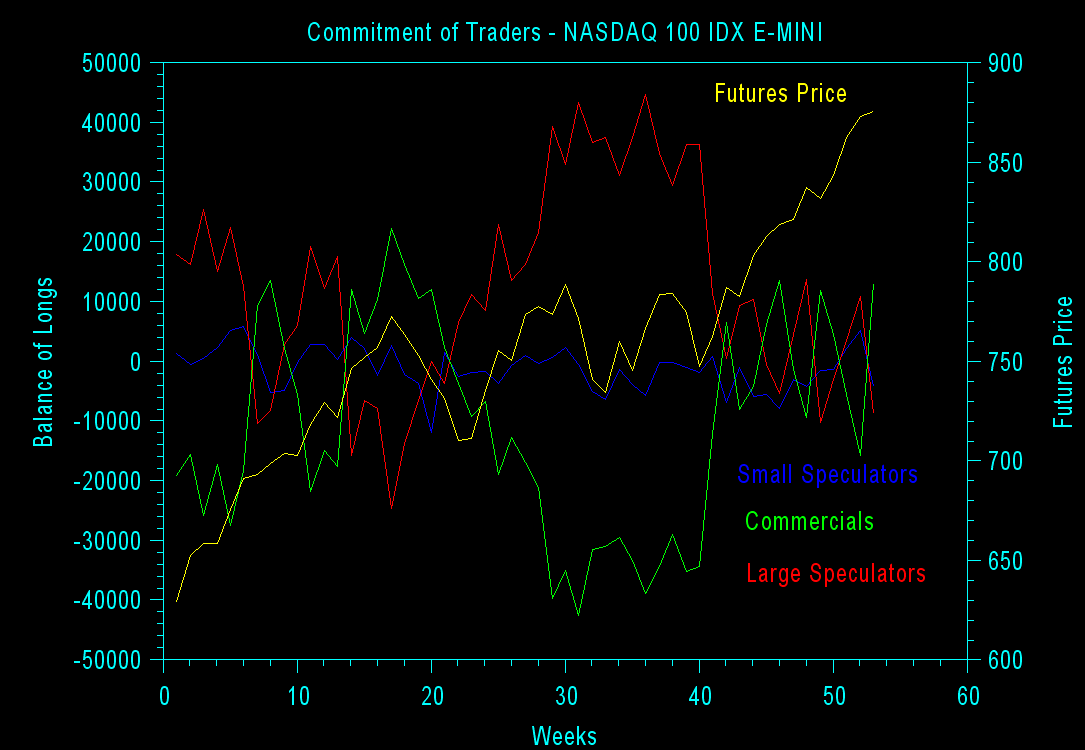
In the chart below, the yellow line is the futures price, read on the right axis. All other colors are read on the left axis. Blue is small speculators. Red is large speculators. Green is commercials. Large speculators with the best track record are getting increasingly-short.
Interpretation of a Different Site Below (Their trader categories may vary from ours):
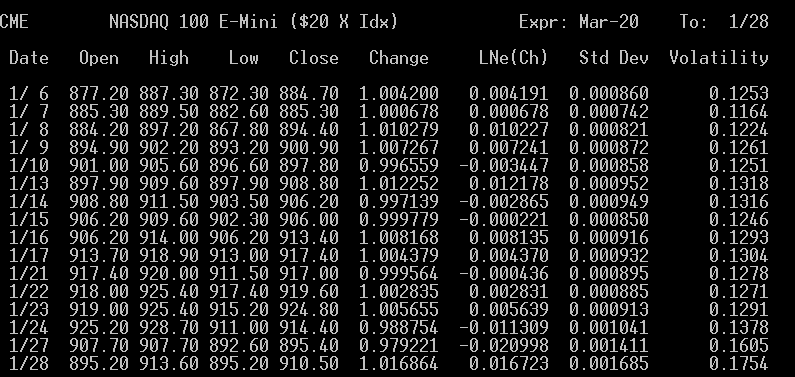
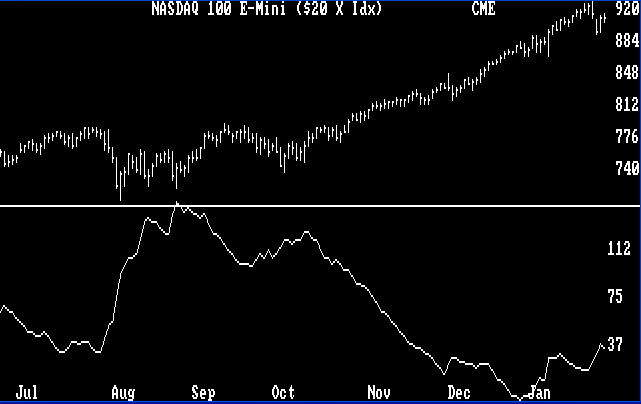
The average volatility shown below suggests that a change in major trend to down is imminent near a volatility low point.
We feel the NASDAQ 100 Index E-MIni options market offers insufficient low risk opportunities, and should be avoided.
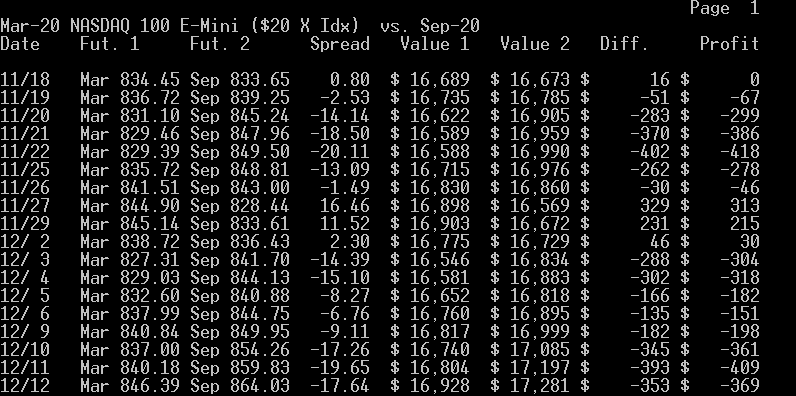
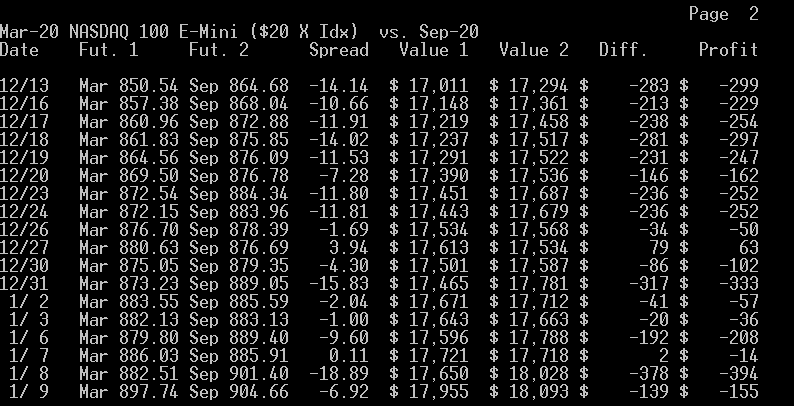
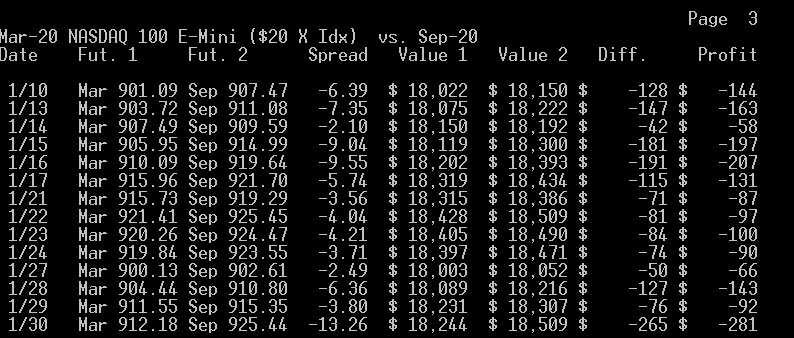
What the Mar. - Sep. calendar spread suggests to us is that buying the near contract and selling the far one is at most times not profitable, which we think is a sign that these futures may go down in the long run. The best time to enter or leave the above spread is when it is at +11.00 or narrower buying the far as prices are rising and then selling the near, and exiting or entering when it is at -14.00 or wider selling the far as prices are falling and then buying the near. At this time, we appear to be midway with no particular trend detected in either direction.
To view the chart below correctly use Microsoft Internet Explorer.
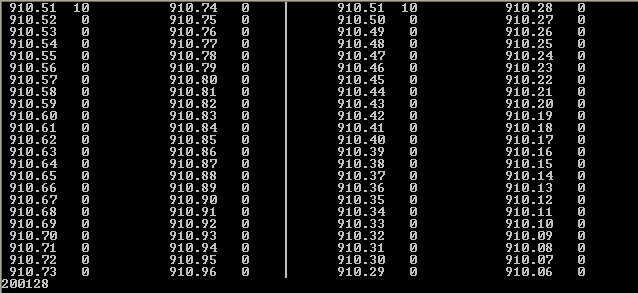
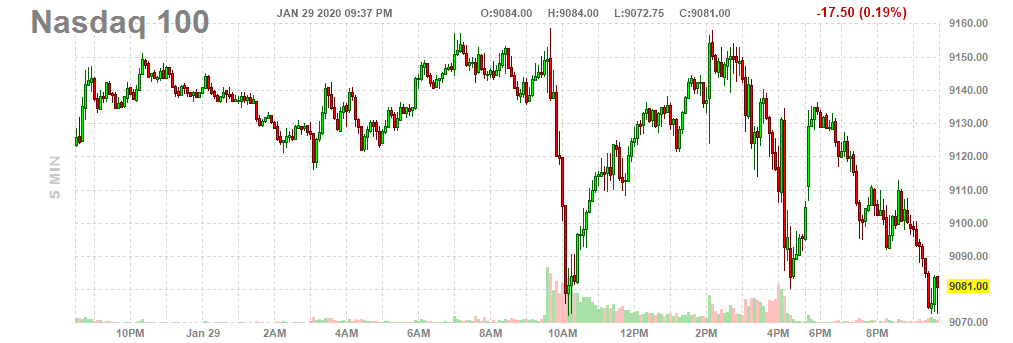
Here's an intraday chart for a previous day ( 2/01 ).
Introduction
There's a lot of static about how the coronavirus is affecting bond markets, may affect equity markets. The mere acceptance that this could be a "trigger" issue seems to underscore to us the many other weaknesses in the heavy tech-laden NASDAQ 100 Index are far more likely to initiate a correction. There is no doubt the markets are heavily over-valued by historic perspectives and even the most optimistic earnings reports may not be sufficient to offset that fact, particularly as there is increasing evidence of a slowing economy in everything from housing to auto sales.
Intermarket Analysis


Parabolic Chart
Nirvana Chart
News Analysis
Point & Figure Chart
970.0|                                                                  T  1/28
     | CME - Mar-20 NASDAQ 100 E-Mini ($20 X Idx)  Cm.=0.01  Lim.= 0.2
     |
     |
     |
930.0|_________________________________________________________________________
     |
     |                              X
     |                              X
     |                              X
890.0|______________________________X__________________________________________
     |                              X
     |                              X
     |                              X
     |                              X
850.0|______________________________X__________________________________________
     |                              X
     |                              X
     |                              X
     |                              X
810.0|______________________________X__________________________________________
     |                              X
     |                              X
     |                              X
     |                      X     X X
     |                      X     X X
770.0|______________________XO____XOX__________________________________________
     |                    X XO    XOX
     |            X       XOXOX X XOX
     |            XO      XOXOXOXOXO
     |          X XO      XOXOXOXOX
730.0|__________XOXO______XOXOXO_OX____________________________________________
     |        X XOXOX     XOXOX  O
     |        XOXO OXO    XOXO
     |    X   XOX  OXOX   XOX
     |    XO  XO   OXOXOX XOX
690.0|X___XO__X____O_OXOXOXO___________________________________________________
     |XO  XO  X      OXOXOX
     |XO  XOX X      OXOXOX
     |XO  XOXOX      OXOXOX
     |XOX XOXOX      O OXOX
650.0|XOXOXOXO_________OXOX____________________________________________________
     |XOXOXOX          O OX
     |XOXOXO             OX
     |XO OX              OX
     |X  O               OX
610.0|X__________________OX____________________________________________________
     |X                  OX
     |X                  OX
     |                   OX
     |                   O
570.0|_________________________________________________________________________
     |
     |
     |
     |
530.0|----|----|----|----|----|----|----|----|----|----|----|----|----|----|---
      1            11111111        11
      0222234456778000011225688888800
      0000111202130012312020000122201
      5568292475008563128469728526921
The above chart is giving a conventional buy signal.
Cyclical and Seasonal Factors
Internal Program
Third System Confirmation
Margin
Historic Range
Commitment of Traders

Volatility / Probable Range

Possible Future Prices
Option Recommendation
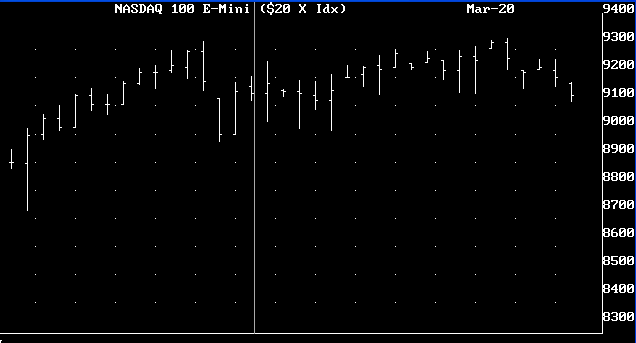
To further attempt to explain this, let's say you wanted to buy (1) NASDAQ 100 Index 9000 Put. It would cost you 145 points @ $20/point or $2,900. To break even the NASDAQ 100 Index would have to drop to 8855, but the way this runaway market has been behaving, if the index got to 9100, which likely it could, you would be out $4,900, and this element of risk is simply too great,and
there is really no way with available options to moderate the risk to some smaller level. Some commodity options markets can be used to moderate risk. This is not one of them.
Calendar Spread
Level Table:
 955 |                                                                 R  1/28
 CME - Mar-20 NASDAQ 100 E-Mini ($20 X Idx)  Cm.=0.01  Lim.= 0.2
     |
     |
     |ZZZ
905.0|ZZZZ_____________________________________________________________________
     |ZZZZ[[   <<<
     |YY[
     |YYYYYY
     |XXXYYYYYY
855.0|XXX______________________________________________________________________
     |XX
     |WWXX
     |WWWWWWWW
     |VVVVVVVWW
805.0|UUUUUUVVV________________________________________________________________
     |TUUUU
     |TU
     |MMMNNNNNNNQQQRRRRTTTTTTTT
     |FGGLLMMMMMNNNQQQQQRRRRRRSSST
755.0|FGGGGGGGKLLLLLMMNNNQRRRRSSSSSSS__________________________________________
     |EFFFFFFFFGGGKKKLLLLNOOOOOOPPPPPPPQSSSSSS
     |EEEEEHHHHKKKKOOOOOOOPPPPPS
     |DDEHHHHHHHKKKKOOOOOPP
     |DDDDDDDEEEHHHHHJJJKOOOOP
705.0|CDDJJJKO_________________________________________________________________
     |BBCCCCCCCJJJ
     |ABBBBBBBCCCJJ
     |AAAAAAABJ
     |A
655.0|A________________________________________________________________________
     |
     |
     |
     |
605.0|-A-B-C-D-E-F-G-H-J-K-L-M-N-O-P-Q-R-S-T-U-V-W-X-Y-Z----|----|-- TPO= 0.150
                                         1 1 1 1 1 1 1
       1 2 2 3 3 4 4 5 5 6 6 7 7 8 8 9 9 0 0 0 1 1 2 2 1 1           1
       3 1 2 1 2 1 2 0 2 0 2 0 2 0 1 0 1 0 1 2 1 2 1 2 1 2           2
       0 2 7 3 7 0 5 9 3 7 1 8 2 5 9 3 7 1 5 9 2 6 1 6 0 7           8
Other Factors
                 Risk Versus Opportunity Report
                ________________________________

               NQH0    Mar NASDAQ 100 Index

                      High Price:  9347
                   Current Price:  9105
                       Low Price:  8613

                            Risk: -0.054
                     Opportunity: -0.110

                    (O/R) Ratio =  2.033