![]()
Introduction Nirvana Internal Progrm Historic Range
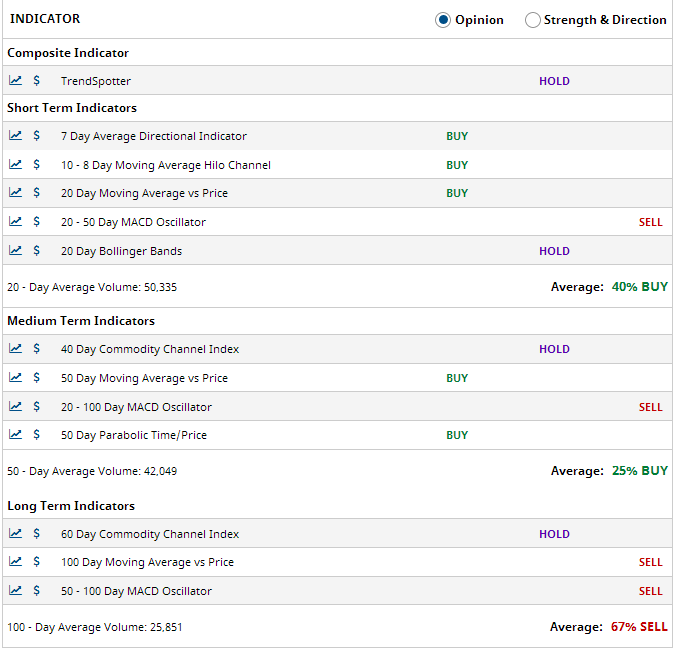
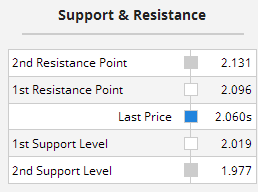
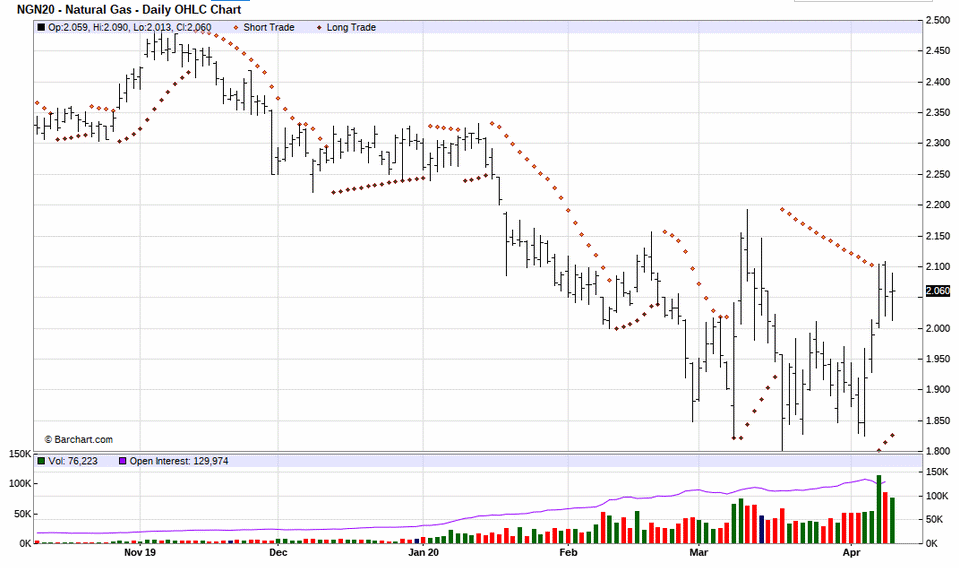
For whatever reason though, natural gas is starting to go its own way among the other energy complex contracts. While it looks negative along with them, it is not AS negative, and some analysts find reasons for hope for this using natural gas as a "transition fuel". That would be in the middle of transisting from coal to sustainable and renewable energy sources in places like India and China, where environmental concerns are challenged by ecohomic concerns. If we rely upon our "system" the technical indicators predominantly favor an upmove from here.
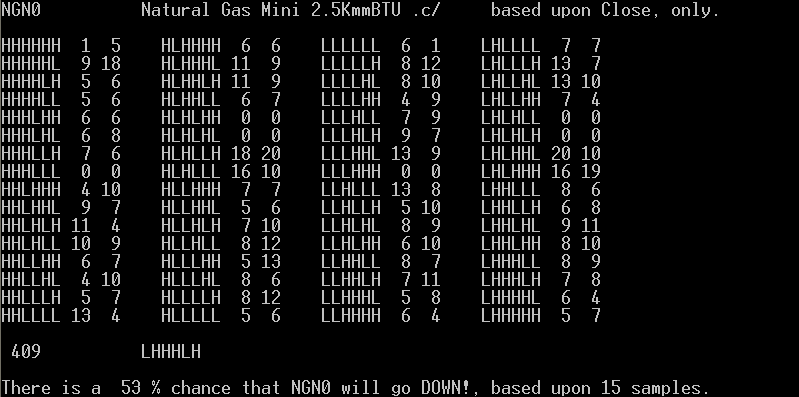
We fed Kansas wheat, Chicago wheat, and soybeans into a neural network to get the following result:
July Natural Gas:
04-13-2020: July Natural Gas: Virus, Oil Prices, Weather and the Economy Kill Demand Temporarily
(Click on links below. Whole page needs to load before links work.)
Intermarket
Parabolic
News
Point & Figure
Cyclic/Seasonal
Third System
Margin
Commitment
Volatility

Introduction
Very high amounts of crude oil are stored in whatever places inventory can be stored, including floating tanker ships. Demand for crude has fallen. Along with it, natural gas prices would seem toi naturally follow looking weak, but they are actually less affected. An opportunity to burn more natural gas in electric stream generating plants is being pressed by environmental considerations to
reduce carbon emissions and global warming. Global warming is real, and weather is not helping demand for natural gas in most parts of the nation. Injection and natural gas storage levels are considerably higher-than-normal due to reduced demand. The shutting down of oil and gas rigs due toi unprofitability is apparently having less effect on prices than sluggish demand.
Intermarket Analysis


Parabolic Chart
July Natural Gas:
Nirvana Chart
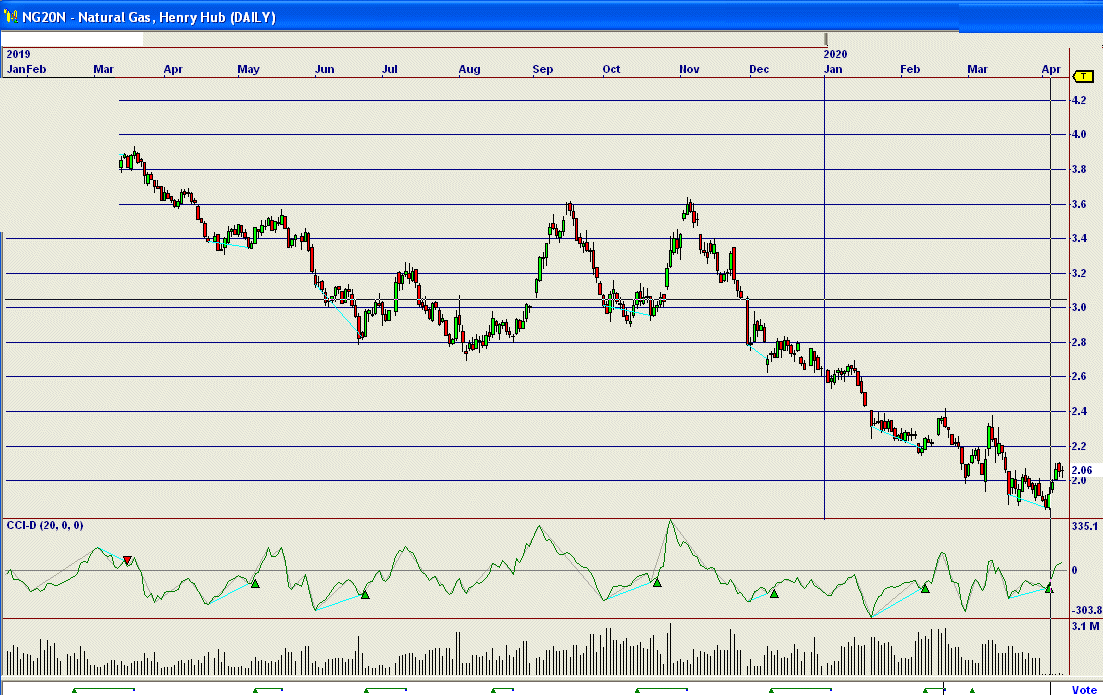
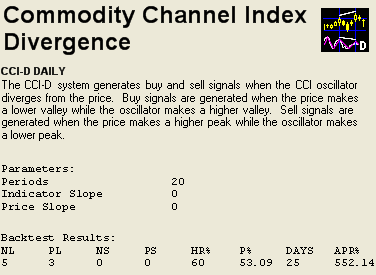
Chart pattern analysts think a "blowoff top" was achieved in natural gas futures when the 2.000 level was exceeded slightly. Potential fundamental buyers balked at paying above the psychologically significant level of 2.000. The market burned through signficant short-covering on high volume and that source ran out. Weather forecasts are predicting below normal temperatures for 2/3 of the nation. But an inventory report shows a forecast range of decline between 7 and 31 BCF. This is expected to consider natural gas at "expensive" levels and triggere a setback.
However, due to the widespread outbreak of COVID-19, and the Russia/Saudi oil war, we are already seeing a rollover in natural gas production back to 2018 levels, whcih were at about 2.8 bcf per day and could be headed for 2016 production levels which were at 1.5 bcf per day. There has been a record-breaking shut-in of energy wells, a significant cutback in rig counts, and changed frac spreads. Natural gas equities are beginning to respond favorably including Southwestern Energy, CNX Resources, EQT Corporation, Range Resources, and Cabot Oil & Gas. Companies with large liquid natural gas production are lagging. Stock charts for those companies suggest an inflection point in gas pricing is already here, but largely unappreciated in the futures market.
LNG players still explore strategic opportunities in India and China. Investors defer making decisions, developers cancel projects, and shareholders retink marketing strategies in LNG markets. In India natural gas prices are finally competitive with coal prices and there is a worldwide commitment to lower carbon emissions. Inida's use of gas to power industry and transport sectors will see
a fourfold increase in 20 years.
China sees LNG as the most cost-effective quick-fix to meet its massive demands. The window to use natural gas as a "transition fuel" is being extended in some key markets.
The latest U.S. Energy Information Administration weekly storage report showed a 38 bcf injection into undergrond storage, way above the highest wide previous estimates. It gave a test of how
COVID-19 would affect demand. The five-year average injections at this time are around 5 bcf. Total stocks now stand at 2.024 trillion cu. ft., up 876 billion cu. ft. from a year ago and 324 billion cu. ft. above the five-year average.
Nonetheless, an increasingly tight supply/demand picture began to emerge over the past week accordingn to "Natural Gas Intelligence"'s publication "Foward Looik."
According to the Federal Reserve BAnk of Kansas City, energy activity plummeted along with matching economic indicators, falling well into negative change activity, accelerating downward over the past three months. Most firms do not exect energy prices to return to profitable levels this year.
If low oil prices stay below $40/barrel, only 64% of energy firms would remain solvent after one year. Natural gas flaring was reported as a top environmental concern. There seems little optimism for the drilling business. The Fed stated, "The future drilling business activity index worsened from -16 to -78, the weakest oiutlook for activity since 4Q2014." Still it maintained price expectations for oil and natural gas liquids decreased compared to the previous quarter while price expectations for natural gas rose.
Canada's shut-in oil production from the Coronavirus is likeliy to exceed 1.1 million barrels/day in the second quarter. Regardless of OPEC curtailment, the oil market imbalance will continue to mainly be a demand-driven issue with little place to store any more new oil inventory.
SoCal Gas is starting low-inventory shut-in maintenance at the Aloiso Canyon storage facility that woudl limit injection and withdrawal capacity to zero. April has thus far seen colder-than-normal weather in Southern California, but temeratures are expected to warm up soon. SoCal Gas is cutting flowing supply about 115 MMcf/d for the Blythe Sub-Zone for the next nine days to 709 MMCf/d. Weather is seeing futures for natural gas down another notch due to warmer conditions in the rest of the nation.
In Mexico, natural gas demand hasn't fallen dramatically as in the U.S. because oif government and business efforts to combat the COVID-19 outbreak. This isnot expected to continue however,
as Mexico also is closing all non-essential businesses.
The overall conclusion from bits of news is that demand for natural gas is getting killed due the virus, low oil prices and general economic conditions.
We are headed toward a cyclical high and a seasonal down period.
News Analysis
Point & Figure Chart
 68.0|                                                                  T  4/ 9
     | NYME- Jul-20 Natural Gas Mini 2.5KmmBTU .c/ Cm.=0.01  Lim.= 0.1
     |
     |
     |             X
 63.0|_________X___X___________________________________________________________
     |         XO  X
     |         XO  X                   X
     |         XOX X                   XO  X
     |       X XOXOX                   XOX XOX
 58.0|_X_____XOXOXOXO__________________XOXOXOXOX_X_____________________________
     | XO    XOXOXOXOX X               XOXOXOXOXOXO
     | XOX X XOXOXOXOXOXO              XOXOXOXOXOXO
     | XOXOXOXO OXOXOXOXO              XOXOXOXOXO O
     | XOXOXOX  OXO OXO O              XOXO OXO   O
 53.0|_XOXOXO___OX__O___OX_X___________XOX__OX____O____________________________
     |O O OX    OX      OXOXO          XOX  O     O
     |    OX    OX      OXOXO          XOX        O
     |    O     OX      OXO O          XO         O
     |          OX      OX  O          X          OX
     |          OX      OX  O          X          OX
 48.0|__________OX______OX__O__________X__________OXO__________________________
     |          OX      OX  OX         X          OXO
     |          OX      OX  OXO        X          O OX
     |          O       OX  OXO        X            OXO
     |                  O   OXOX       X            OXO
 43.0|______________________O_OXO__X_X_X____________OXO________________________
     |                        OXO  XOXOX            OXO
     |                        O O  XOXOX            OXO
     |                          OX XO OX            OXO
     |                          OXOX  OX            O O
 38.0|__________________________OXOX__OX______________O________________________
     |                          OXO   OX              O
     |                          O     OX              O
     |                                O               O  X X
     |                                                O  XOXO
 33.0|________________________________________________O__XOXO__________________
     |                                                O  XOXO
     |                                                OX XOXO
     |                                                OXOXOXO
     |                                                OXOXO O
 28.0|________________________________________________O_OX__O__________________
     |                                                  O   O
     |                                                      O
     |                                                      O
     |                                                      O
 23.0|______________________________________________________O__________________
     |                                                      O
     |                                                      O
     |                                                      O
     |                                                      O
 18.0|_________________________________________________________________________
     |
     |
     |
     |
 13.0|----|----|----|----|----|----|----|----|----|----|----|----|----|----|---
               11111          1111      1111111111111      11
      6677889990012211111345580112111125111111222222211779901
      1202020130211201223021330022011102112222000112211020221
      3858936307082132061641012948518913560018346020048893698
The above chart is giving a conventional sell signal.
Cyclical and Seasonal Factors
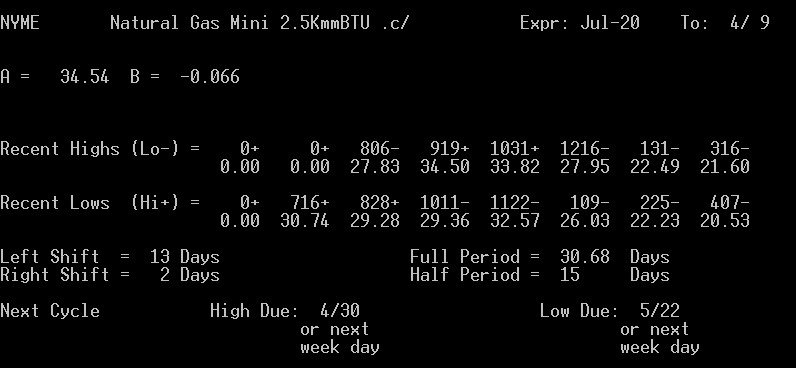
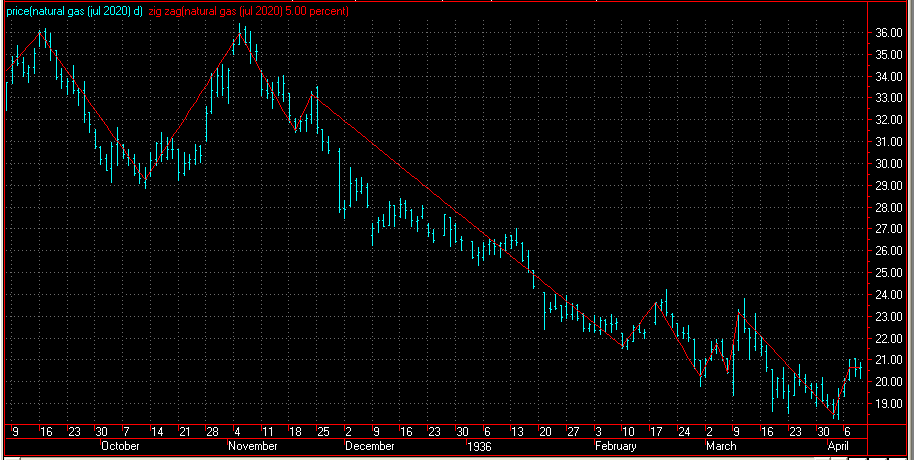
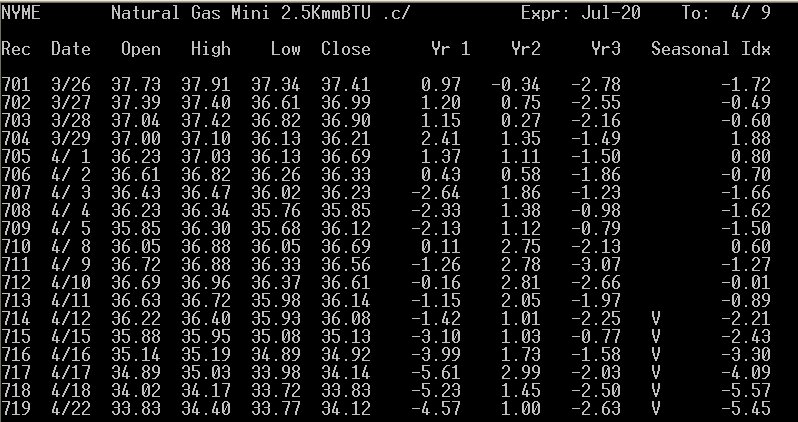
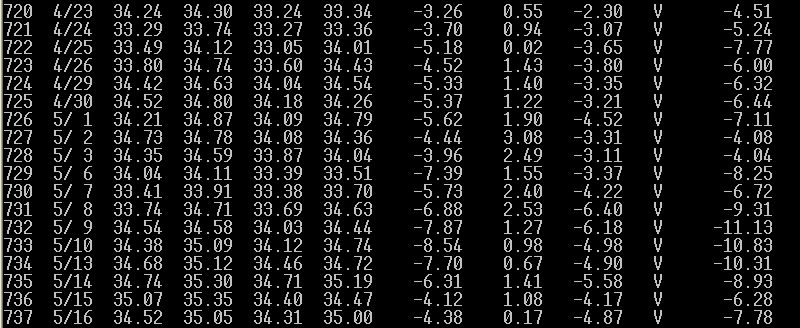
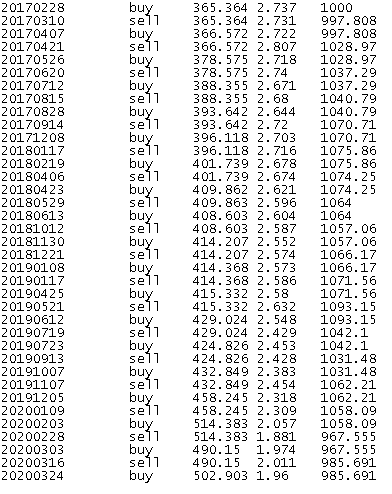
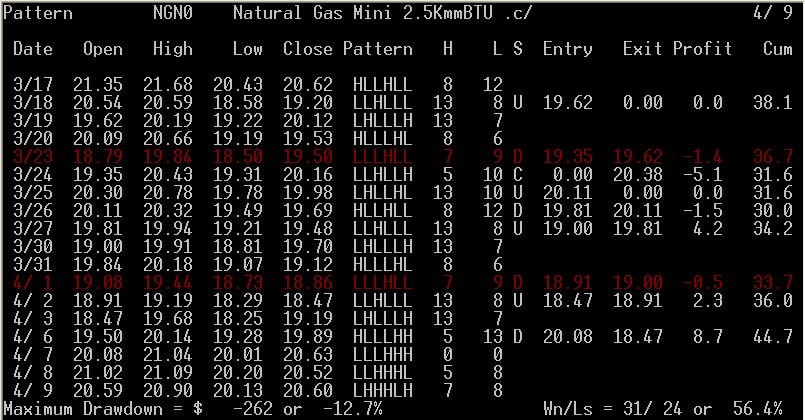
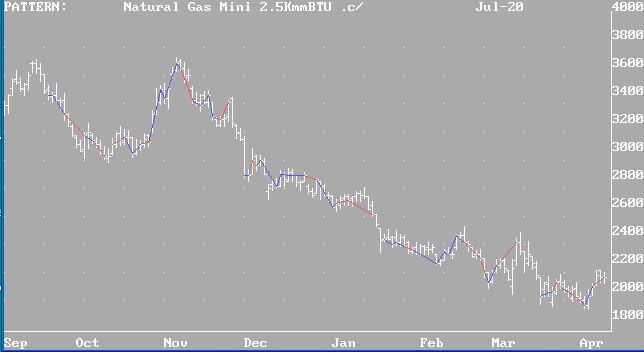
Our best-performing internal program is "Pattern". It is giving a sell signal.
Results of "Pattern" for Natural Gas (blue lines = successful trades, red, unsuccessful):
(Always in the market.)
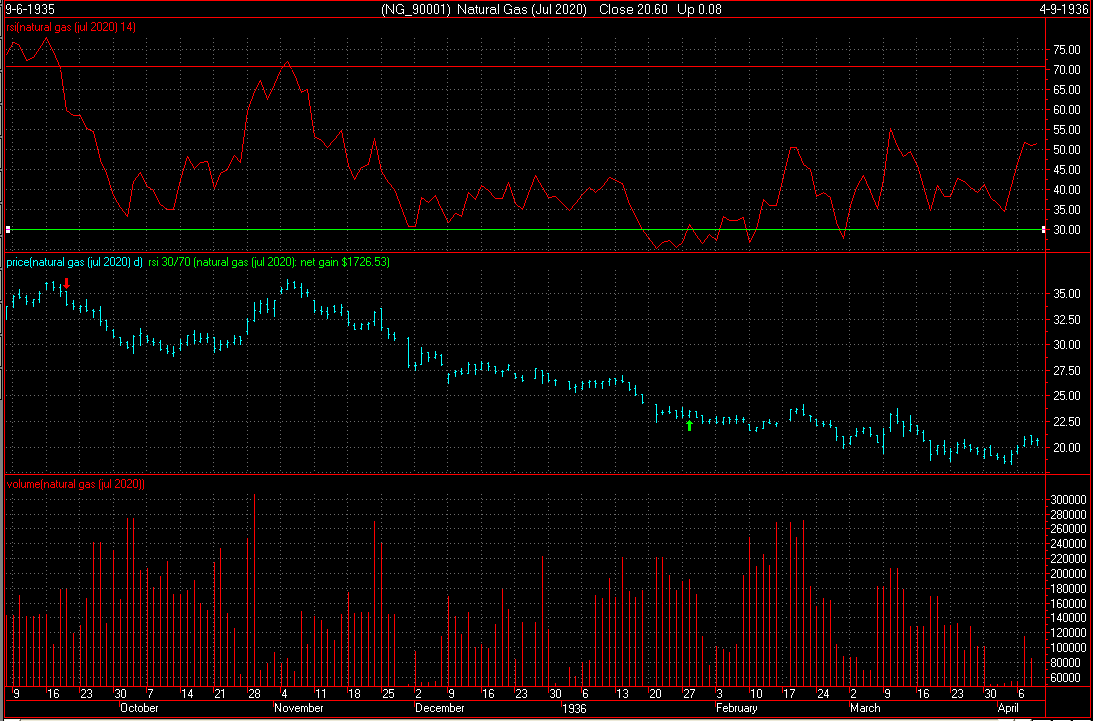
Our third system has triggered a buy signal. (Note, disregard the year on the chart. Our regular readers know this is not a Y2K-compliant system, but it still works.)
The point value is $2,500 for the mini contract. Initial margin on a single contract is $399. Use of options is not advised.
Scale trade buyers are entering the market for the long term in this price range.
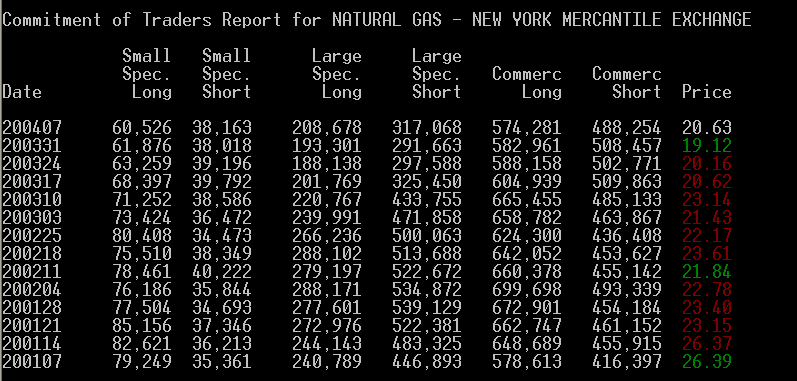
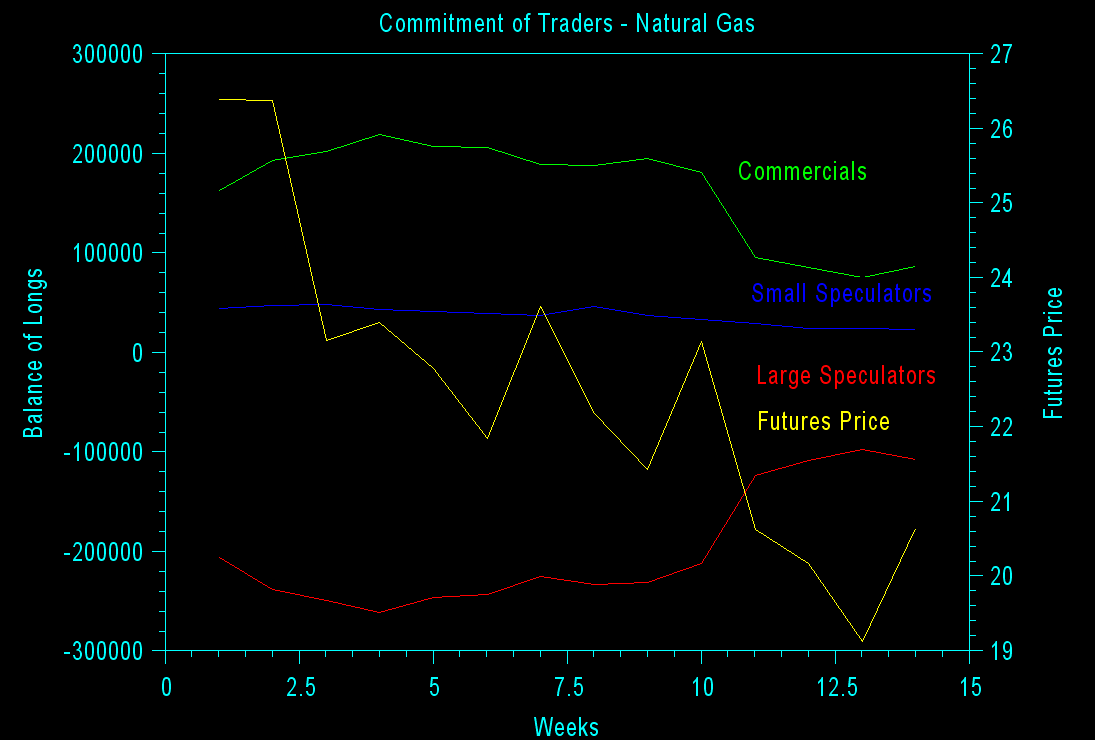
In the chart below, the yellow line is the futures price, read on the right axis. All other colors are read on the left axis. Blue is small speculators. Red is large speculators. Green is commercials. Large speculators with the best track record are getting increasingly-long with the exception of a most recent slight blip downward.
Interpretation of a Different Site Below (Their trader categories may vary from ours):
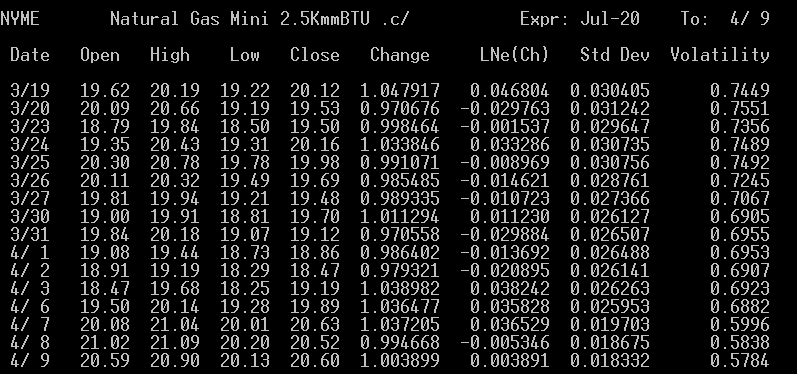
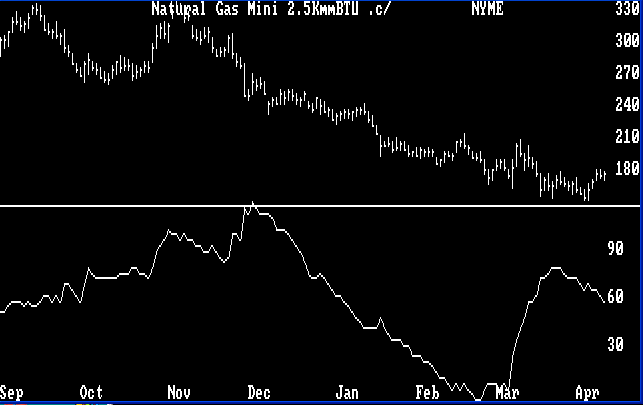
The average volatility shown below suggests that the market is expecting a change in major trend to up from the last volatility low point.
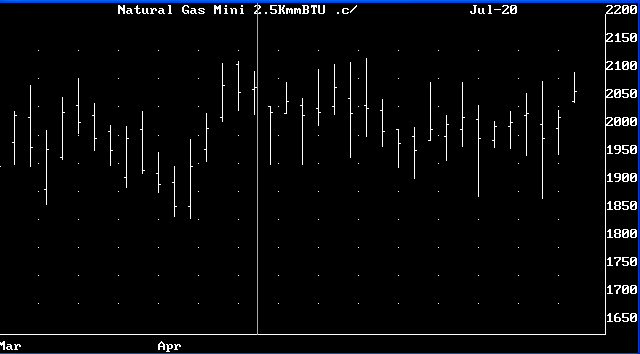
An option trade recommendation may be presented at a later time in this spot.
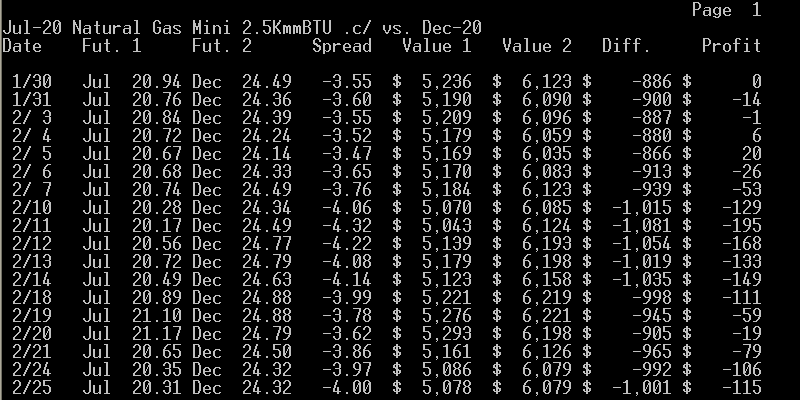
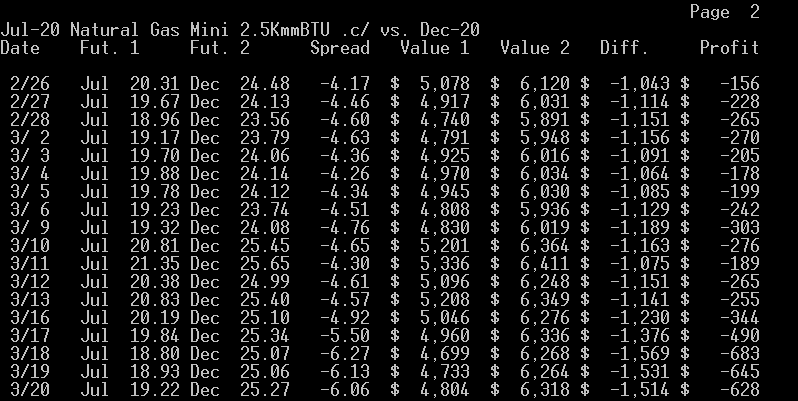
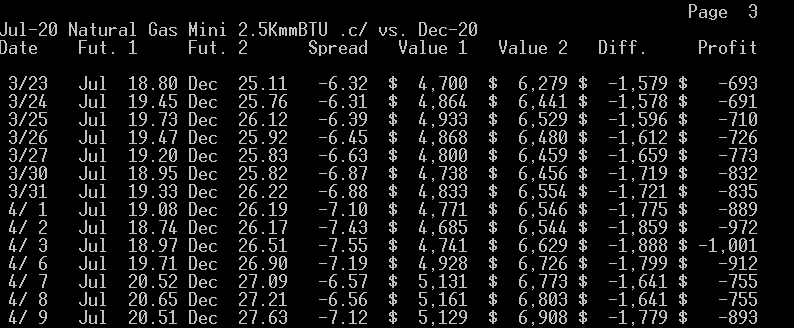
What the Jul. - Dec. calendar spread suggests to us is that buying the near contract and selling the far one is at most times not profitable, which we think is a sign that these futures may go lower in the long run. This disagrees withi our ultimate conclusion. The best time to enter or leave the above spread is when it is at -3.97 or narrower buying the far as prices are rising and then selling the near, and exiting or entering when it is at -7.20 or wider selling the far as prices are falling and then buying the near. At this time, we appear to be near the sell the far, buy the near point.
To view the chart below correctly use Microsoft Internet Explorer.
Here's an intraday chart for a previous day ( 4/09 ).
Internal Program
Third System Confirmation
Margin
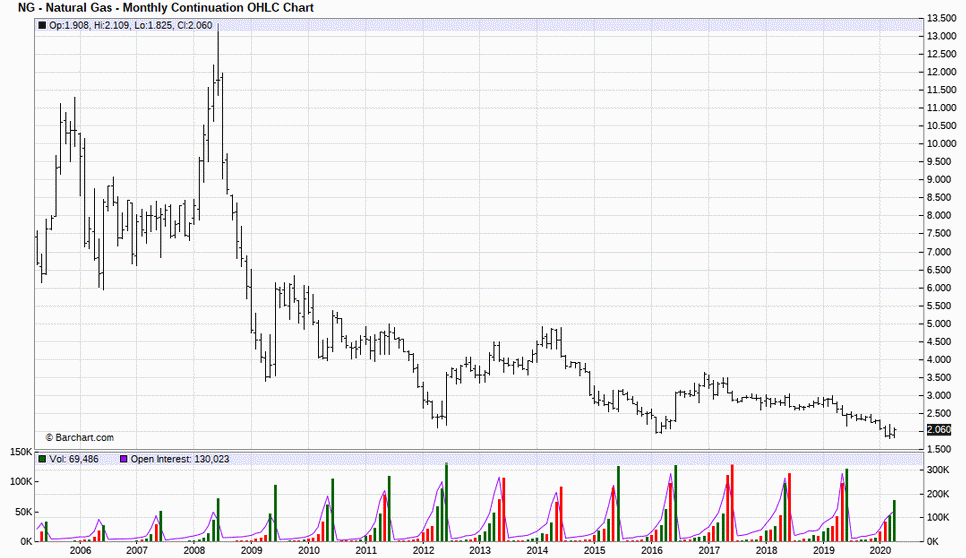
Historic Range
Commitment of Traders

Volatility / Probable Range

Possible Future Prices
Option Recommendation
Calendar Spread
Level Table:
 37.0|                                                                  R  4/ 9
 NYME- Jul-20 Natural Gas Mini 2.5KmmBTU .c/ Cm.=0.01  Lim.= 0.1
     |
     |ALLPPP
     |ACLLMPPPPP
 34.5|AACCCCCCCCLLMMPPP________________________________________________________
     |ABBBBBBBBCCCCCCDLLLLLMMP
     |AAAAABBBBCCDDDDLLLMMMOPPPPQ
     |AAABBCCDDDDLMMMMOPPPPPQQQQ
     |DLLLMMOPPQQQQQ
 32.0|DGGLLLMOOQQQ_____________________________________________________________
     |DDFGGGGLMMOQQQQQQ
     |DDDFFGGGGKLMMNOQQQQQ
     |DDEEEEEEFFGGKMNNNOOOOQR
     |DDEEEEEEFFFGGGHMNNNNNNOOOOOOORR
 29.5|EEFFFFGGGGHHHKKMNNNNNNNNOOOOR____________________________________________
     |EEFFFFFFGGHHHHJKKNNNNNOORR
     |EFFHHHHHJJJJKKKKKNRRRRR
     |EEFHHHHJJJJJKKKKRRRR
     |EHHHJJJJJJKRRRSSSSS
 27.0|HHJJJRRRSSSSSSSST________________________________________________________
     |HRRSSSSTTU
     |RSTTTTTTUU
     |TTTTTTTTUU
     |TUU
 24.5|UU_______________________________________________________________________
     |U
     |UW
     |UUUUUVVWWWY
     |UUUVVVVVWWWXYY
 22.0|UVVVVVVVWWWWWXXYY________________________________________________________
     |VWWWXXYYY
     |WXXXXXXYYYY
     |XXXXXXYYZ[
     |XXXXYYYZZ[[   <<<
 19.5|XXYYYYZZZZ_______________________________________________________________
     |XYYYYYZZZZZZ
     |YYZZZZ
     |YZZ
     |
 17.0|_________________________________________________________________________
     |
     |
     |
     |
 14.5|-A-B-C-D-E-F-G-H-J-K-L-M-N-O-P-Q-R-S-T-U-V-W-X-Y-Z----|----|-- TPO=-0.355
                               1 1 1 1 1 1 1
       4 4 5 5 6 6 7 7 8 8 9 9 0 0 0 1 1 2 2 1 1 2 2 3 3 4           4
       1 2 1 2 1 2 0 2 0 2 0 1 0 1 3 1 2 1 2 1 2 1 2 1 2 0           0
       2 6 0 4 0 4 9 3 6 0 4 8 2 6 0 3 7 2 7 3 8 1 6 1 5 8           9
Other Factors
