![]()
Introduction Nirvana Internal Progrm Historic Range
We fed Lumber, U.S. Dollar Idx, and Eurodollars into a neural network to get the following result:
May Lumber:
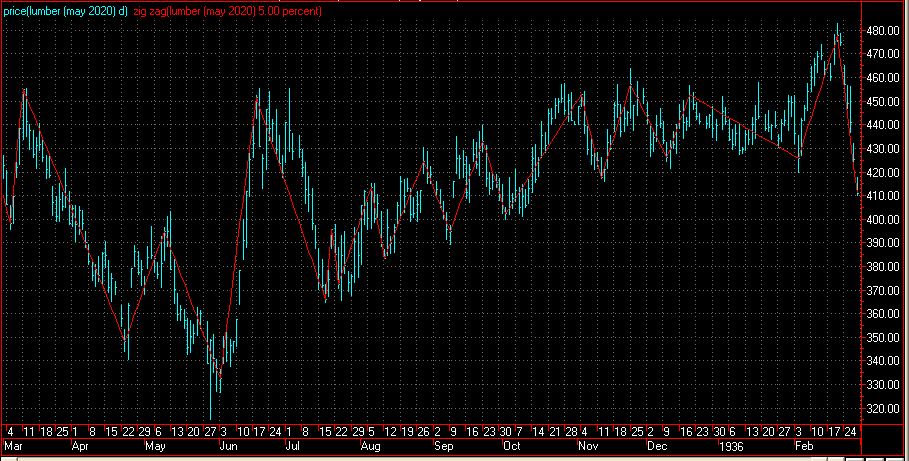
03-04-2020: May Lumber: Recovering from 2019 Supply Disruptions
(Click on links below. Whole page needs to load before links work.)
Intermarket
Parabolic
News
Point & Figure
Cyclic/Seasonal
Third System
Margin
Commitment
Volatility
 >
>

Introduction
A global economic condition does not favor increased use of lumber in many parts of the world. Even though demand in the U.S. is anticipated to be up, lumber use in the rest of the world is suffering from various supply problems and lessening demand with a large inventory of unsold lumber products. We think the news is positive for lumber prices but technical factors seem to outweigh this as markets consider oversupply in spite of supply disruptions in 2019. It's a very mixed bag and hard to predict, but chart patterns and technical factors related thereto suggest the overall market is suspicious of lumber's abilitiy to maintain a current trend toward higher prices. Many 2019 lumber problems are anticipated to dissipate favoring higher lumber prices and these include the U.S.-China tariff war, the U.S.-Canada lumber war, geopolitics including Brexit, a Central European storm and beetle log salvage causing large increases in lumber production and exports, China's environmental protection program causing hundreds of older factories to close, and low U.S. lumber prices causing huge curtailments in production in the now high-cost region of British Columbia.
Intermarket Analysis


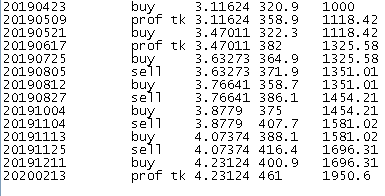
Parabolic Chart
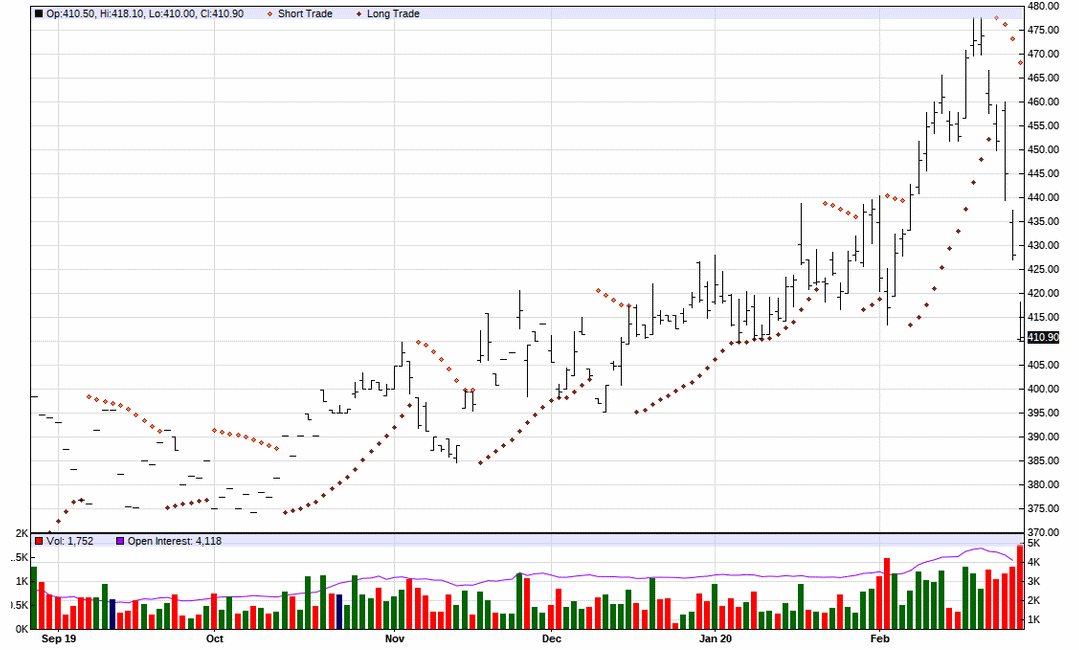
May Lumber:
Nirvana Chart
Softwood lumber production in North America recovered nicely in 2019, but production in Canada dropped sharply by 11%. U.S. sawmill capacity was around 84% in 2019, but in Canada it hit as low as 80% versus 88% the year before. A forestry labor dispute and stoppage was resolved.
Maria Pope became CEO of Portland General Electric in January, 2018. She owned at least 7% of Pope Resources, spun out of Pope and Talbot, a large Washington state lumber company. It was acquired by an REIT, Rayonier, based in Florida, for $554 million. Pope Resources went bankrupt in 2007 after operating since 1853.
R.D. Merill Company oversees 25,000 acres of productive lumber in the U.S. and British Columbia, but it is less that half the timberland it had during its peak. Lumber companies are having to "reinvent" themselves in order to survive.
The Chinese log market has been seriously impacted by a European bark beetle crisis. Also, Russia has suspended timber train shipments to China because of the Coronavirus.
Global wood consumption hit its lowest rate in a decade in 2019. That "rate" was an increase of 0.3%. In 2018 it increased only 1% over 2017. There was a continuous increase in supply and weak demand resulting in inventories in almost all major timber importing countries in 2019 significantly higher than average. Europe and North American except Mexico EACH account for 29% of global timber consumption and China accounts for another 19%. Together, they account for 75% of world consumption. Countries like Japan, Brazil, Australia, and Chile account for much smaller amounts.
The largest shipment of lumber ever to the U.S. from Sweden left on a large vessel recently carrying over 65,000 cubic meters of softward boards on board. In came from the sawmill group Vida AB. Between January and October 2019, Sweden exported a total of 369,000 cu. m. of softward lumber to the U.S., 18% more than the previous year.
President Trump announced the U.S. will join an initiative to plant one trillion trees at the World Economic Forum in Davos, Switzerland. He did not mention climate change but spoke generally about the importance of better managing trees and forests. Some Republicans will introduce legislation focused on planting trees to absorb carbon.
Buildings made of wood can help absorb carbon emissions even as forests do, encouraging use of wood over cement and steel, but the effect is a fraction of what forests absorb..
Continuing efforts by U.S. legislators to apply anti-dumping measures and differential pricing methodology to softwood lumber products from Canada are ongoing. A World Trade Organization panel "affirmed" the practice. However the U.S. intends to cut its duties on softward lumber imports in August of this year. U.S. duties would drop from about $67 per thousand board feet to $30, U.S. That is based upon a pricing level of U.S. futures lumber contract $400. Trump's tariffs have been forcing Canada to idle sawmills. In two years, the British Columbia interior has moved from being one of the lowest cost sources to the highest one. A central European mill is now close to being the lowest-cost supplier to North America. This trend is expected to continue in 2020.
The lumber industry claims that tariffs are not the driving factor in housing unaffordability. Lumber makes up less than 2% of the cost of a new home. This is based on a new home average cost of $377,000 while 16,000 board feet of lumber is required to build that home, at $359 per board foot, amounts to a total cost of $5,744 in building the home.
Strength in U.S. lumber prices in 2019 was due to Canadian mill closures and bad weather. This has been recently compared to a "ramp up" in production from then.
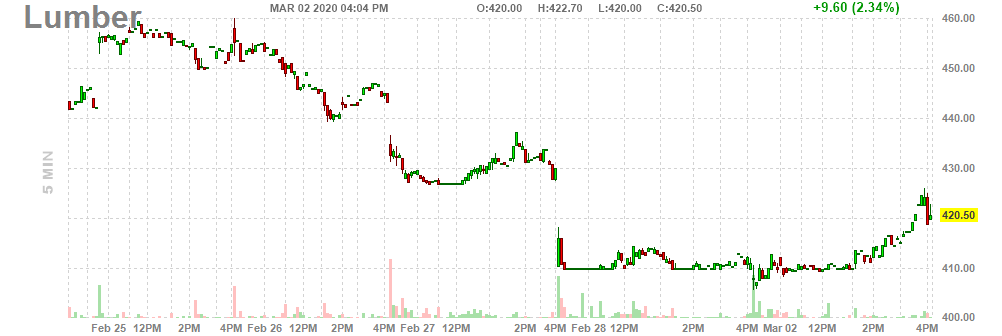
A current price of $420 per 110,000 board feet of 2X4's is in an uptrend. One forecast is looking for $462 within a year. That would be substantially less than prices seen in 2017.
Europe and Japan are projected to have smaller lumber demand due to soft economies and slower housing markets. But global softwood demand is projected in 2020 to show an increase of 2.2 to 2.5% versus 2019. In 2021, one forecaster sees an increase of up to 2.7%.
Global markets including the U.S., Canada, most of Europe, Japan and China were oversupplied with lumber throughout much of 2019, and it will take considerable growth in demand to absorb incremental increase in capacity in 2020. However, with 3 billion board feet of sawmill capacity cuts in the North America, with 2 billion of that in British Columbia alone, the supply chain may not be robust enough to handle demand surges. Therefore, price volatility is expected to creep into the U.S. market.
The effect of climate change, storm and wind damage, and consequent increase in spruce beetle infection in Central Europe may have been under-estimated in global supply trends. U.S. consumption in 2020 is expected to increase by 5%. The economic health of export markets, especially China , has critical impact on prices. But China is expected to match the U.S. demand level increases, therefore we sum up the overall news as positive for increasing lumber prices.
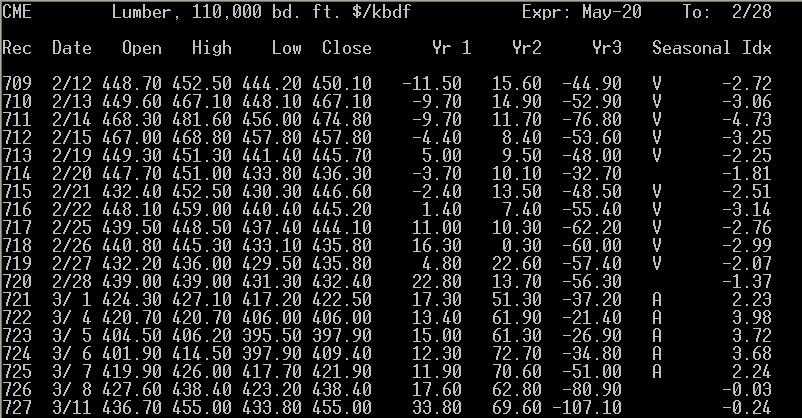
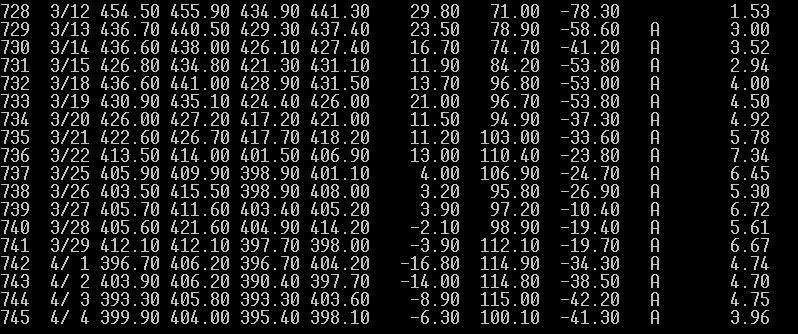
We are headed toward a cyclical high and a seasonal up period.
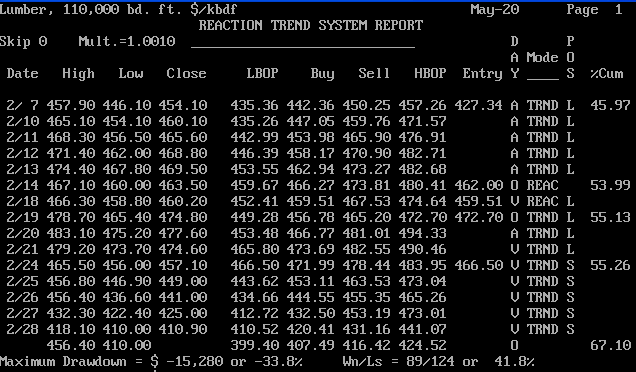
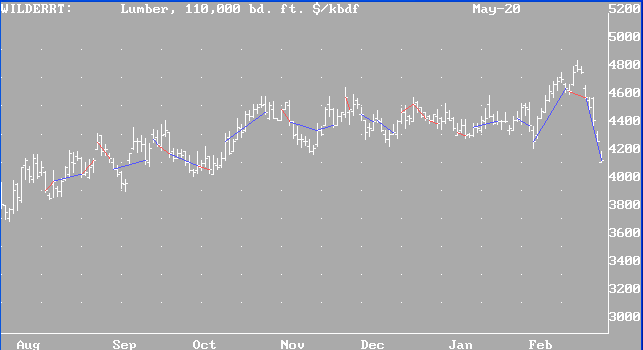
Our best-performing internal program is "WilderRT". It is giving a sell signal.
Results of "WilderRT" for Lumber (blue lines = successful trades, red, unsuccessful):
(Always in the market.)
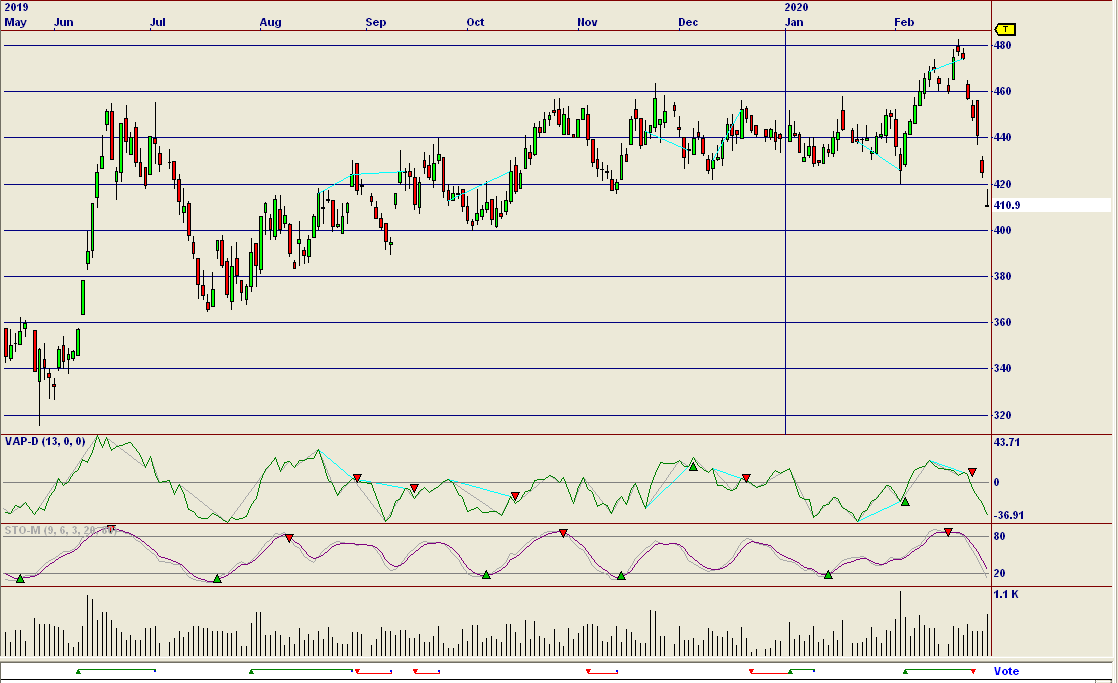
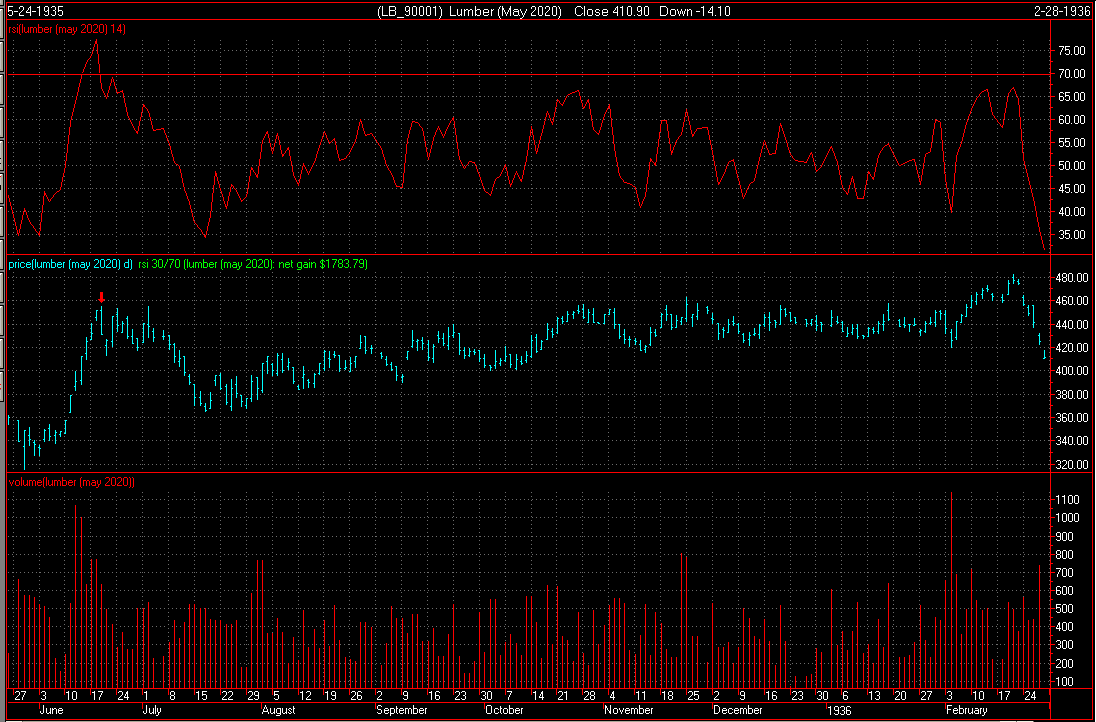
Our third system is working on a long-term sell signal. (Note, disregard the year on the chart. Our regular readers know this is not a Y2K-compliant system, but it still works.)
The point value is $110. Initial margin on a single contract is $3,645. Use of options is advised.
Scale traders are not a factor in this price range.
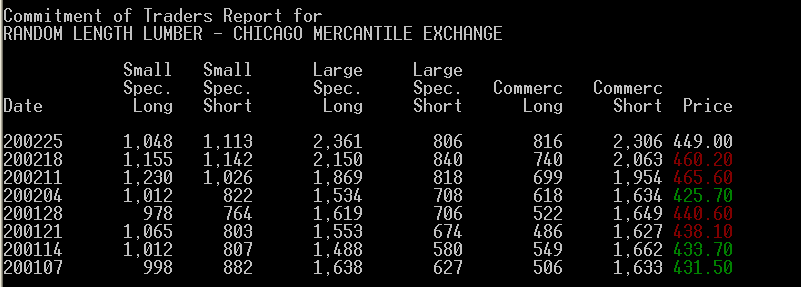
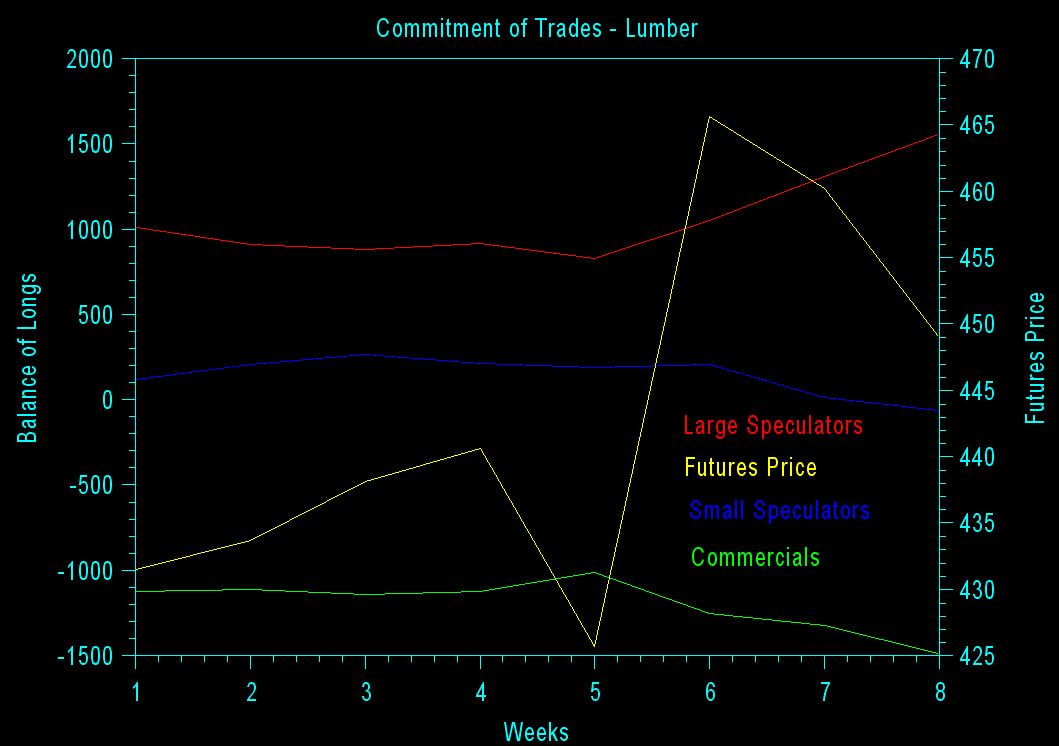
In the chart below, the yellow line is the futures price, read on the right axis. All other colors are read on the left axis. Blue is small speculators. Red is large speculators. Green is commercials. Large speculators with the best track record are getting increasingly-long.
Interpretation of a Different Site Below (Their trader categories may vary from ours):
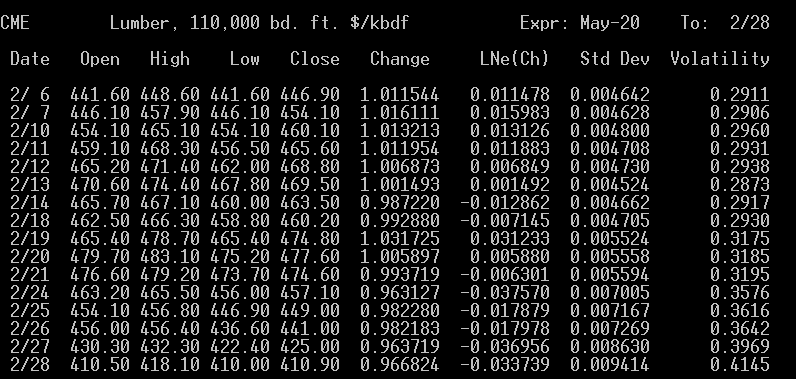
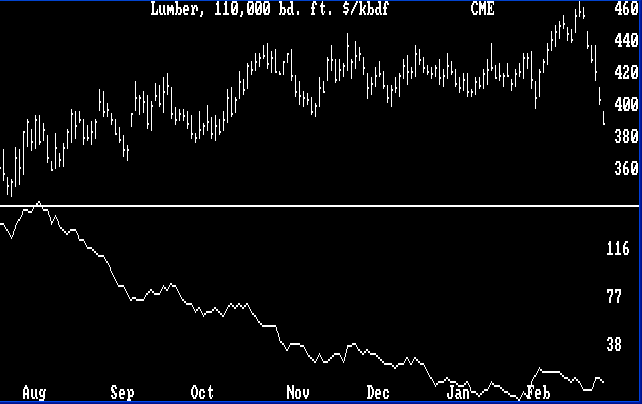
The average volatility shown below suggests that a change in major trend to down is imminent at a volatility low point.
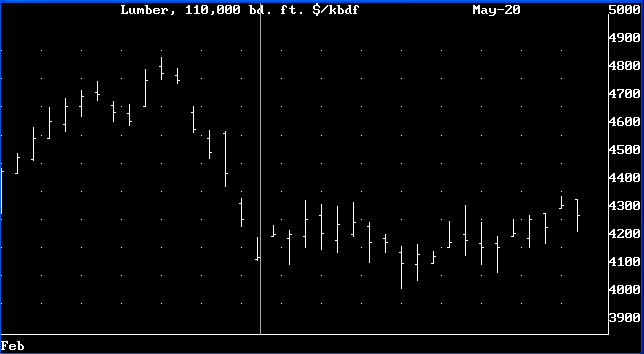
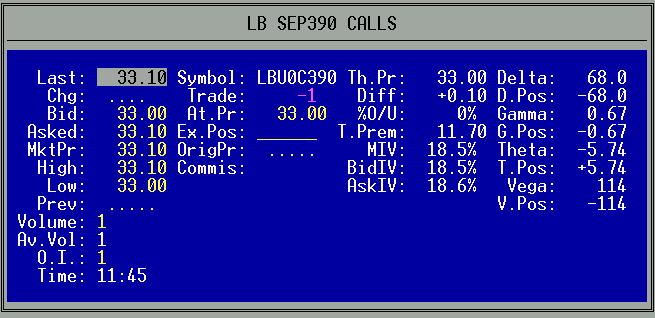
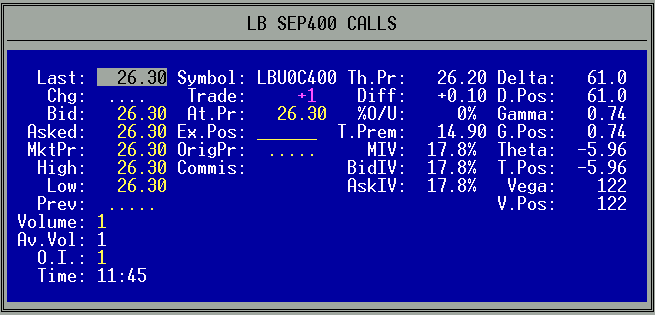
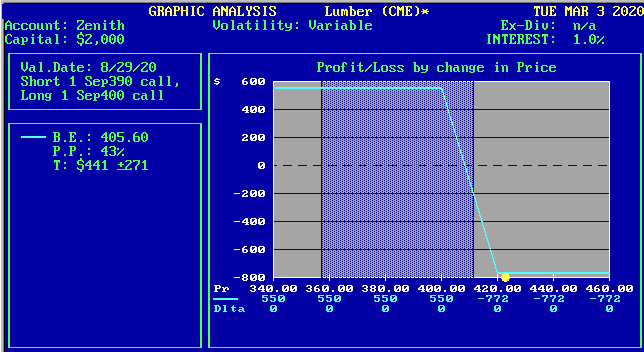
Our option trade recommendation is to buy (1) Lumber September 400 Call and Sell (1) Lumber September 390 Call @ 6.70 to the sell side or better.
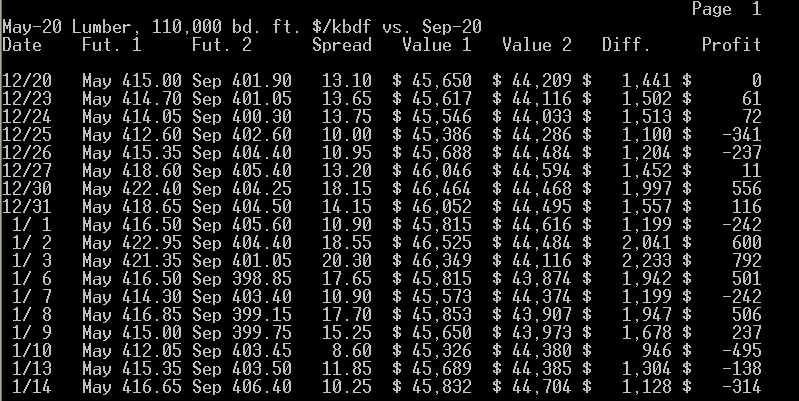
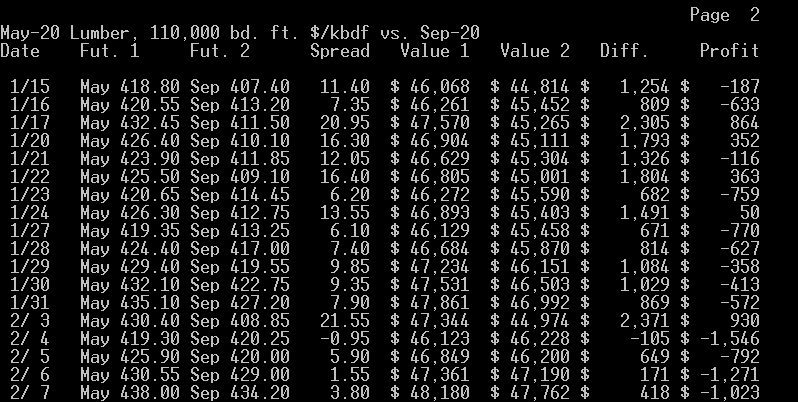
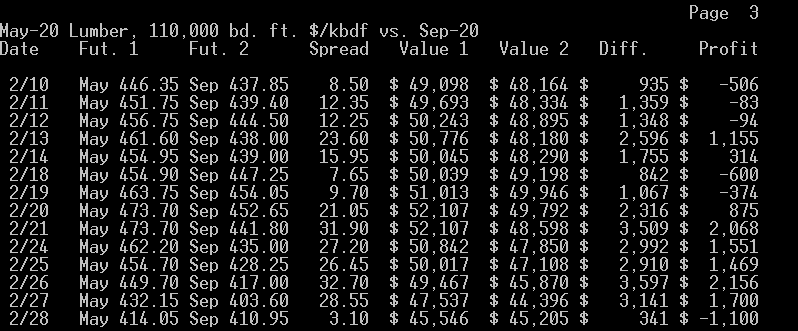
What the May - Sep. calendar spread suggests to us is that buying the near contract and selling the far one is at most times not profitable, which we think is a sign that these futures may go down in the long run. The best time to enter or leave the above spread is when it is at 4.00 or narrower selling the far as prices are falling and then buying the near, and exiting or entering when it is at 20.30 or wider buying the far as prices are rising and then selling the near. At this time, we appear to be at the sell the far, buy the near point.
To view the chart below correctly use Microsoft Internet Explorer.
Here's an intraday chart for a previous day ( 7/11 ).
News Analysis
Point & Figure Chart
640.0|                                                                  T  2/28
     | CME - May-20 Lumber, 110,000 bd. ft. $/kbdf Cm.=0.38  Lim.= 9.5
     |                X
     |                XO
     |                XO
620.0|________________XO_______________________________________________________
     |                XOX
     |                XOXO
     |                XOXO
     |                XO O
580.0|________________X__OX____________________________________________________
     |                X  OXO
     |                X  OXO
     |                X  OXO
     |                X  OXO
540.0|________________X__OXO___________________________________________________
     |                X  OXO
     |                X  O O
     |              X X    O
     |              X X    O
500.0|______________X_X____OX__________________________________________________
     |              X X    OXO
     |              XOX    OXO    X
     |              XO     OXO    XO
     |              X      OXO    XO                  X
460.0|______________X______OXO____XO__________________XO_______________________
     |              X      OXO    XO                X XO
     |            X X      OXO    XOX   X X X     X XOXO
     |            XOX      OXO    XOXO  XOXOXO    XOXOXO
     |            XOX      O O    XOXO  XOXOXO  X XOXOXO
420.0|____________XOX________O____XOXO__XO_O_OX_XOXO_O_O_______________________
     |            XO         OX   XOXO  X    OXOXOX    O
     |            X          OXOX XOXO  X    OXOXO
     |            X          OXOXOXO O  X    OXO
     |            X          OXOXOX  OX X    OX
380.0|____________X__________O_OXOX__OXOX____OX________________________________
     |          X X            OXOX  OXOX    O
     |          XOX            O O   OXOX
     |X       X XOX            O     OXOX
     |X X X   XOXOX            O     O OX
340.0|X_XOXO__XOXOX____________O_______OX______________________________________
     |XOXOXOX XO OX                     X
     |XO OXOXOX  OX                    OX
     |X  O OXOX  OX                    O
     |X    O O   O
300.0|----|----|----|----|----|----|----|----|----|----|----|----|----|----|---
           111     11         1111               11111
      45799012234471233556678800111233455666778990011222
      22103121000212202221211200021102212222000010111002
      03410986697614229191214348285180659048281611729376
The above chart is giving a conventional sell signal.
Cyclical and Seasonal Factors
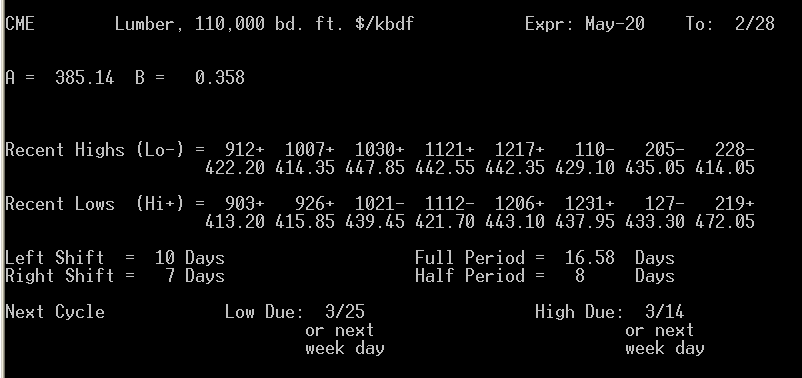
Internal Program
Third System Confirmation
Margin
Historic Range
Commitment of Traders

Volatility / Probable Range

Possible Future Prices
Option Recommendation
Calendar Spread
Level Table:
495.0|                                                                  R  2/28
 CME - May-20 Lumber, 110,000 bd. ft. $/kbdf Cm.=0.38  Lim.= 9.5
     |
     |
     |Z
475.0|ZZ_______________________________________________________________________
     |ZZ
     |ZZZ
     |YZZZ
     |TYYZZZZ
455.0|TYYZZ____________________________________________________________________
     |AAHJRRTTTUVXYYZZ
     |AAHHHJRRRRRRSSTTTUVVWXYYYYZZ
     |AAHHHJRRRRRRSSTTTTTTTUUVVVVVWWWXXYYYYYZZ
     |AAHHHHJJRRRRRSSSTTTTTTTUUUVVVVVVVVWWWXXXXXXYYYYYZ
435.0|AAABHHHHJJJJPRRSSTTTTUUUUVVVVVVWWWWWWXXXXXXXYYYZ_________________________
     |AAAAABBHHHHJJJJJJJOPPRRRSSTTTUUUUUVVWWWWWWWXXXXXXYYY
     |AAABBBHHHJJJJJJOOPPPPQRRSSTTUUUUUVWWWWXYY[
     |AABBBHHHHJJJJJJNNOOOOOPPPQQRSSSTUUUYY[
     |ABBBHHHJJJNNOOOOOPPPQQQSSSSTUY[
415.0|AABBBHHJJJNNOOOOPPPPPQQQQSS______________________________________________
     |ABBHHJKLMMMNNNNOOOPPPPPQQQQ[
     |AABBBBCHHJKKLLMMMNNNNNOOOPPPQQQQQQQ[
     |AABBBBBCHJKKLLLMMMMMNNNNNOOPQQQQQQ   <<<
     |AABBBCCCCCFHKLLLLMMMMMMMNNNNOOPPQQQ
395.0|AABBCCCCCEFHHKLLLLMMMMNNO________________________________________________
     |CCCEEEFHHKKKLLLMMMOO
     |CCEEEEFHHKKKLLLLLMMMMO
     |CDDEEEEFHKKKLLLLLMMMM
     |CCDDDEEEEEEFFHKKKLLLLL
375.0|CCCDDDEEEEEEFFKKKKLLLL___________________________________________________
     |CCCDDDDEEEEFHKKKKLLLL
     |DDDDEEFHKKKKKLLL
     |DFFHKL
     |DDFF
355.0|DDFFFFF__________________________________________________________________
     |DDFFFFFFGG
     |DDFFFFGGGG
     |DDFFGGGGGGGG
     |DFGGGGGG
335.0|GGGGGG___________________________________________________________________
     |GGGG
     |GGG
     |GGG
     |G
315.0|G________________________________________________________________________
     |G
     |
     |
     |
295.0|-A-B-C-D-E-F-G-H-J-K-L-M-N-O-P-Q-R-S-T-U-V-W-X-Y-Z----|----|-- TPO=-0.654
                                     1 1 1 1 1 1 1
       3 3 3 4 4 5 5 6 6 7 7 8 8 9 9 0 0 0 1 1 2 2 1 1 2 2           2
       0 1 2 1 2 1 2 1 2 1 2 0 2 0 1 0 1 3 1 2 1 3 1 2 1 2           2
       4 5 9 2 9 3 8 1 5 0 4 7 1 5 9 3 7 1 4 9 3 0 4 9 2 7           8
Other Factors
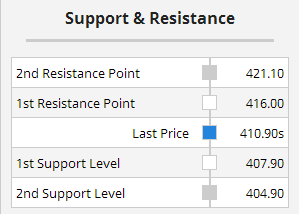
                 Risk Versus Opportunity Report
                ________________________________

                    LBK0    May Lumber

                      High Price:  437.3
                   Current Price:  410.9
                       Low Price:  356.5

                            Risk: -0.133
                     Opportunity: -0.274

                    (O/R) Ratio =  2.061