![]()
Corporate Webpages Atlas Air Worldwide, Inc.
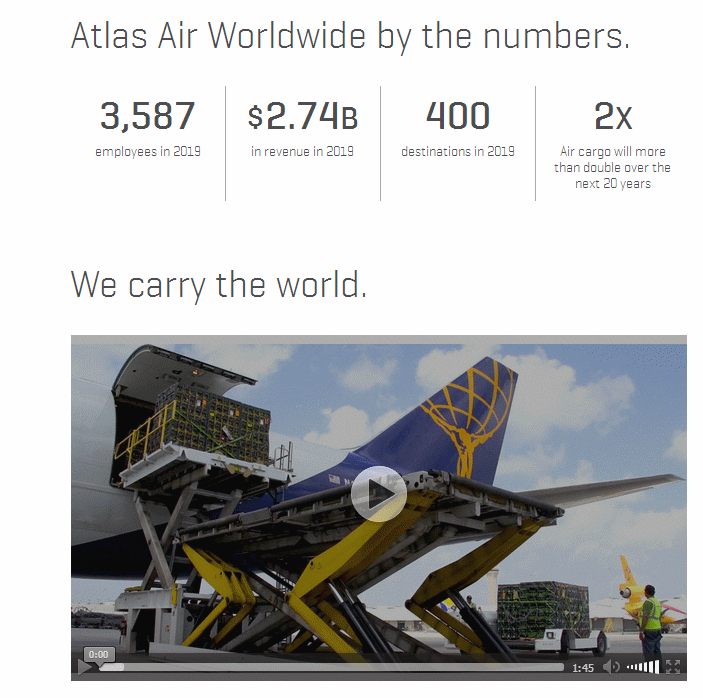
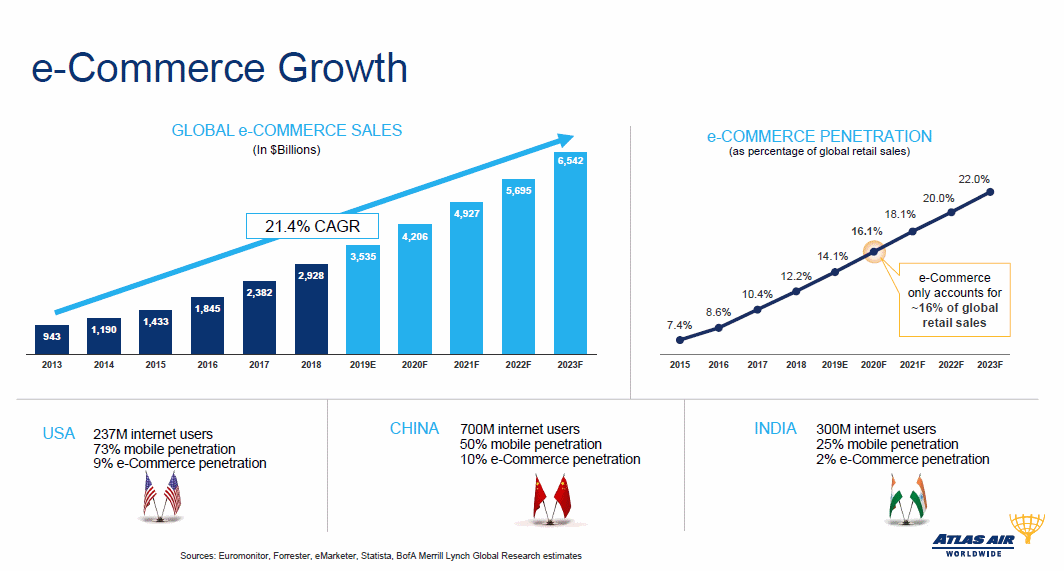
Atlas Air Worldwide Holdings, Inc. (AAWW) is a large air cargo
shipper with a large fleet of aircraft. The pandemic has both
hurt and benefitted parts of the airline industry. Certainly
passenger revenues have declined preciptiously, threatening
bankruptcy for some airlines. But as stores close, more and
more shopping is done on line, and that benefits shippers like AAWW.
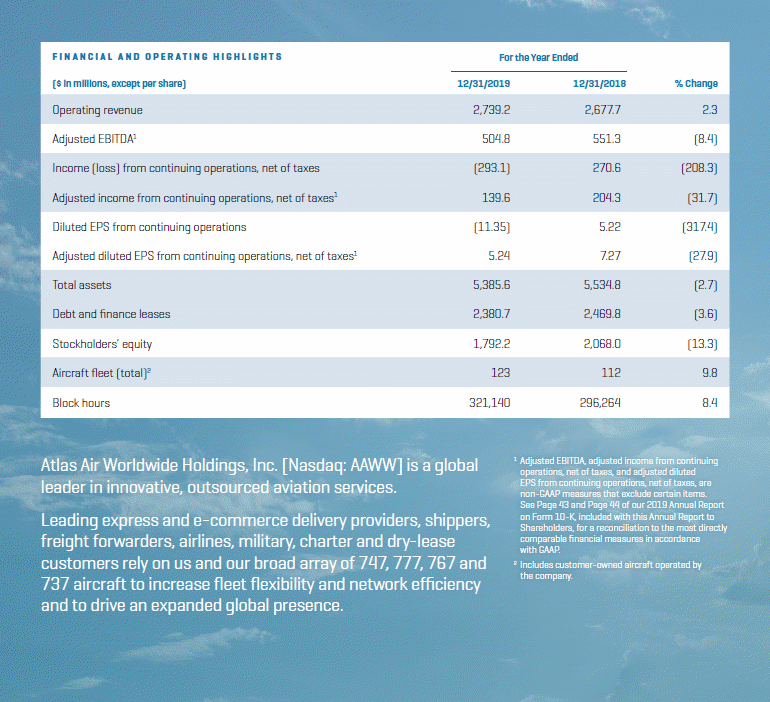
AAWW suffered a massive loss in 2019. It was not due to the
pandemic. It was due to trade tensions and tariffs, reducing
demand for air shipments worldwide, and also due to a writedown
on some older aircraft assets. AAWW appears to have the
capability to bounce back from such disappointing results, but
researchers and analysts are both skeptical and generally negative.
From what we see, AAWW is not exactly in the best financial
position to weather storms. We would question some of the
management judgments, but nonetheless the stock appears to be
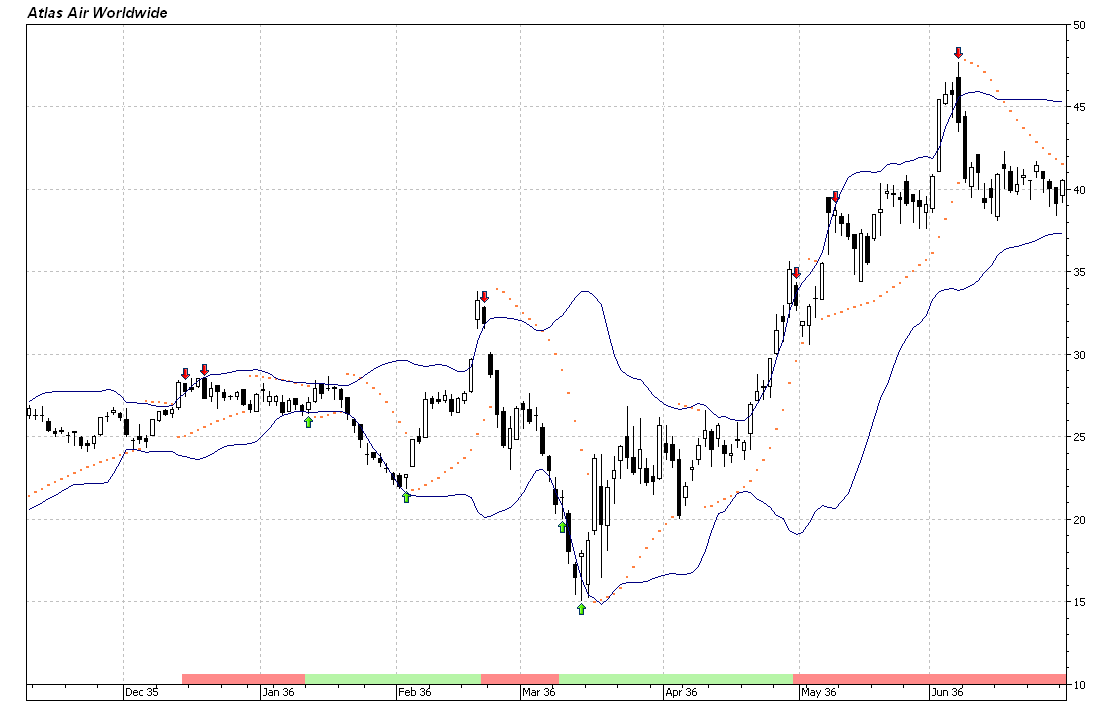
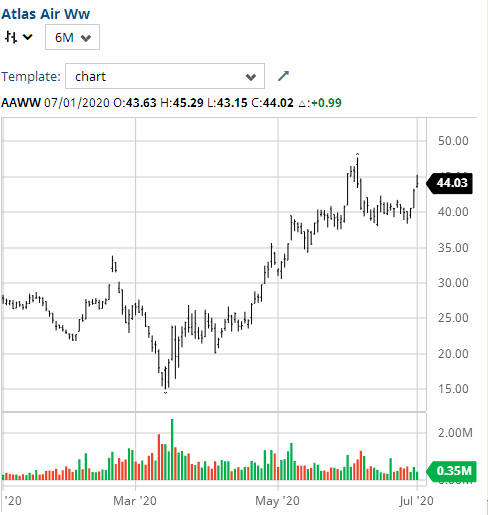
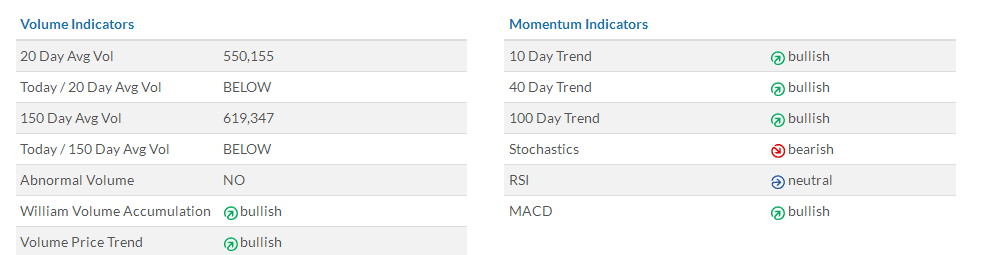
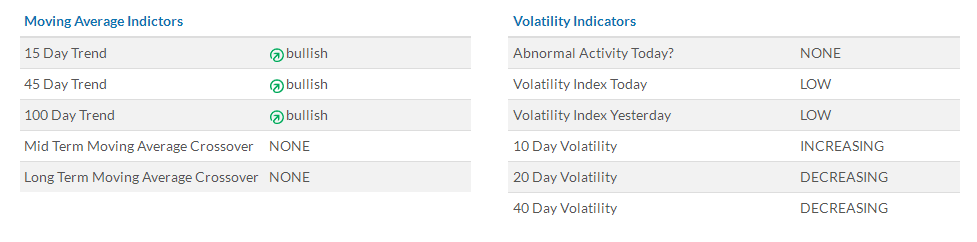
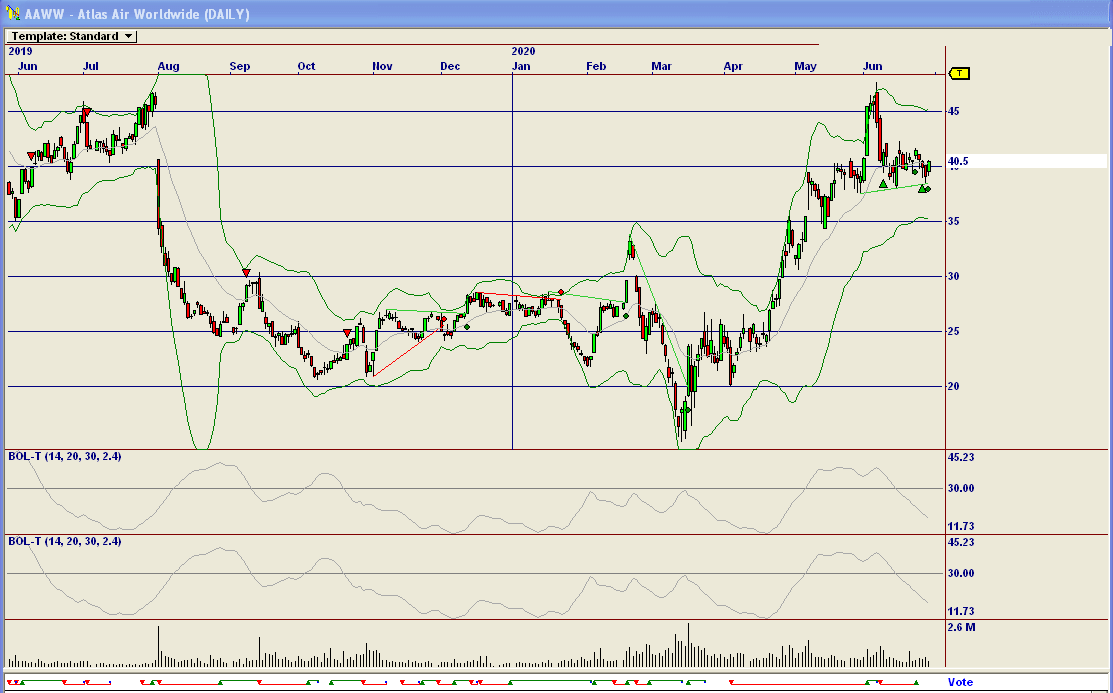
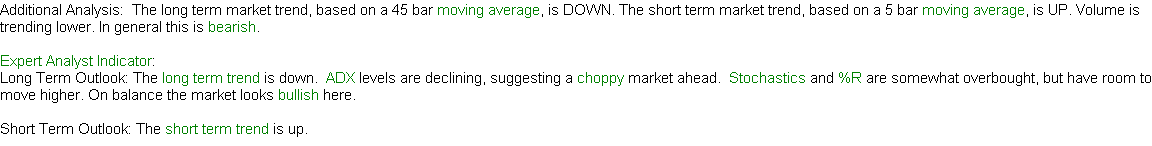
outperforming most of its peers. Chart patterns suggest the
stock reacts well to Bollinger Bands with a capability to bounce
back from any declines once momentum starts to build. An
example of management judgment is an attempt to shift a bit away
from cargo to passenger service and build up that end of the
business, not an auspicious time to be doing that.
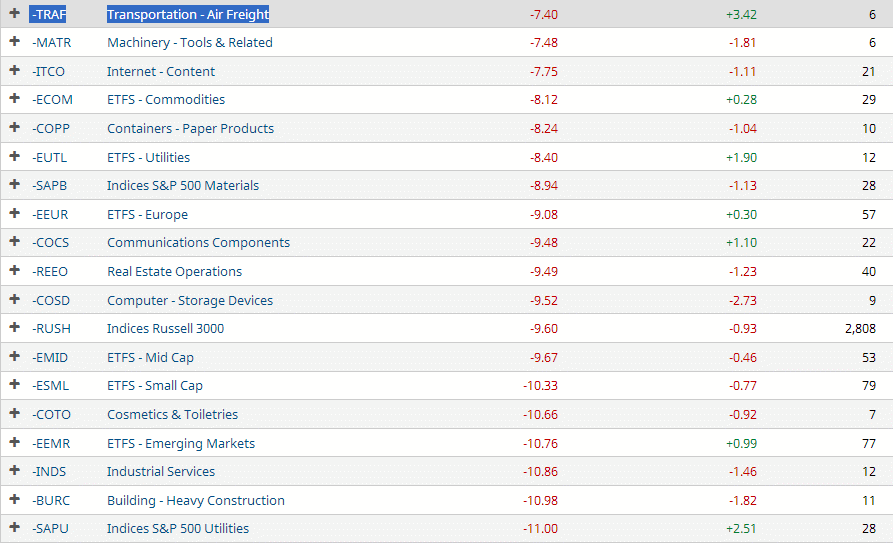
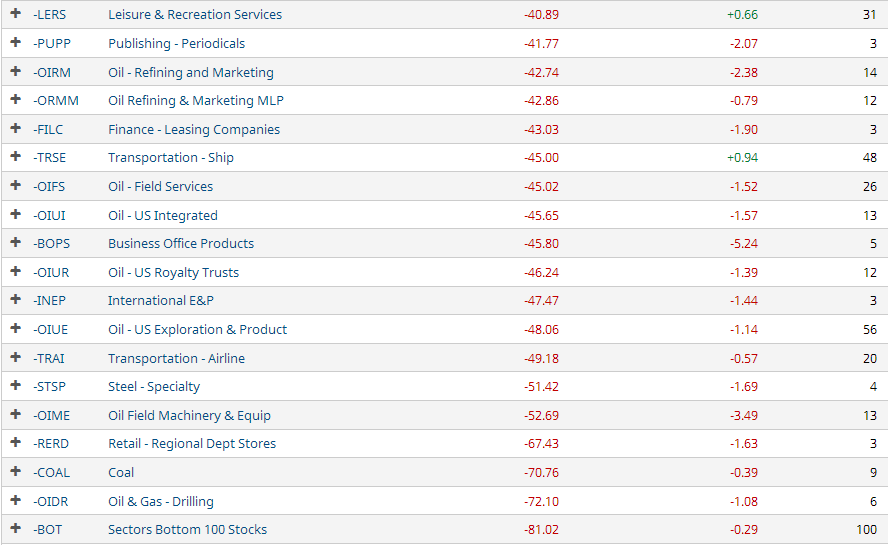
A number of airline stocks have appeared attractive for us to
review because that industry has been particularly hard hit by
the pandemic and has had volatile declines and "overshoots" with
respect to valuation, both good and bad. This affords trading opportunities.
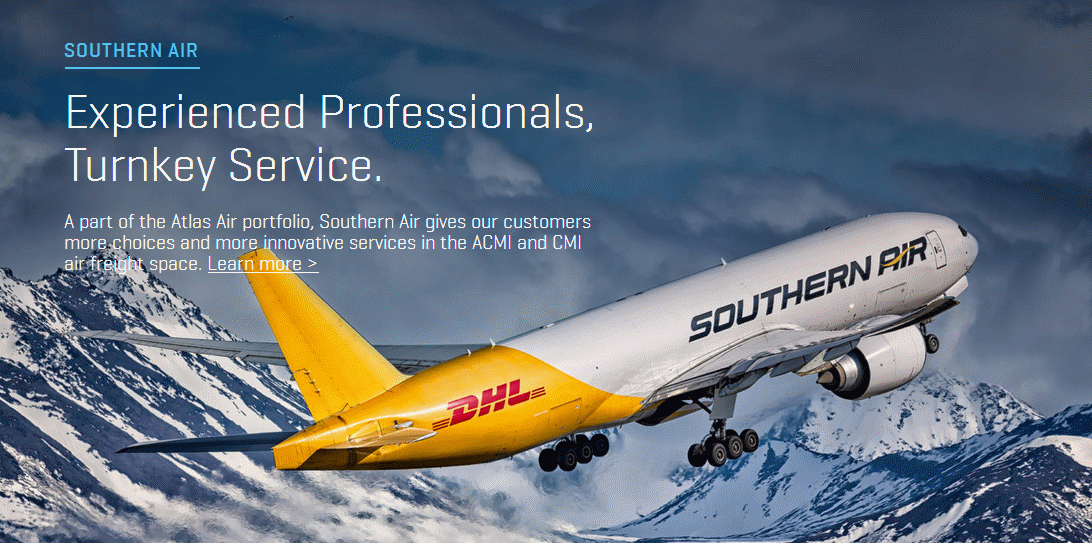
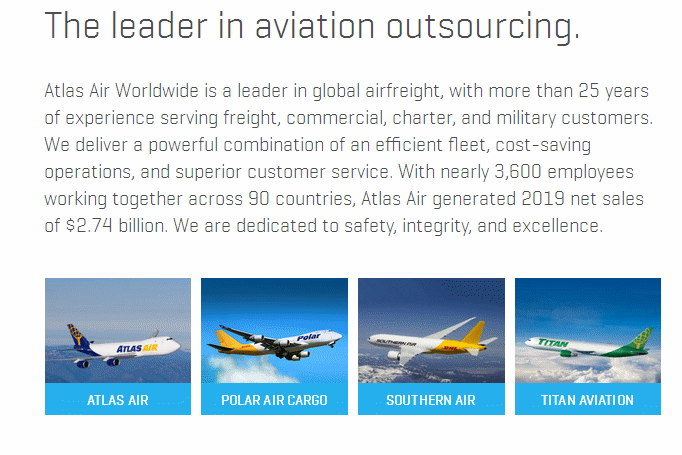
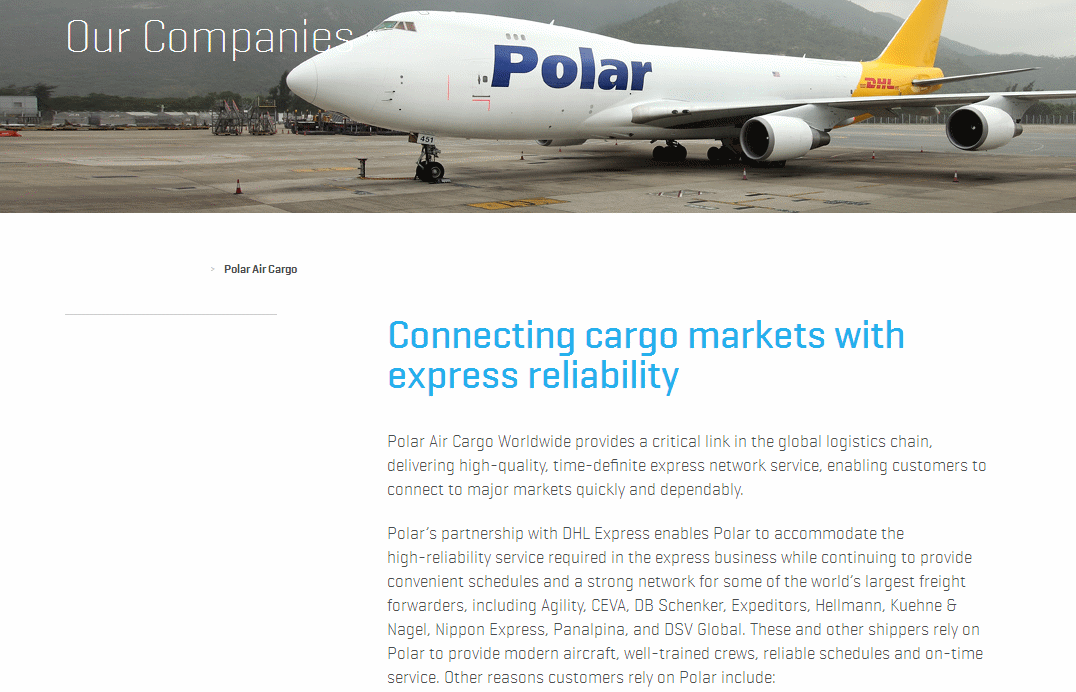
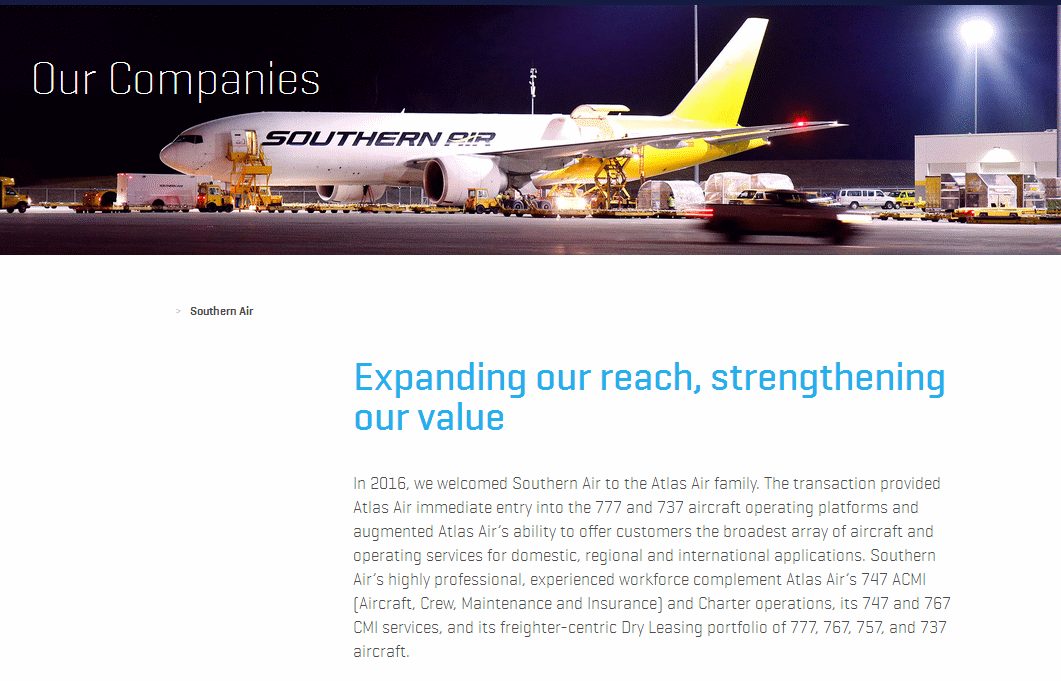
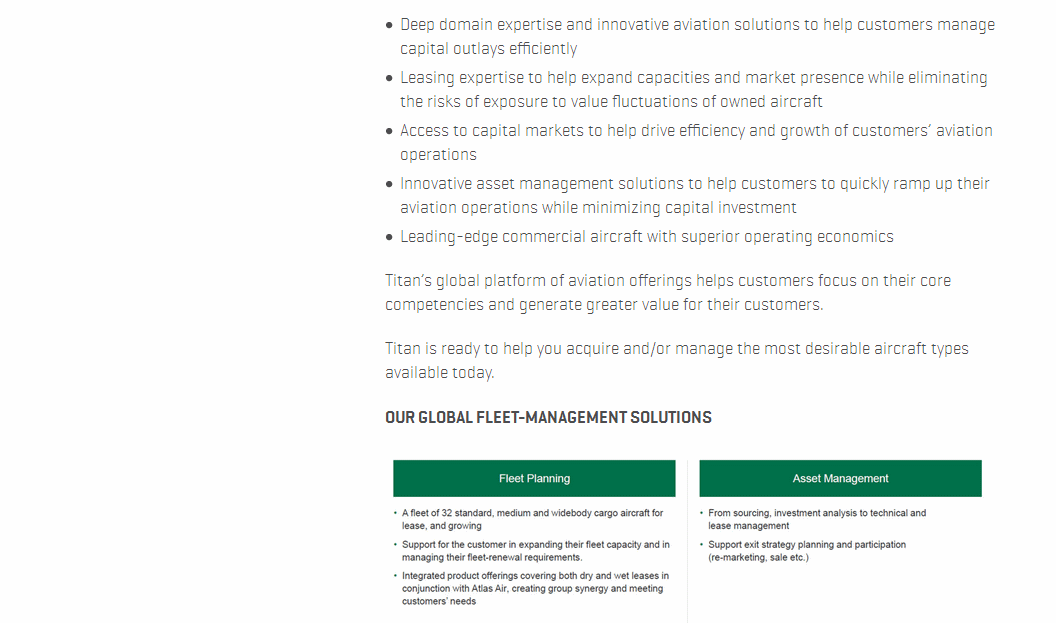
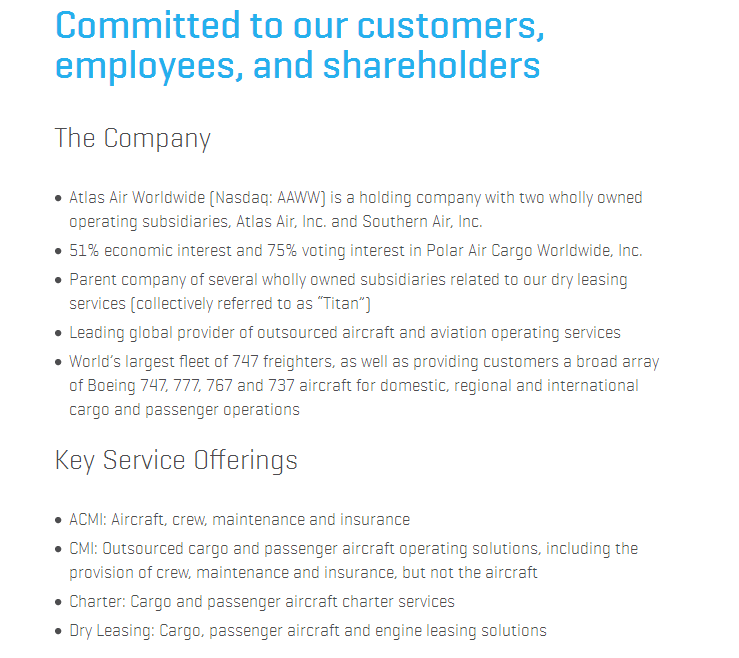
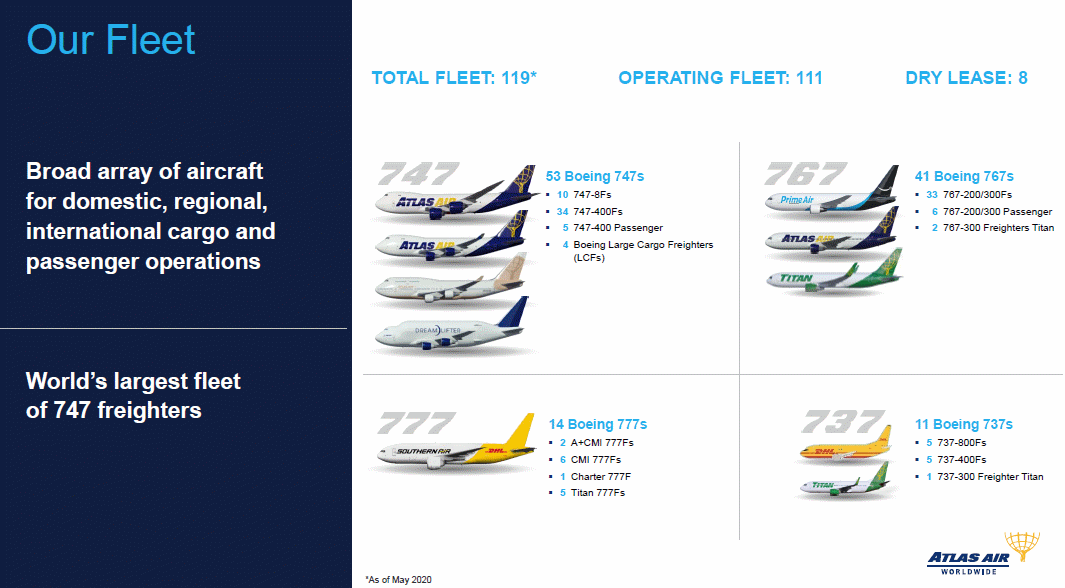
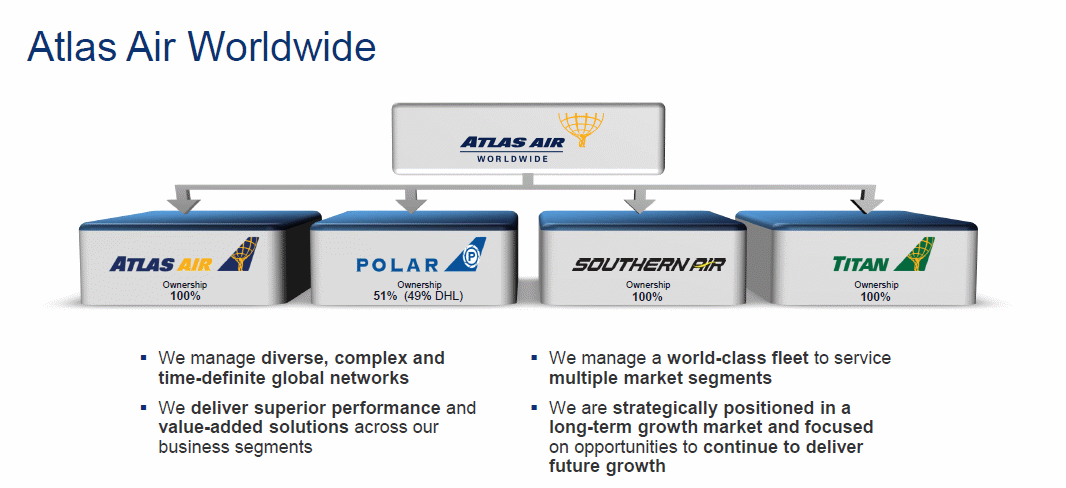
The company operates in four principal segments, shipping in
planes under its own name, as well as subsidiaries Southern and
Polar Air, and also provides maintenance services. It has
demonstrated the capacity to grow.
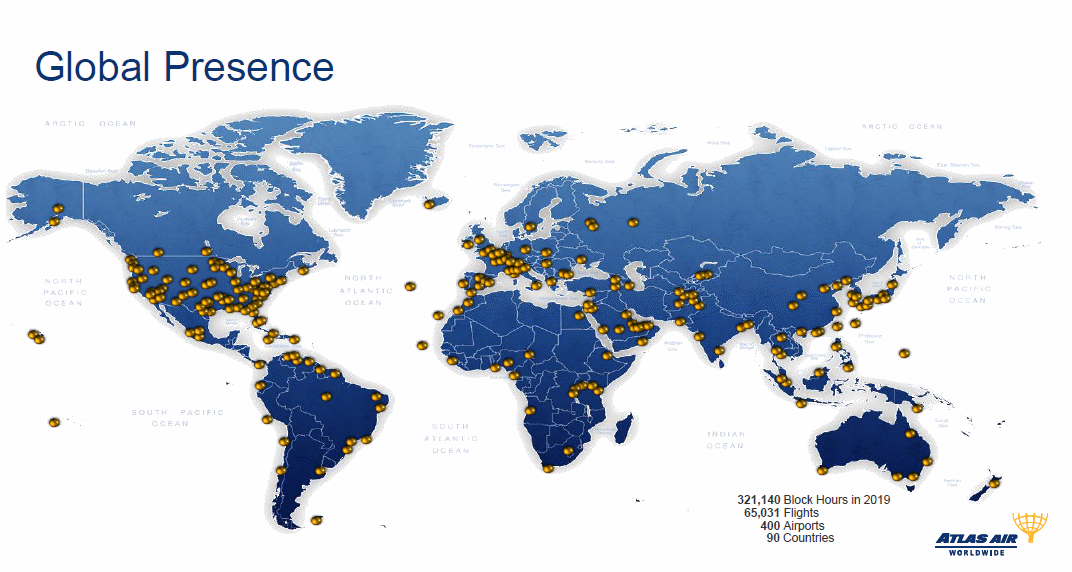
It has a lot of global interdependencies which could cause
unpredictable results, such as investments in Hong Kong which
currently is uncertain as to how it will treat Americans in future.
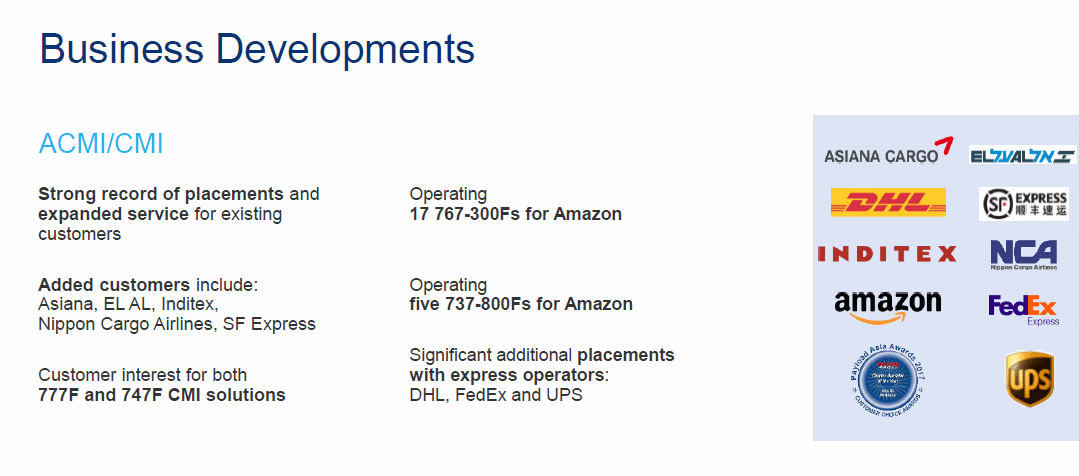
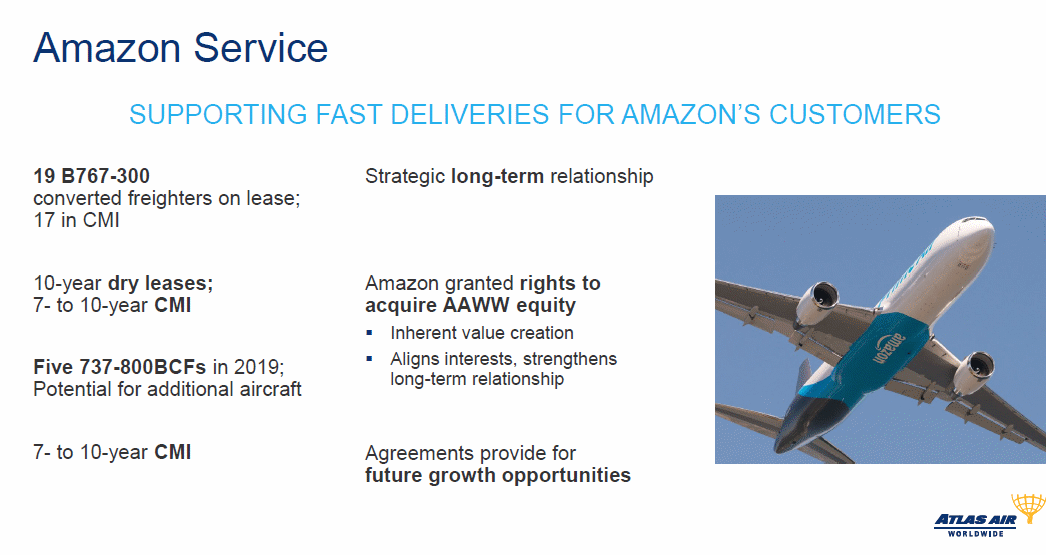
Another factor not to be ignored is presence of mega-customer
Amazon in AAWW's client list, where AAWW is forming its own shipping company
and shifting business away from other carriers.
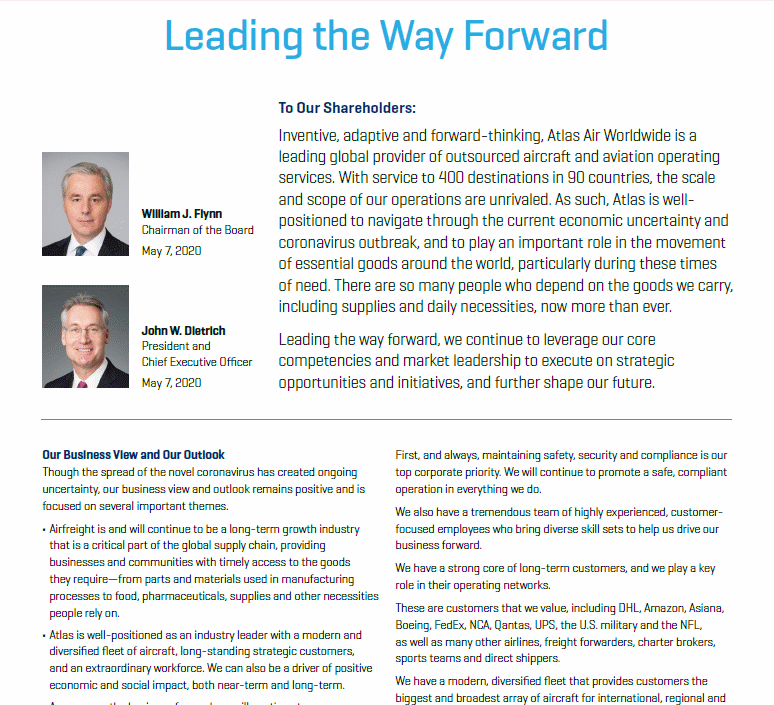
The company has a good website and CEO Letter to Shareholders,
showing some considerable shareholder concern.
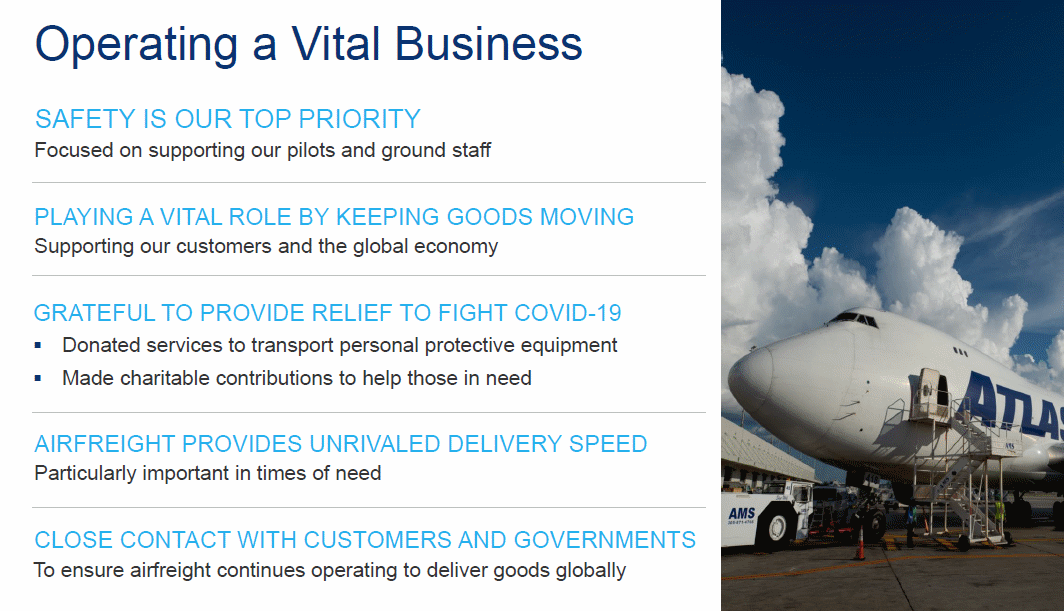
One factor dominating the news has been a series of negotiations with the
Teamsters Union which greatly affects salary negotiations and company
operating conditions, including safety measures.
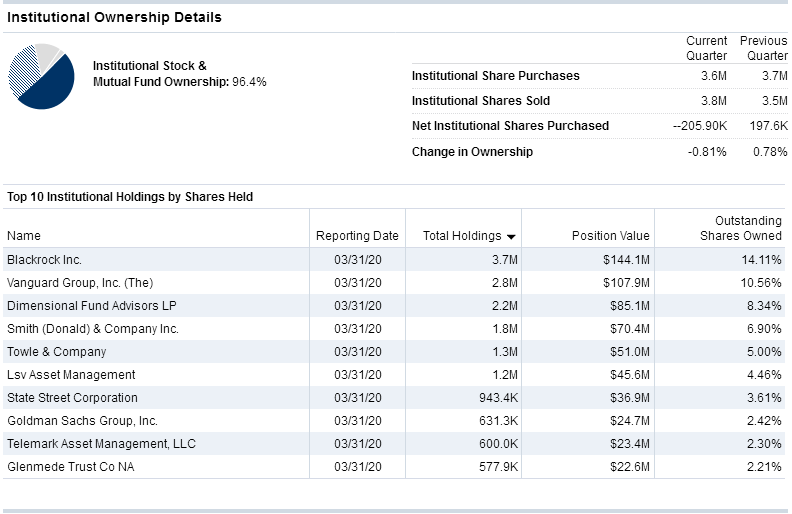
Institutions are net acquirers and Dimension Fund Advisors is
prominent among them which we think is a good sign.
07-05-2020: Atlas Air Worldwide, Inc. (AAWW): Logistics Is Tricky After the Pandemic
(WAIT FOR PAGE TO LOAD COMPLETELY BEFORE LINKS WORK.)
Company Profile
Company History
News
Comparison with Peers
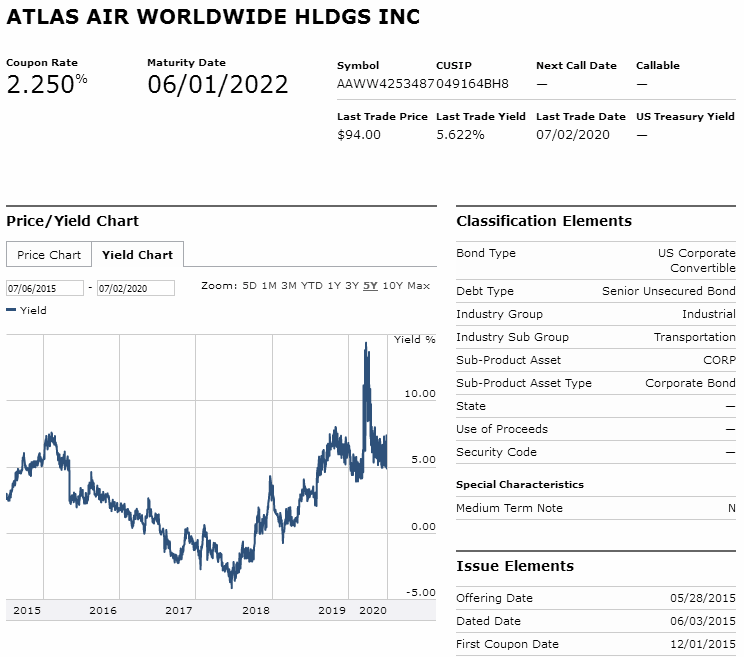
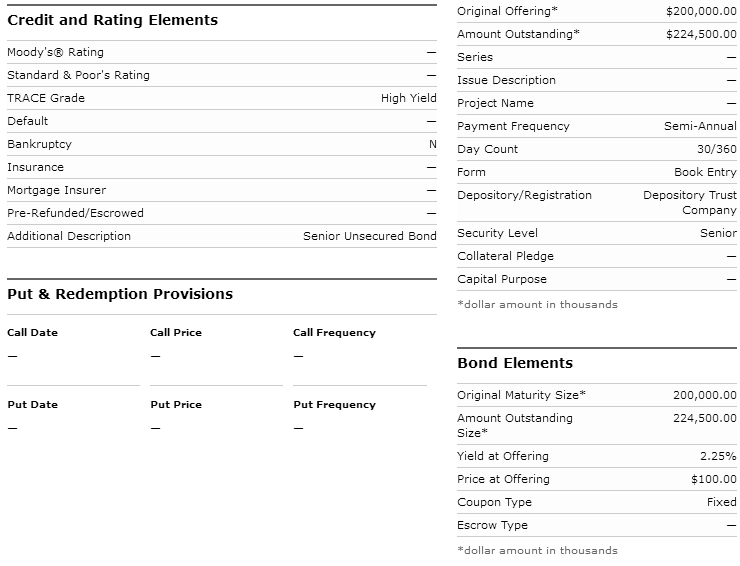
Bond Issue
Zenith Index
Financial Statements
Avg. P/E to Current P/E
Financial Ratios
Intrinsic Value (Disc. CashFlow)
Fair Value Estimator
Projected Earnings
Research Reports
Analysts' Opinions
Insider Activity
Institutional Activity
Sentiment
Short Interest
Standard & Poor's
Management's Discussion
Channel Potential
MACD Histogram
Intraday Chart
Val Idea
Stock Consultant
Point & Figure Chart
Wall Street Analyzer
Marketspace Chart
Time Series Forecast
Neural Network Prediction
Stock Options
Ultimate Trading Systems
Recommendation
Corporate Wepages

Company Profile |

Company History |


News |
Comparison |
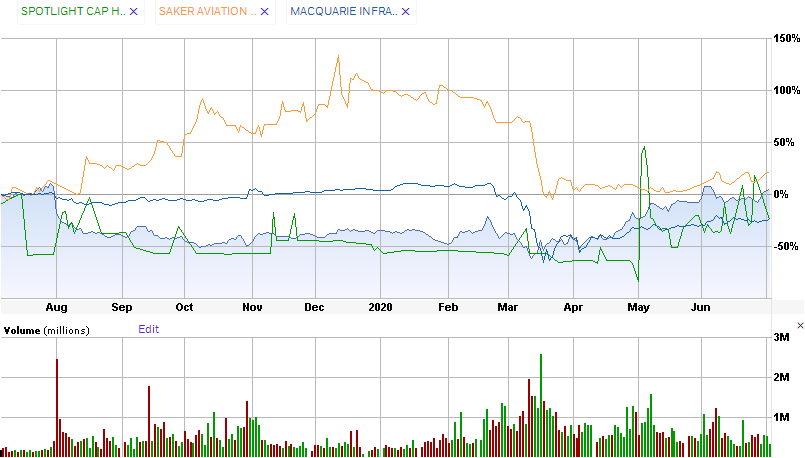
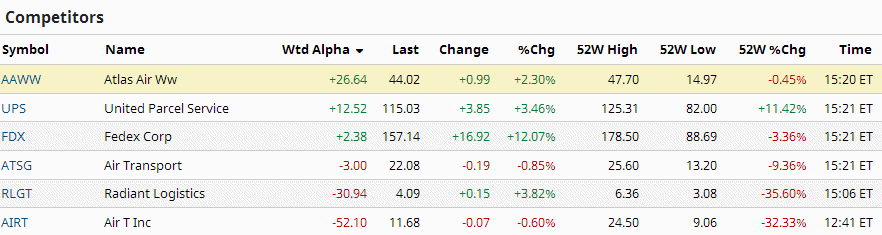
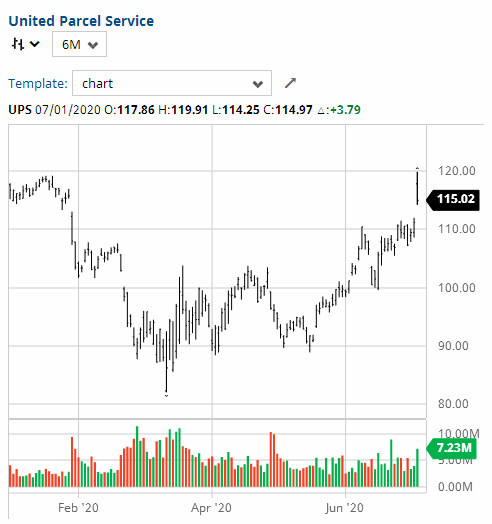
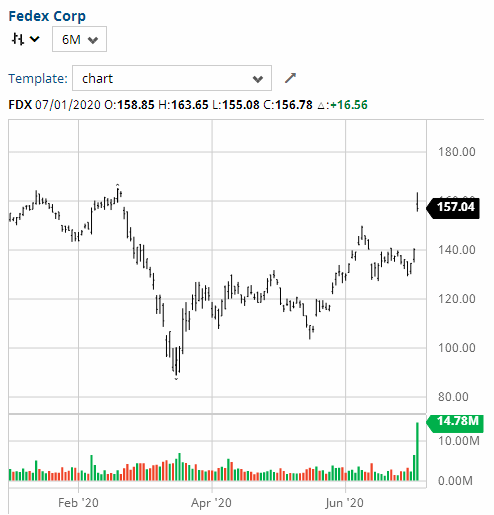
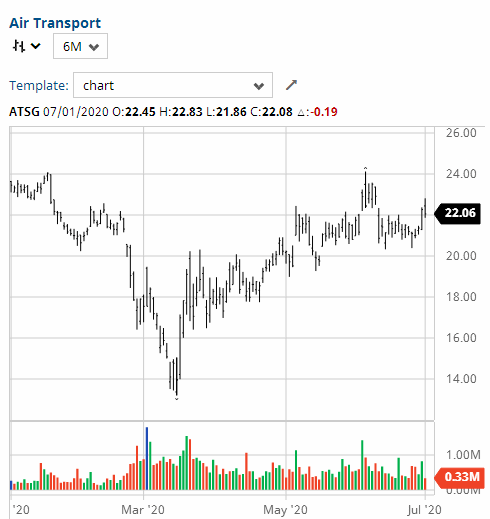
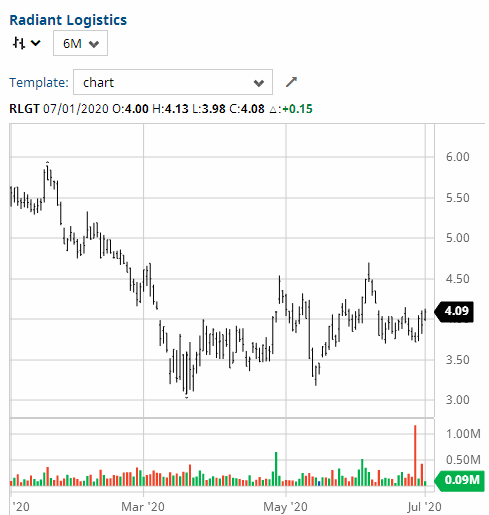
Similar Companies Performance:
Bond Issue |
Zenith Index |
Under current market conditions, a Zenith Index Score of 1.20 or above is required for a positive rating on this factor. 1.21 -1.30 is considered acceptable, 1.30-1.40 is considered strong and
> 1.40 is considered exceptionally strong. Accounting statements in this section often contain mistakes, especially in earlier years' totals, but data is deemed sufficient for us to give a rating. More accurate financial statements follow in the next section. However, we have been relying on Yahoo for data and it is clear Yahoo is completely undependable and run by incompetent programmers who are constatnly buggering up their site, so the zero items represent our inability to access the mess Yahoo made of its site.
Atlas Air Worldwide Holdings, Inc. (AAWW) Exchange: Nasdaq
2000 Westchester Avenue
Purchase, NY 10577 Sector: Industrials
United States Industry: Airports & Air Services
Atlas Air Worldwide Holdings, Inc., through its subsidiaries, provides
outsourced aircraft and aviation operating services. It operates through
three segments: ACMI, Charter, and Dry Leasing. The company offers
outsourced cargo and passenger aircraft operating solutions, includingcontractual service arrangements, such as the provision of aircraft; and
value-added services, including crew, maintenance, and insurance to
aircraft and other customers. It also provides cargo and passenger
aircraft charter services to the U.S. Military Air Mobility Command,
charter brokers, freight forwarders, direct shippers, airlines, sports
teams and fans, and private charter customers; and aircraft and engines
dry leasing services. In addition, the company offers administrative and
management support services, and flight simulator training services. It
also serves express delivery providers, e-commerce retailers, and
airlines. The company has operations in Africa, Asia, Australia, Europe,
the Middle East, North America, and South America. Atlas Air Worldwide
Holdings, Inc. was founded in 1992 and is headquartered in Purchase, New
York.
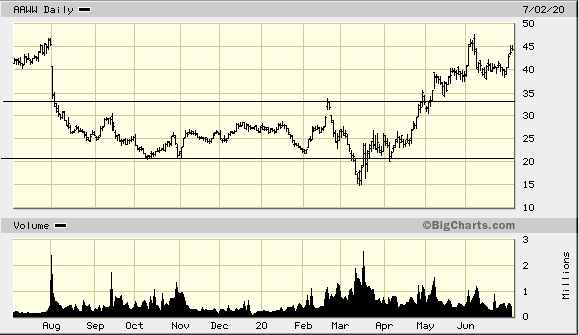
Last Trade: 43.88 52-Week Range: 47.70 - 14.97
Employees: 3,587 Avg.Volume: 649,446 Shares
Corporate Governance:
Pillar scores are Audit: 1; Board: 4; Shareholder Rights: 2; Compensation: 6.
(A lower number means less governance risk.)
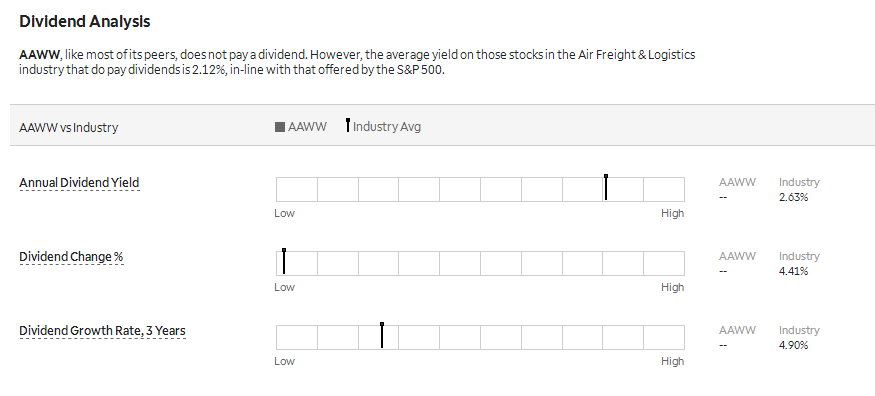
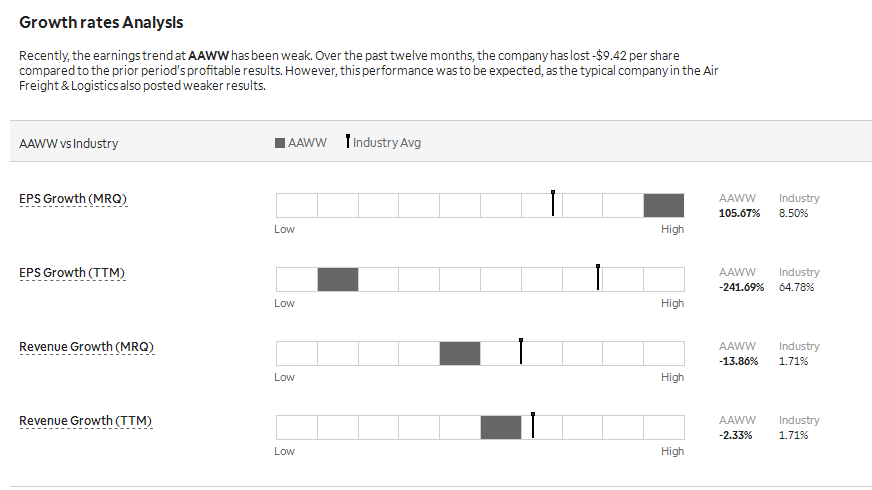
EPS: -9.28 Dividend Amount: $ 0.00 Yield: 0.00%
Ex-Dividend Date: N/A Payout Ratio: 0.00
Key Statistics:
Trailing P/E: 0.00 Target Price: 55.17
Qrtly Stock Price Growth (yoy): 3.69% Beta: 1.68
Qrtly S&P Index Growth (yoy): -5.30% Short Ratio: 4.68%
Qrtly Revenue Growth (yoy): 52.00% Shares Out: 26130000
Qrtly Earnings Growth (yoy): 0.00%
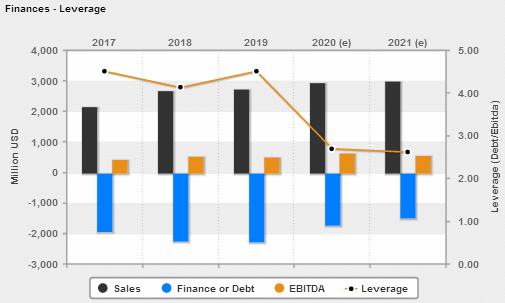
Book Value: 70.15 Debt/Equity: 159.95%
Price/Book Value: 0.58 Operating Profit Margin: 7.12%
Price/Sales: 0.39 Profit Margin: -8.88%
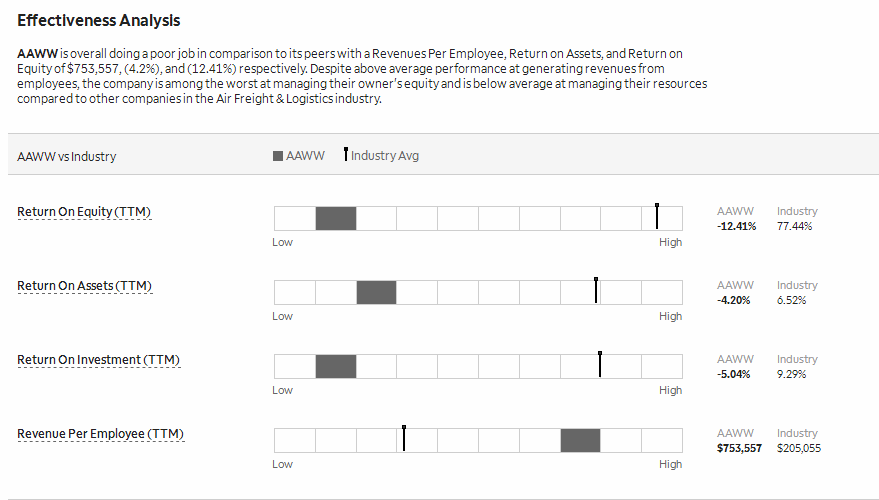
Market Cap: 1,167,000,000 Return on Equity: -12.41%
Enterprise Value: 3,760,000,000 Return on Assets: 2.11%
Operating Cash Flow: 300,344
Free Cash Flow: 300,344
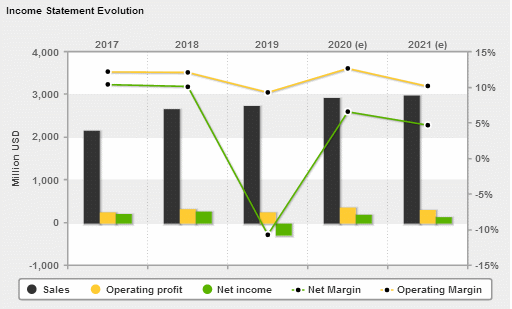
Annual Income Statement: (All numbers in thousands)
Period Ending 12/31/2019 12/31/2018 12/31/2017
Total Revenue 2,739,189 2,677,724 2,156,460
Cost of Revenue 2,147,582 2,020,657 1,596,560
Gross Profit 591,607 657,067 559,900
Operating Expenses:
Research & Development 0 0 0
Selling, General & Administrative 0 0 0
Total Operating Expenses 404,732 362,040 313,342
Operating Income or Loss 186,875 295,027 246,558
Income from Continuing Operations:
Total Other Income/Expenses Net -545,873 122,288 -16,897
Interest Expense -113,760 -107,941 -86,289
Income Before Taxes -472,758 309,374 143,372
Income Tax Expense -179,645 38,727 -80,966
Net Income from Continuing Op.s 0 0 0
Non-recurring Events:
Extraordinary Items 293,113 -270,567 -223,473
Net Income -293,113 270,567 223,473
Net Income Avail to Common Shares -293,113 270,567 223,473
Annual Cash Flow Statement: (All numbers in thousands)
Period Ending 12/31/2019 12/31/2018 12/31/2017
Net Income 0 0 0
Operating Activities:
Depreciation 0 0 0
Changes in Accounts Recv'bls 0 0 0
Changes in Liabilities 0 0 0
Changes in Inventories 0 0 0
Changes in other Oper'g Acts 0 0 0
Total Cash Flow f Operations 300,344 425,580 331,719
Investing Activities:
Capital Exenditures -347,790 -713,816 -546,019
Investments 215,992 606,625 770,568
Other Cash Flows fr Investing -9,370 -10,769 -10,613
Total Cash Flows from Investing 0 0 0
Financing Activities:
Dividends Paid 0 0 0
Sale of Purchase of Stock 0 0 0
Other Cash Flows fr Financing 0 0 -10,613
Total Cash Flows from Financing 0 0 0
Change in Cash & Cash Equiv. -47,446 -288,236 -214,300
Annual Balance Sheets: (All Numbers in Thousands)
Period Ending 12/31/2019 12/31/2018 12/31/2017
Current Assets:
Cash & Cash Equivalents 5,534,792 4,955,462 4,247,379
Short Term Investments 0 0 0
Net Receivables 0 0 0
Inventory 0 0 0
Other Current Assets 0 0 0
Total Current Assets 4,272,969 3,798,842 3,184,001
Long-Term Investments 0 0 0
Property, Plant & Equipt 0 0 0
Goodwill 0 0 0
Intangible Assets 0 0 0
Other Assets 0 0 0
Total Assets 0 0 0
Current Liabilities:
Accounts Payable 0 0 0
Current Portion LT Debt 0 0 0
Other Current Liabilities 0 0 0
Total Current Liabilities 3,466,828 3,165,606 2,730,041
Long Term Debt 0 0 0
Other Liabilities 0 0 0
Total Liabilities 2,469,840 2,226,999 1,851,411
Stockholder Equity:
Common Stock 0 0 0
Retained Earnings 0 0 0
Capital Surplus 0 0 0
Total Stockholder Equity 2,067,964 1,789,856 1,517,338
Atlas Air Worldwide Holdings, Inc. (AAWW) [Indices near +3.0, near zero,
or < zero bear special attention.]
P/E Ratio Tests:
P/E Ratio < 28? 0.0000 P/E Ratio > 5? 0.0000
P/E Ratio Vs Growth Rate: 0.0000 Forward P/E Ratio < 28? 0.0000
Price/Sales Ratio < 2.3? 3.0000 Inventory/Sales < 5%? 1.0000
Sales < $1 Billion? 0.3651 Operating Margin < 7.5%? 1.0534
Balance Sheet Tests:
Debt/Equity < 0.40? 0.2501 Long-Term Debt Service: 3.0000
LTD Being Reduced? 0.0000 Short-Term Debt Service: 0.0000
Current Ratio > 2? 0.6163 Working Capital >= 1.5? 1.2332
Leverage Ratio < 20%? 3.0000 Debt/Assets < 1? 3.0000
Quick Ratio > 1? 3.0000 Inventory Turnover > 1? 1.0000
Share Equity Increase: 2.3350 Market Cap.< 1.5 Billion? 1.2853
Intangibles < 3% Assets? 3.0000
Income Tests:
Profit Margin < 7.5%? -1.1840 EPS Annual Growth > 10%? -0.0923
Dividend Yield > 2.0%? 0.0000 EPS 3-yr Growth > 15? -0.1144
Enterprise Value/Revenue 0.4240 EPS Growth Consistent? 0.0000
Enterprise Value/EBITDA: -3.0000 Collection < 45 days? 1.0000
EPS Qrtly Growth > 10%? 0.0000 Gross Pft/Cur. LTD > 1? 3.0000
Borrowing Int. Rate < 6%? 3.0000
Stock Performance Tests:
Volatility > 25%? 2.7447 % Held by Insiders < 5%? 2.1552
Beta > 1.25? 1.3440 % Held by Institut. < 50? 0.4898
50 Da MA > 200 Da MA? 0.7165 % Held by Institut. > 30? 3.0000
52-Wk Change vs. S&P 500: 0.0710 Short Ratio > 5? 0.9360
Price/Book Value < 3? 3.0000 Short % of Float > 20? 0.7655
Return on Assets > 17%? 0.1241 Average Volume > 100,000? 3.0000
Cash Flow Tests:
Oper. C.F. > Lever'd C.F: 1.0000 Positive Free Cash Flow? 3.0000
Positive Oper. Cash Flow? 3.0000 Price to C.F.Ratio < 14?: 3.0000
Cash Flow / Assets > 10%? 0.0000
AAWW Atlas Air Worldwide Holdings, Inc. Overall Zenith Index: 1.1937
Financial Statements |
ATLAS AIR WORLDWIDE HOLDINGS INC (AAWW) INCOME STATEMENT Fiscal year ends in December. USD in thousand 2015-12 2016-12 2017-12 2018-12 2019-12 TTM Revenue 1,822,659 1,839,627 2,156,460 2,677,724 2,739,189 2,703,008 Cost of revenue 1,343,400 1,368,635 1,596,560 2,020,657 2,147,582 2,108,547 Gross profit 479,259 470,992 559,900 657,067 591,607 594,461 Operating expenses Sales, General and administrative 102,755 127,748 144,699 166,487 189,211 186,573 Restructuring, merger and acquisition 0 22,071 4,509 2,111 4,164 2,158 Other operating expenses 234,073 120,662 164,134 193,442 211,357 213,382 Total operating expenses 336,828 270,481 313,342 362,040 404,732 402,113 Operating income 142,431 200,511 246,558 295,027 186,875 192,348 Interest Expense 95,729 81,337 92,298 114,651 118,056 117,248 Other income (expense) -63,922 -29,758 -10,888 128,998 -541,577 -490,855 Income before taxes -17,220 89,416 143,372 309,374 -472,758 -415,755 Provision for income taxes -24,506 46,791 -80,966 38,727 -179,645 -175,705 Net income from continuing operations 7,286 42,625 224,338 270,647 -293,113 -240,050 Net income from discontinuing ops 0 -1,109 -865 -80 0 0 Net income 7,286 41,516 223,473 270,567 -293,113 -240,050 Net income available to common shareholders 7,286 41,516 223,473 270,567 -293,113 -240,050 Earnings per share Basic 0.29 1.67 8.85 10.60 -11.35 -9.30 Diluted 0.29 1.65 8.64 5.22 -11.35 -9.30 Weighted average shares outstanding Basic 24,833 24,843 25,241 25,542 25,828 25,886 Diluted 25,018 25,120 25,854 28,281 25,828 25,886 ____________________________________________________________________________________________________________________________________________ ATLAS AIR WORLDWIDE HOLDINGS INC (AAWW) BALANCE SHEET Fiscal year ends in December. USD in thousand 2015-12 2016-12 2017-12 2018-12 2019-12 Assets Current assets Cash Short-term investments 5,098 4,313 13,604 15,624 879 Total cash 431,048 128,203 294,413 237,125 103,908 Receivables 164,308 166,486 194,478 269,320 290,119 Prepaid expenses 43,600 49,021 87,640 112,146 228,103 Other current assets 12,981 14,360 11,055 11,240 10,401 Total current assets 651,937 358,070 587,586 629,831 632,531 Non-current assets Property, plant and equipment Gross property, plant and equipment 3,785,413 4,109,628 4,704,350 5,322,589 5,262,242 Accumulated Depreciation -450,217 -568,946 -701,249 -860,354 -977,883 Net property, plant and equipment 3,335,196 3,540,682 4,003,101 4,462,235 4,284,359 Equity and other investments 37,604 27,951 15,371 635 0 Goodwill 0 40,361 40,361 40,361 40,361 Intangible assets 58,483 75,668 66,124 57,328 36,495 Other long-term assets 81,183 204,647 242,919 344,402 391,895 Total non-current assets 3,512,466 3,889,309 4,367,876 4,904,961 4,753,110 Total assets 4,164,403 4,247,379 4,955,462 5,534,792 5,385,641 Liabilities and stockholders' equity Liabilities Current liabilities Short-term debt 161,811 184,748 218,013 264,835 395,781 Capital leases 0 0 0 0 141,973 Accounts payable 93,278 59,543 65,740 87,229 79,683 Accrued liabilities 210,184 228,759 344,820 334,631 345,013 Deferred revenues 12,702 10,298 20,986 26,584 26,357 Other current liabilities 70,252 81,830 89,037 104,454 110,355 Total current liabilities 548,227 565,178 738,596 817,733 1,099,162 Non-current liabilities Long-term debt 1,739,496 1,666,663 2,008,986 2,205,005 1,984,902 Capital leases 0 0 0 0 392,832 Deferred taxes liabilities 286,928 298,165 214,694 256,970 74,040 Other long-term liabilities 135,569 200,035 203,330 187,120 42,526 Total non-current liabilities 2,161,993 2,164,863 2,427,010 2,649,095 2,494,300 Total liabilities 2,710,220 2,730,041 3,165,606 3,466,828 3,593,462 Stockholders' equity Common stock 290 296 301 306 310 Additional paid-in capital 625,244 657,082 715,735 736,035 761,715 Retained earnings 1,006,556 1,048,072 1,271,545 1,539,956 1,246,843 Treasury stock -171,844 -183,119 -193,732 -204,501 -213,871 Accumulated other comprehensive income -6,063 -4,993 -3,993 -3,832 -2,818 Total stockholders' equity 1,454,183 1,517,338 1,789,856 2,067,964 1,792,179 Total liabilities and stockholders' equity 4,164,403 4,247,379 4,955,462 5,534,792 5,385,641 ____________________________________________________________________________________________________________________________________________ ATLAS AIR WORLDWIDE HOLDINGS INC (AAWW) Statement of CASH FLOW Fiscal year ends in December. USD in thousand 2015-12 2016-12 2017-12 2018-12 2019-12 TTM Cash Flows From Operating Activities Net income 7,286 41,516 223,473 270,567 -293,113 -240,050 Depreciation & amortization 147,604 168,721 197,463 265,553 316,821 312,185 Amortization of debt discount/premium and is -4,651 -1,277 -1,172 -888 -244 -119 Deferred income taxes -25,898 47,381 -81,330 42,580 -180,553 -177,952 Stock based compensation 16,181 32,724 22,319 20,305 25,189 23,428 Change in working capital 144,577 -70,540 -42,007 -58,809 -137,174 -113,920 Accounts receivable 2,016 22,974 -33,201 -74,038 -22,524 -15,695 Prepaid expenses 23,171 -29,455 -67,341 -57,081 -66,843 -30,010 Other working capital 119,390 -64,059 58,535 72,310 -47,807 -68,215 Other non-cash items 87,788 13,657 12,973 -113,728 569,418 514,850 Net cash provided by operating activities 372,887 232,182 331,719 425,580 300,344 318,422 Cash Flows From Investing Activities Investments in property, plant, and equipmen -227,048 -316,993 -458,464 -599,401 -214,236 -182,904 Property, plant, and equipment reductions 25,441 0 0 0 10,300 54,410 Acquisitions, net 0 -105,392 0 -1,050 -2,028 0 Sales/Maturities of investments 80,302 11,714 4,462 13,604 15,624 11,544 Other investing activities -43,740 -46,717 -87,555 -114,415 -95,421 -113,289 Net cash used for investing activities -165,045 -457,388 -541,557 -701,262 -285,761 -230,239 Cash Flows From Financing Activities Debt issued 568,033 103,492 770,568 606,625 215,992 435,269 Debt repayment -604,977 -179,153 -357,093 -385,015 -344,674 -447,411 Common stock repurchased -26,522 -11,275 -10,613 -10,769 -9,370 -4,015 Other financing activities -17,027 11,461 -39,410 5,718 4,158 -911 Net cash provided by (used for) financing -80,493 -75,475 363,452 216,559 -133,894 -17,068 Net change in cash 127,349 -300,681 153,614 -59,123 -119,311 71,115 Cash at beginning of period 298,601 438,931 138,250 291,864 232,741 164,504 Cash at end of period 425,950 138,250 291,864 232,741 113,430 235,619 Free Cash Flow Operating cash flow 372,887 232,182 331,719 425,580 300,344 318,422 Capital expenditure -272,088 -363,710 -546,019 -713,816 -347,790 -294,165 Free cash flow 100,799 -131,528 -214,300 -288,236 -47,446 24,257 ____________________________________________________________________________________________________________________________________________
Average to Current P/E Ratios |
              (AAWW)     Atlas Air Worldwide Holdings

                               2015    2016    2017    2018    2019

          Annual Earnings:     0.29    1.65    8.64    5.21  -11.35
Average Price During Year:    45.74   40.86   56.47   62.09   39.04

                P/E Ratio:   157.72   24.76    6.54   11.92    3.44

 Average 5-Year P/E Ratio  =  40.87
             Current Price =  40.5

Previous 5 Quarter Earnings:  -1.15    1.61    2.32  -15.86    0.90

          Current Annualized (Last Four Quarters) Earnings = -12.64
                                                           ________
                                 Average PE / Current PE =   -12.76
                                                           --------

                                      ...a number above 1.00 is good
                                                1.00 or below is bad
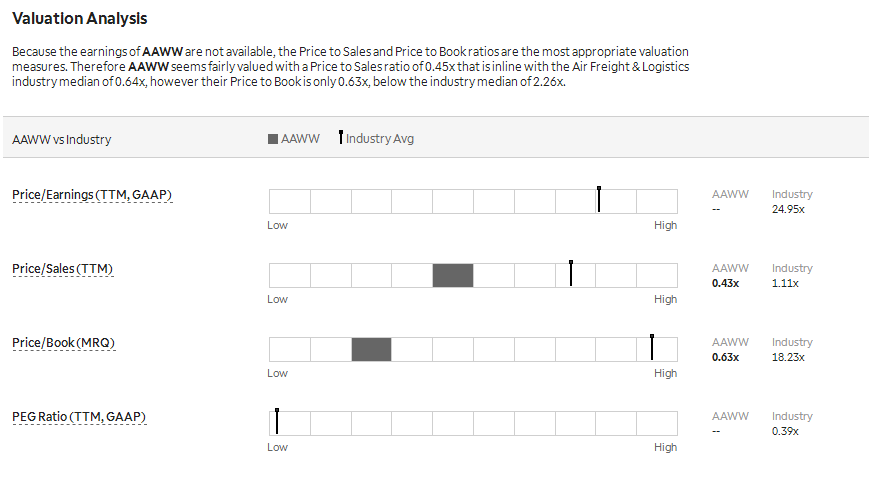
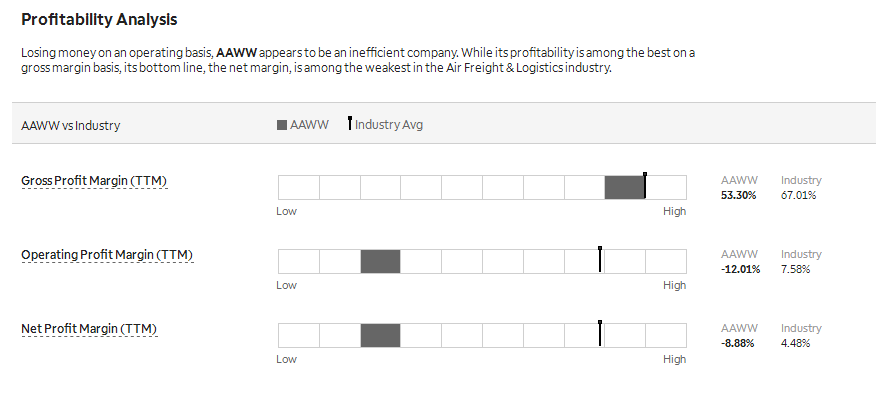
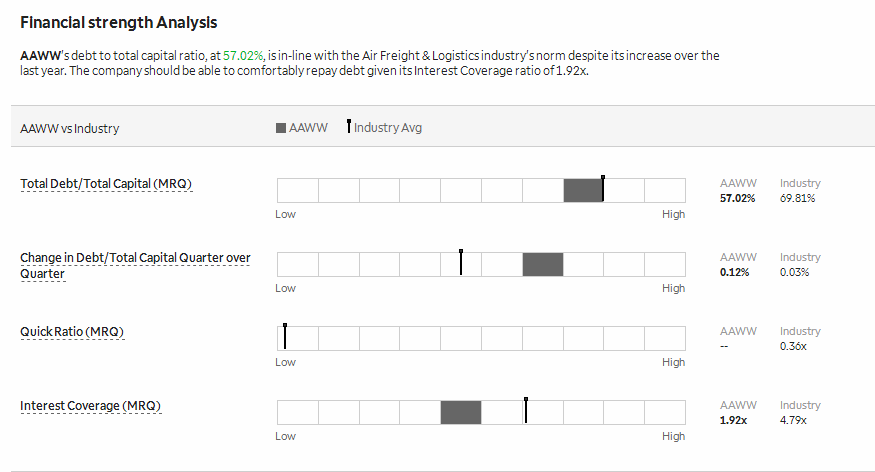
Financial Ratios |
. . . . . . . . . . . . Lowest to Highest, Compared to Industry
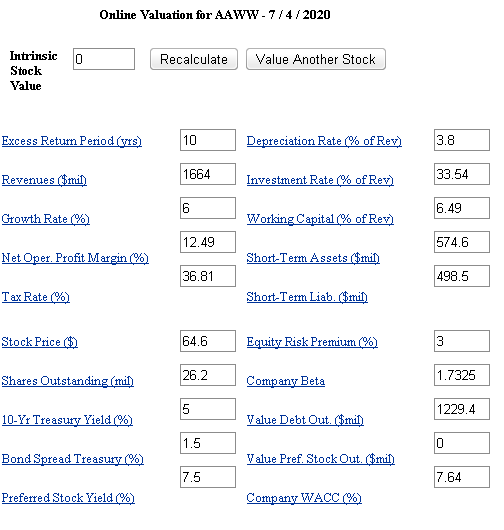
Intrinsic Value (DCF) |
Intrinsic Value by Discounted Cash Flow Method:
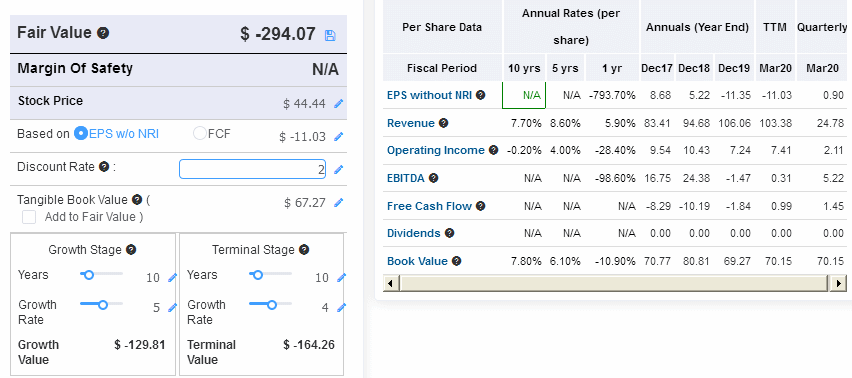
Fair Value Estimator |
Fair Value Estimate:
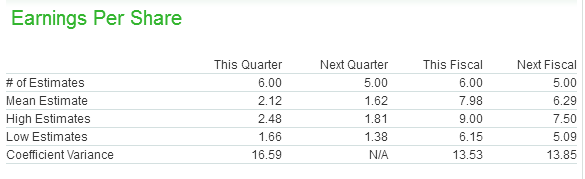
Projected Earnings |
Research Reports |
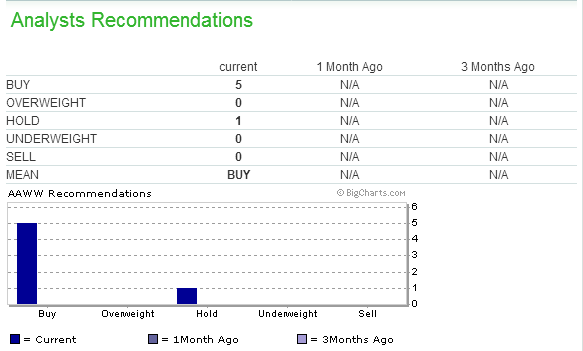
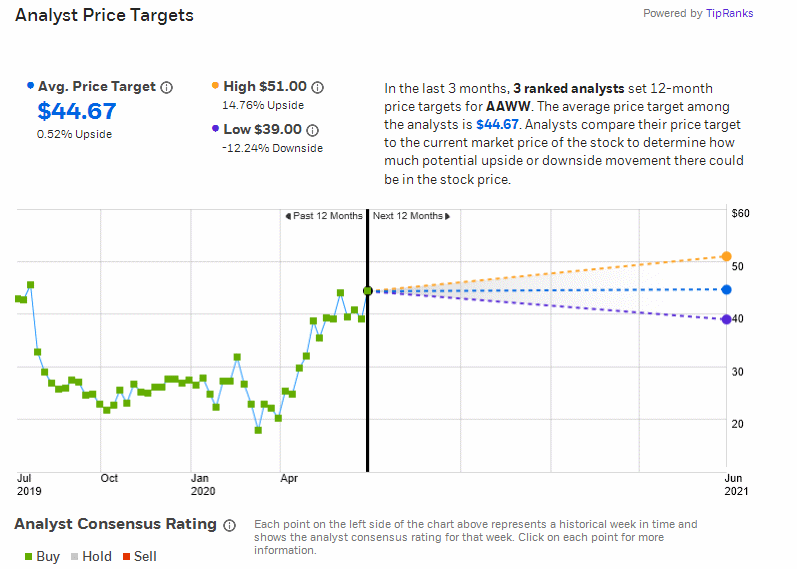
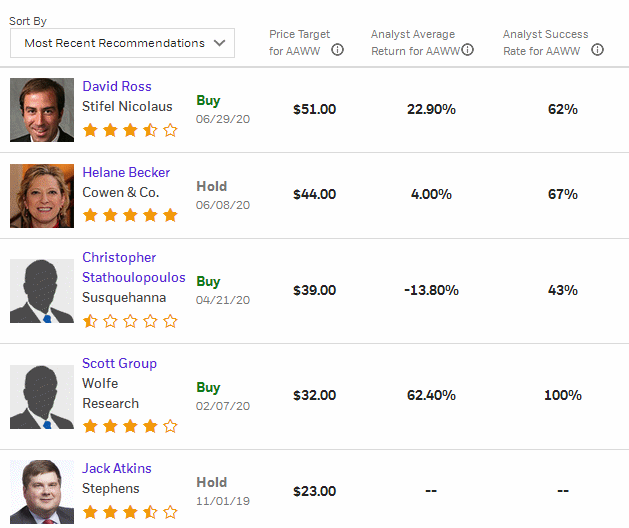
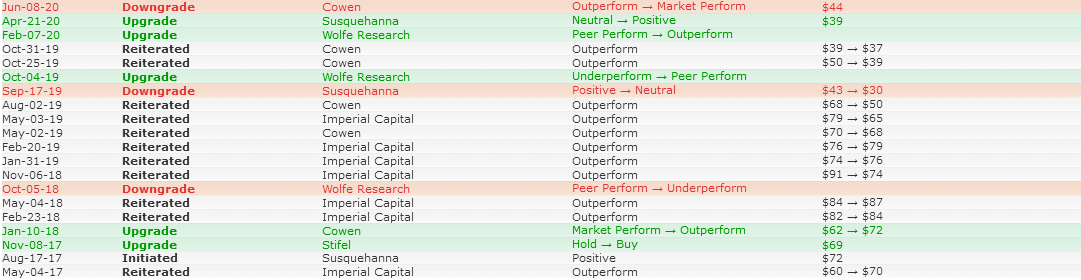
Analysts' Opinions |

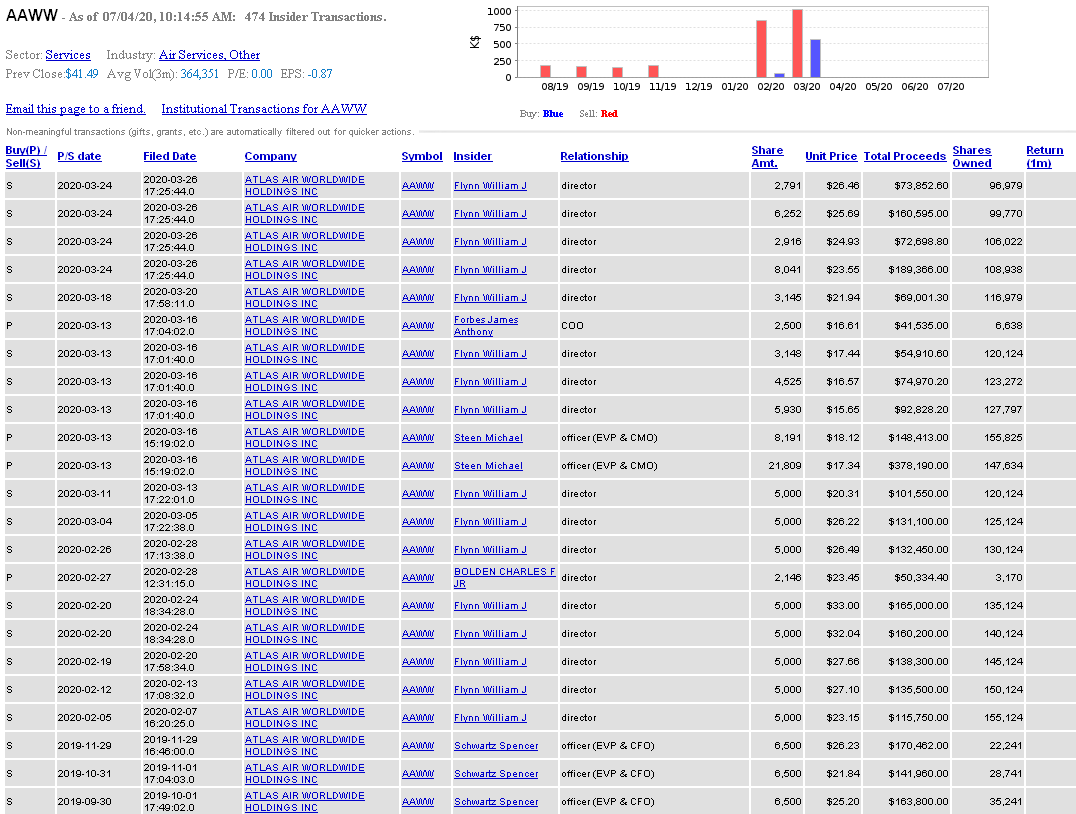
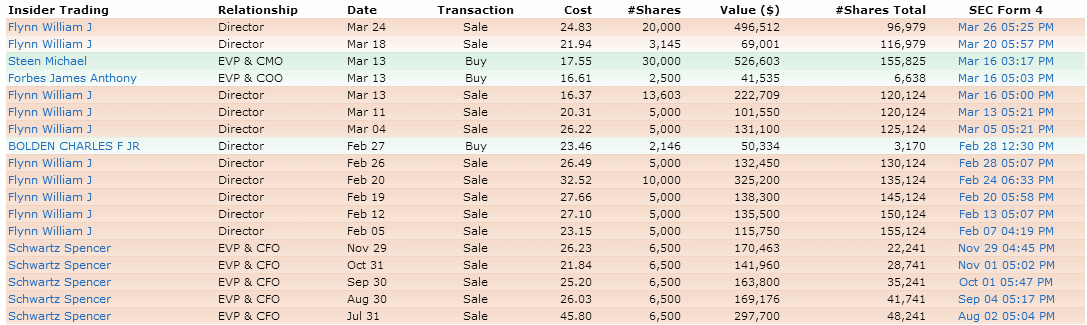
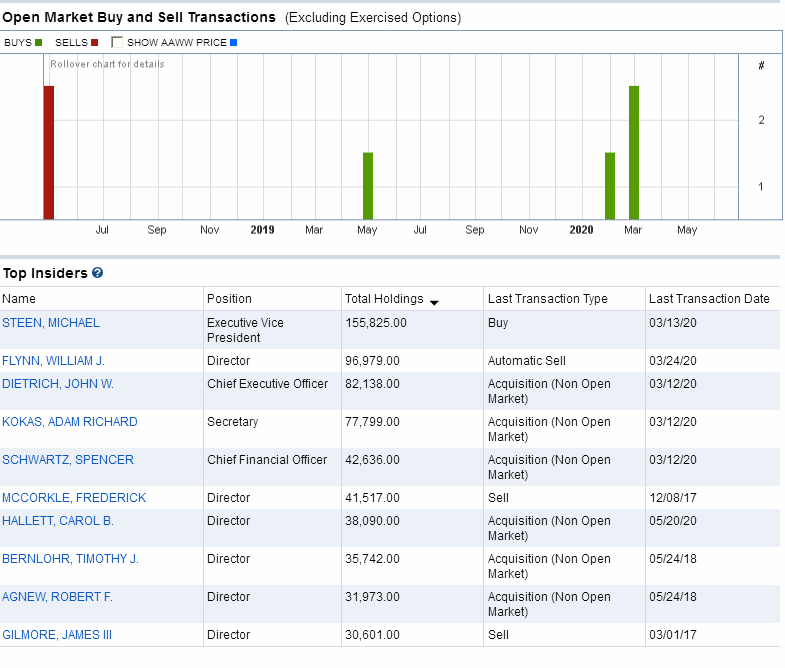
Insider Activity |
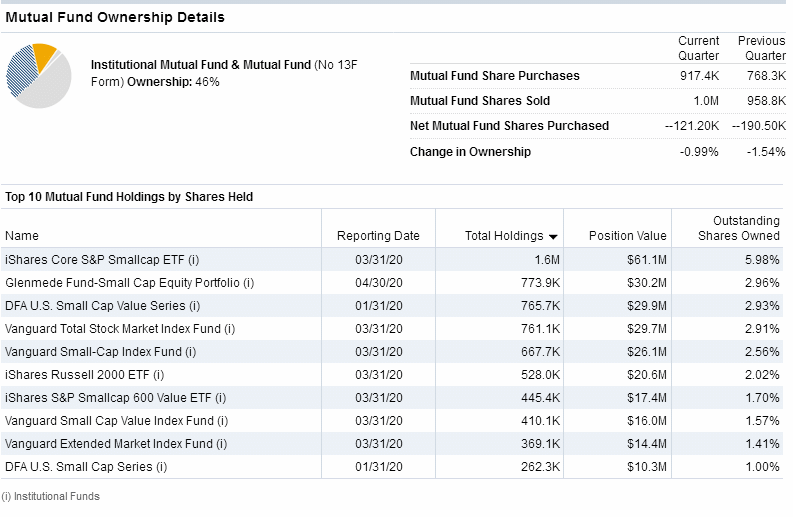
Institutional Activity |
Institutional Ownership:
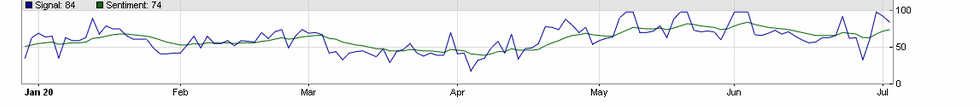
Sentiment |
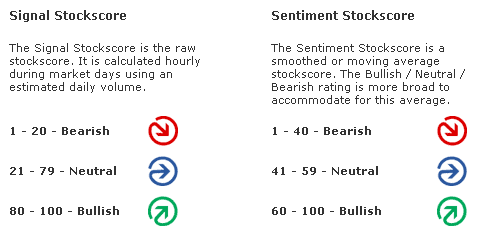
Zenith uses the "sentiment" score above or below 50 to award a positive or negative point in the Decision Matrix.

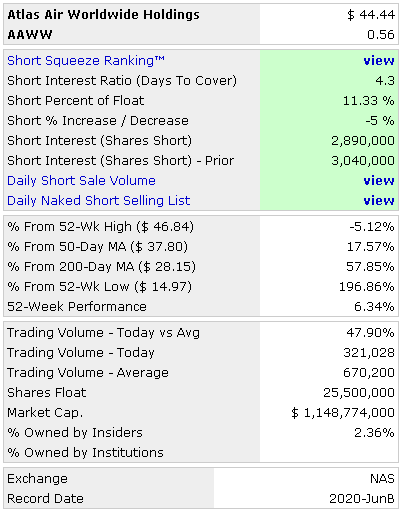
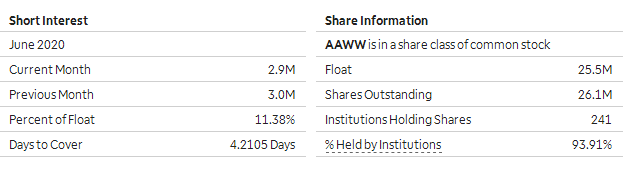
Short Interest Ratio |
As the short interest rises as a percentage of average daily share volume (Days to Cover), this is considered a measure of negative sentiment. Similarly, a decrease in that percentage is considered positive sentiment.
Standard & Poor's |
Management's Discussion of Results of Operations Excerpts |
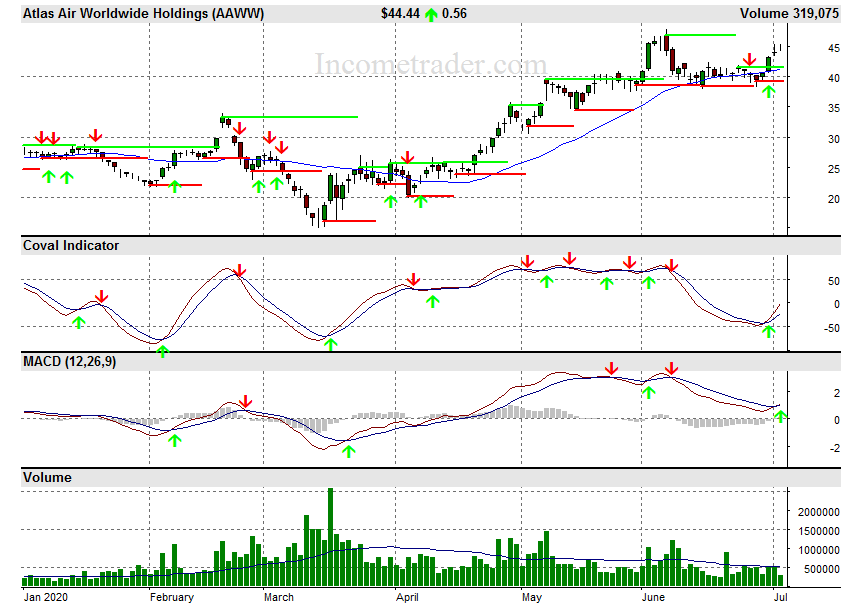
Channeling Potential |
The summary below includes a value for `Degree,' which refers on a
scale of 1 to 10 the range of a channel in the period under consi-
deration compared to the total range of price movement. It also looks
for the last closing price to be within the channel, otherwise zeroed.
The `Index' is the `Degree' weighted for volatility.  Generally, the
the higher the index, the more suitable is the stock for trading as
a `rolling stock' between channel high and low points.

Results for ATLAS AIR WORLDWIDE:
Symbol? AAWW
Total Months Available:  25
       Months in Cycle?   4

Months Covered by Periods:  12

Period 1           Period 2          Period 3
   H1      L1        H2      L2        H3      L3
  46.84   20.61     33.85   20.84     47.70   14.97

RANGE   =  47.70  TO   14.97            Close =  39.08
CHANNEL =  33.85  TO   20.84           Degree =   4
Volatility =  33.29%                    Index =  13
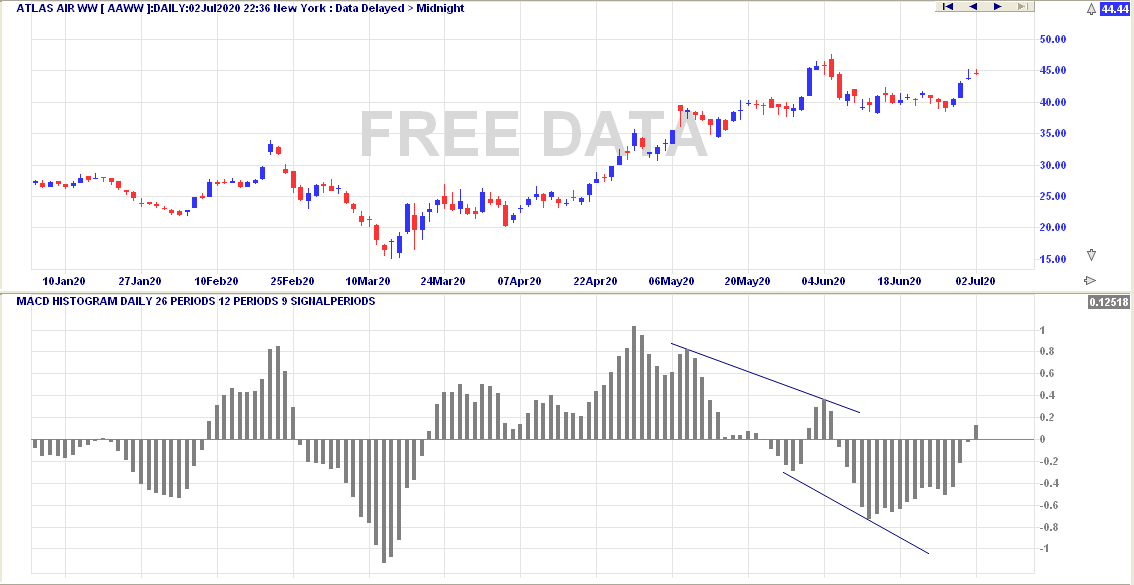
MACD Histogram Divergence |
The theory is that connecting the two most recent peaks or valleys of the MACD histogram will signal the direction of the next major move.
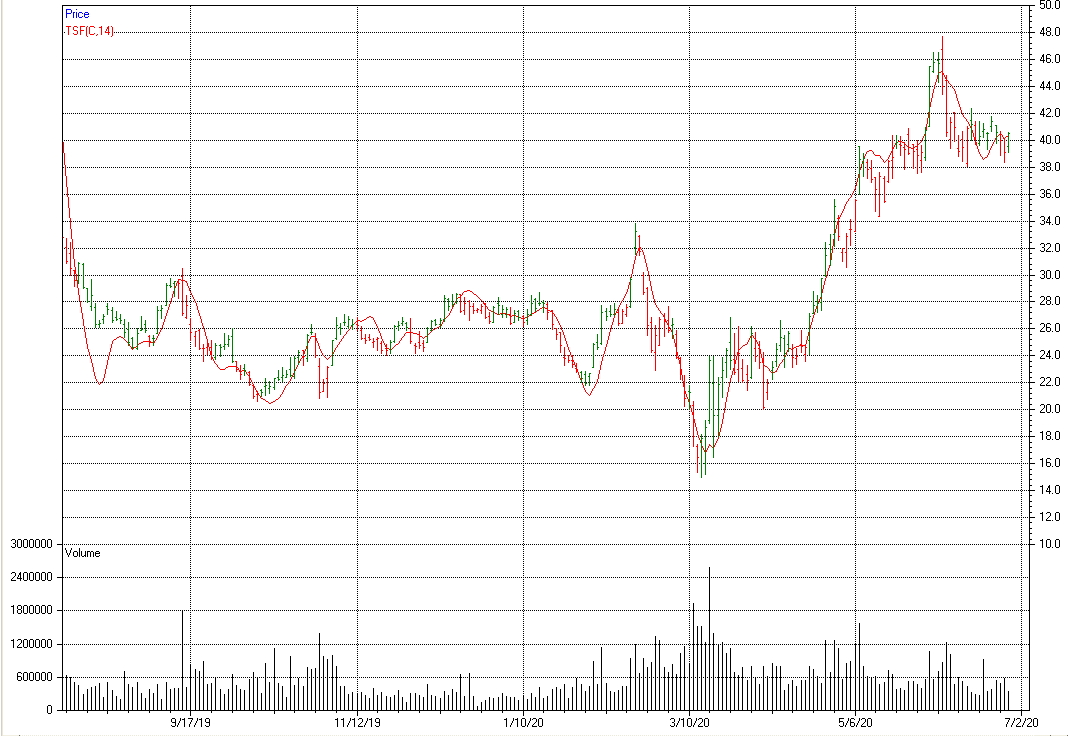
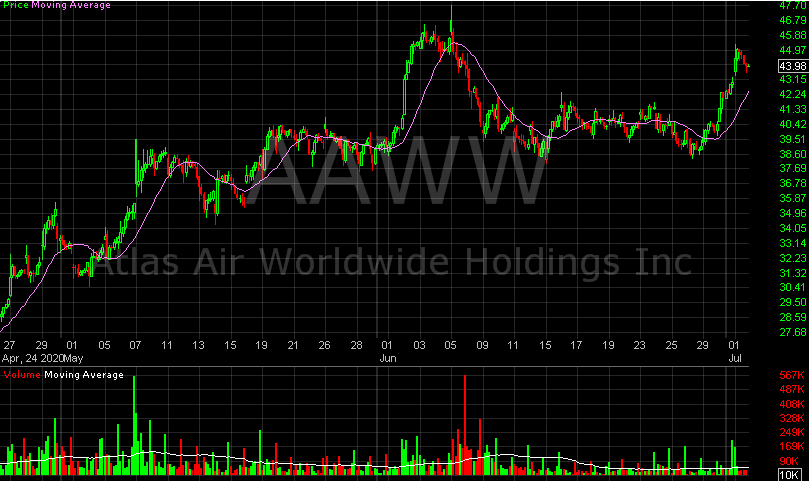
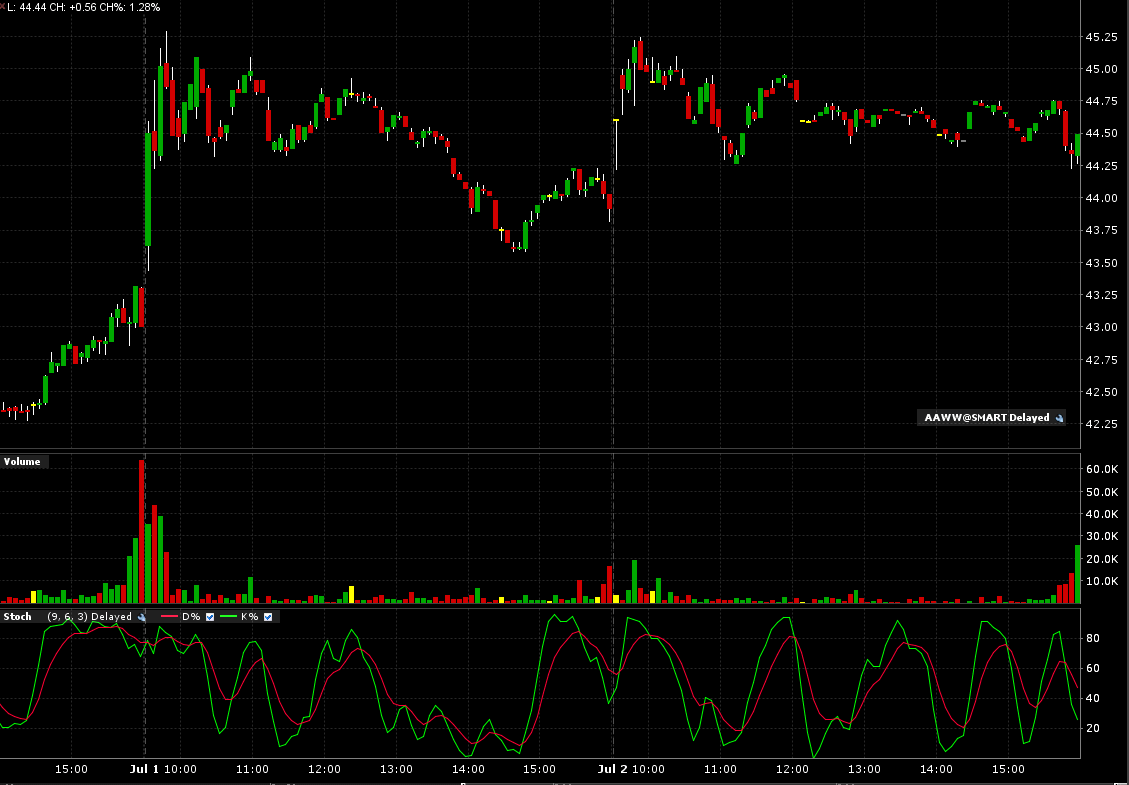
Intraday Chart |
2 Days:
Val Idea |
2 out of 8 favorable, (negative opinion.)

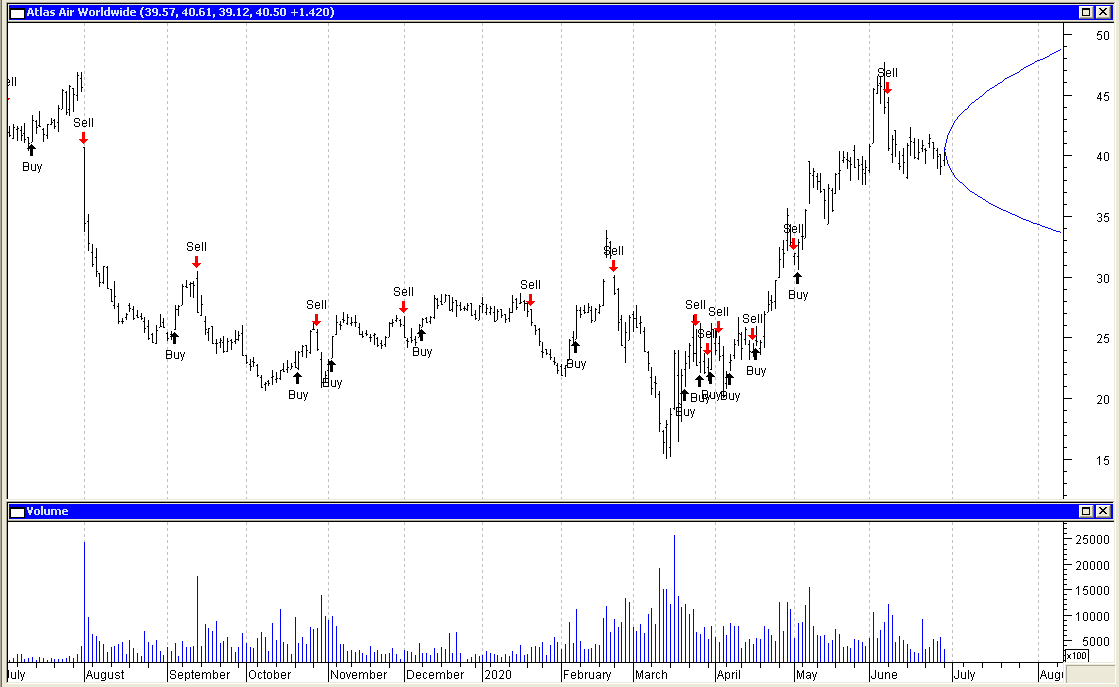
Stock Consultant |
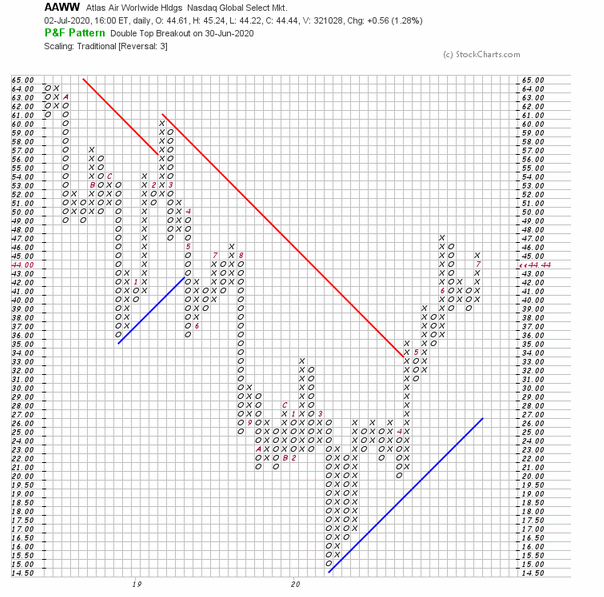
Point & Figure Chart |
Wall Street Analyzer |
Marketspace Chart |
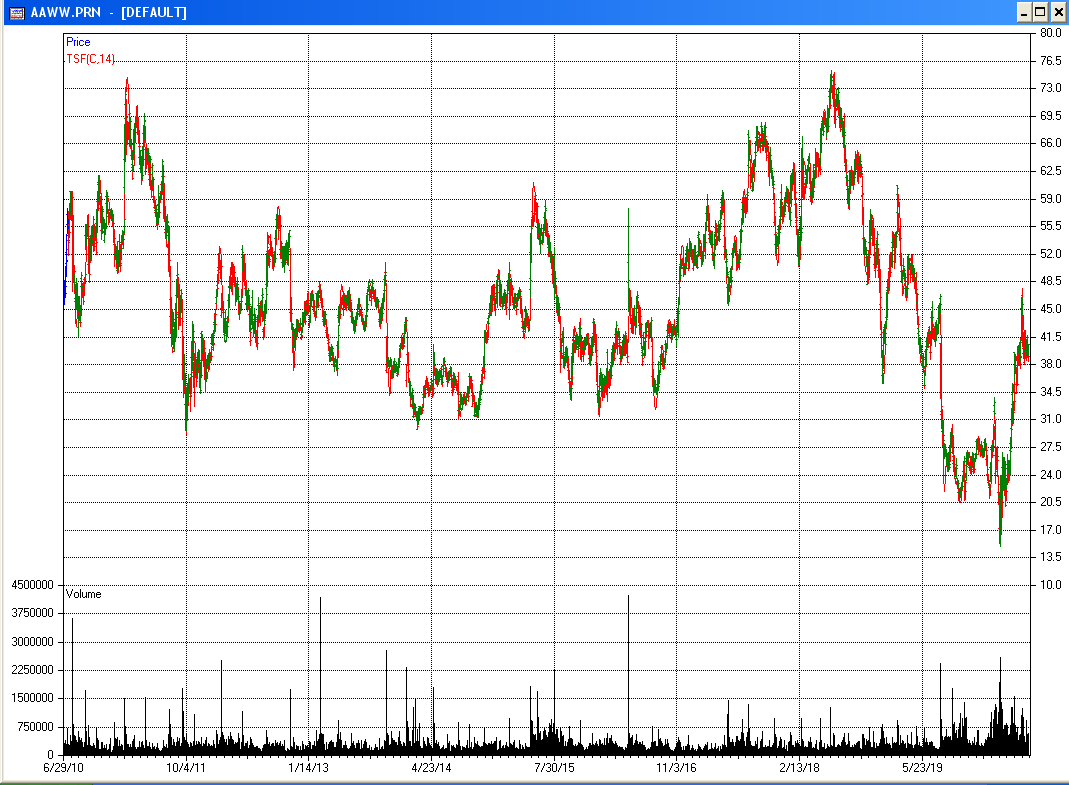
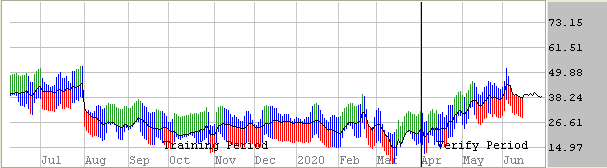
Time Series Forecast |
Neural Network Prediction |
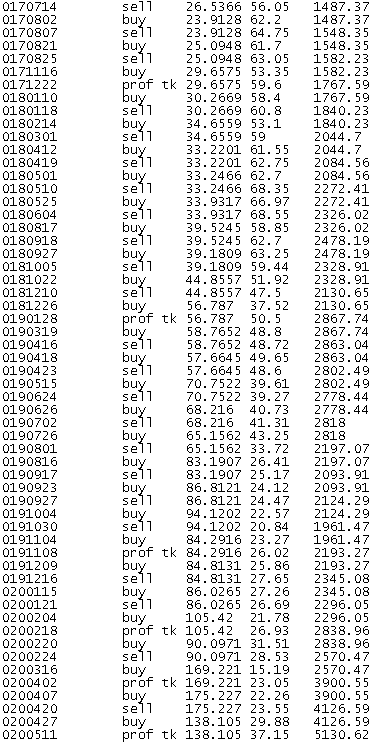
"Neurostock" can only track long trades. Therefore its performance, as tracked by itself on stocks which are consistently falling, may not appear as good as it could if each "sell" signal were a "short sale."
![]()

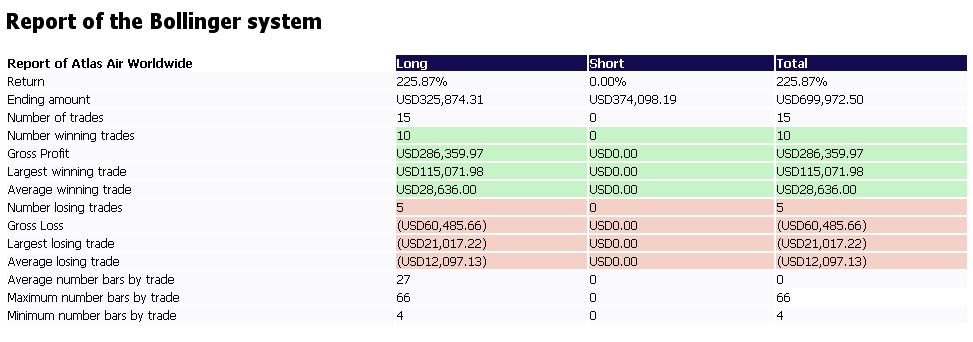
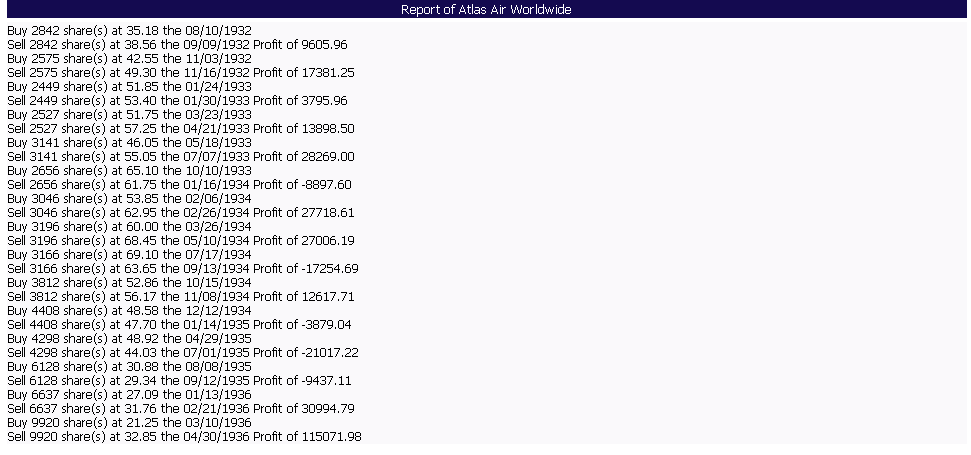
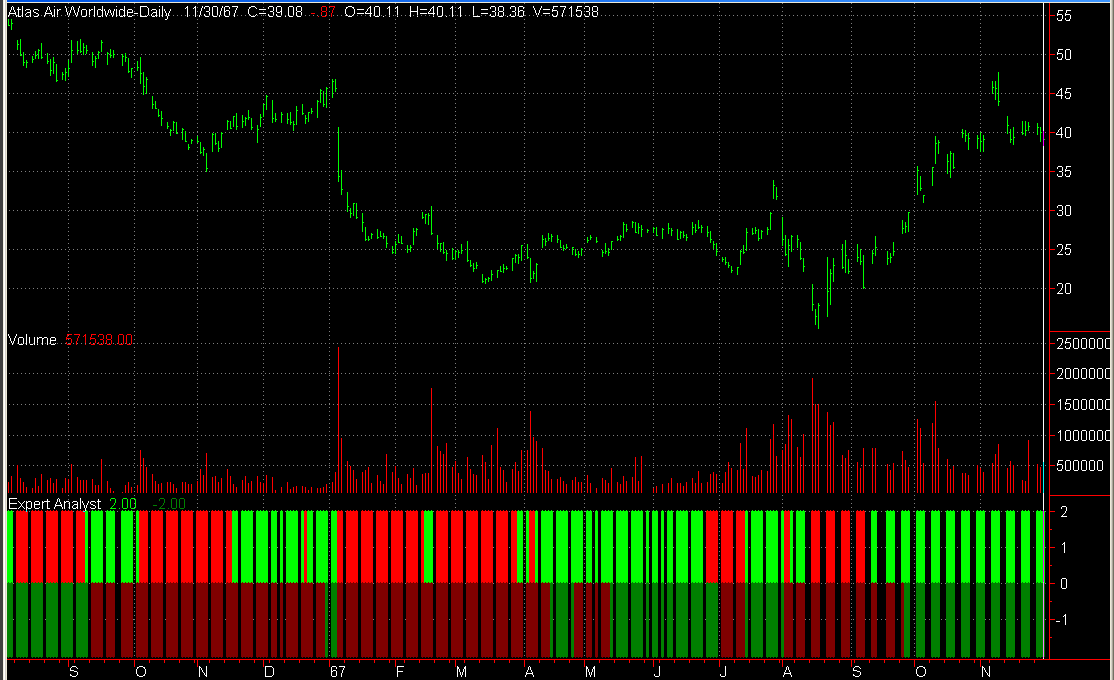
Ultimate Trading Systems |
3 out of 3 of the ultimate systems favor an upmove.
System Below:
Short term outlook: Positive: Bright Green, Negative: Bright Red
Long term outlook: Postive: Dark Green, Negative: Dark Red.
Recommendation |
| Factors | Weighted Points |
|---|---|
| News | + 1 |
| Comparison | - 1 |
| Industry | - 1 |
| Bond Issue | + 1 |
| Zenith Index | - 1 |
| Non-GAAP vs. GAAP Earnings | + 1 |
| Cash Flow | + 1 |
| Average to Current P/E | - 1 |
| Ratios | - 1 |
| Intrinsic Value DCF | - 1 |
| Fair Value Estimator | - 1 |
| Projected Earnings | - 1 |
| Research Reports | - 1 |
| Analysts | + 1 |
| Executive Perquisites | - 1 |
| Insider Activity | - 1 |
| Institutional Activity | - 1 |
| Management Reporting | + 1 |
| Short Interest | + 1 |
| Sentiment | + 1 |
| Standard & Poor's | - 1 |
| MACD Histogram Divergence | - 1 |
| Val Idea | - 1 |
| Stock Consultant | - 1 |
| Point & Figure | + 1 |
| Wall Street Analyzer | - 1 |
| Marketspace Chart | - 1 |
| Time Series Chart | + 1 |
| Neural Network | - 1 |
| Stock Options | + 1 |
| Ultimate Trading Systems | + 1 |
| Total | - 7 |
Place 675 shares of Atlas Air Worldwide Holdings, Inc.(AAWW) on the Active List.